💡Trade Idea #TRX/USDT:Keep an eye on #TRX. There is a potential for a massive movement upwards. Would be perfect to see a breakout and clean retest.
TRXUSDT_A98D8A trade ideas

Tron TRX: Looks Like It Will Dump Again?This looks like a cool rejection on a lower time frame, let's see how it pans out in next few days.
What are your thoughts about this analysis? Let me know in the comment box.
If this analysis makes sense to you, kindly follow me now for more, like, and support my idea.
Cheers!

waiting for opportunity im waiting it should touch the resestins level then go down ..
let see ..
wish u happy weekend

TRX/USDT 1DAY UPDATE !!hello, welcome to this TRX/USDT update by CRYPTO SANDERS.
CHART ANALYSIS:- Tron (TRX) rose to a multi-week high on Thursday, on the back of reports claiming that the blockchain sees nearly 5 million daily transactions.
TRX/USD peaked at 0.08322 earlier in the day, which comes following a low of 0.08043 the day before.
As a result of today’s gains, tron has now risen to its highest point since July 30, when the price traded at a high of 0.08395.
it appears that bulls are attempting to reach a ceiling at 0.08600, however, a hurdle on the relative strength index (RSI) seems to be preventing this.
Price strength is currently tracking at 67.89, which is marginally below a ceiling at the 68.00 level.
In order for bulls to capture their price target, this aforementioned resistance point will need to be broken.
I have tried to bring the best possible outcome to this chart.
Hit the like button if you like it and share your charts in the comments section.
Thank you

TRX: Resistance BreakoutTRON (TRX) technical analysis:
Trade setup : Following a bearish breakout from Channel Up pattern, price pulled back near $0.073 support and broke back above $0.08 resistance to resume uptrend, with upside to $0.086. It is also positive to see that during this recent downswing, price reached a bottom at ~$0.07 which was higher than during the prior major downswing at ~$0.065 and previous low of $0.06. That means price made a Higher Low , which is a bullish indication of buyers stepping up on major pullbacks.
Trend : Uptrend across all time horizons (Short- Medium- and Long-Term).
Momentum is Bullish (MACD Line is above MACD Signal Line and RSI is above 55).
Support and Resistance : Nearest Support Zone is $0.073, then $0.065. The nearest Resistance Zone is $0.080, which it broke, then $0.086.

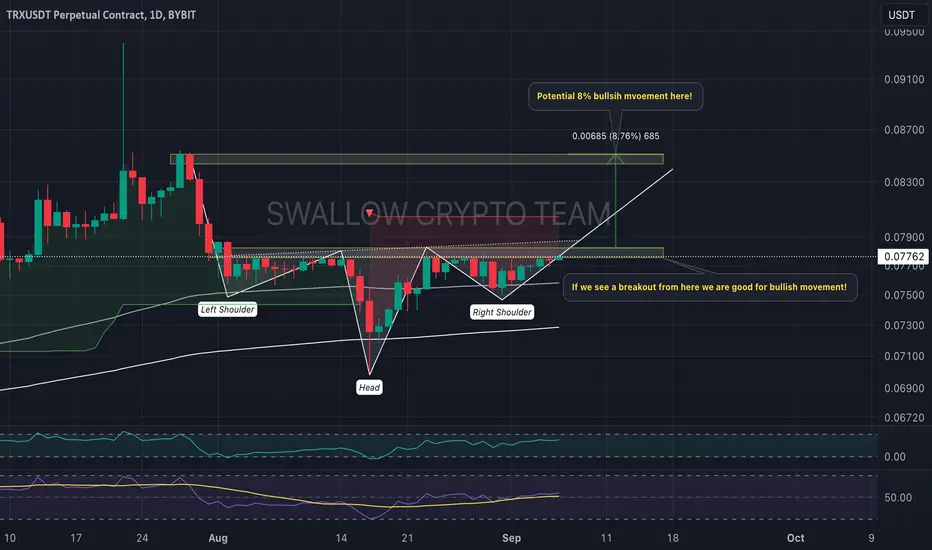
TRX/USDT Reversed "H&S" Pattern?Hey traders👋
TRX coin is another coin that got our attention here with a potential Reversed H&S pattern to be formed!
We see that RSI is in the golden middle line where we price is being held back by upper resistance zone near market price zone!
We are waiting for further confirmation of a breakout from current price before we would enter with a long position here! View is clean here and potential is also here!
If you like ideas provided by our team you can show us your support by liking and commenting.
Yours Sincerely,
Swallow Team
Disclamer:
We are not financial advisors. The content that we share on this website are for educational purposes and are our own personal opinions.
Keep uptrend even red marketWeekly Chart
Tron BINANCE:TRXUSDT has touched 4 times and bounced back from support by ascending trend line.
Chart 4H TF
Tron is in consolidation phase in range 778 - 795. It needs to confirm the support before go up on.
Wait for next move

TRX → a head and shoulders patternhello everyone...
as you can see trxusdt made a H&S pattern but we have not any confirmation that is a reversal pattern or a continuous one, however, the daily time frame shows us a bullish trend:
but it is great if we get a position after the breakout, so if the neckline breakout you can get a long position!
_______________________________
always do your research.
If you have any questions, you can write them in the comments below, and I will answer them.
And please don't forget to support this idea with your likes and comment

TRXUSDT FORECAST. SL - 0.07776 TP - 0.07595I am 75% confidence in this. i dont drop much but this should be a solid.

TRX/USDT 1DAY UPDATE BY CRYPTOSANDERS !!hello, welcome to this TRX/USDT update by CRYPTO SANDERS.
CHART ANALYSIS:- Tron is the current outlier in our list, as it managed to register an increase of 1.8% this week. This is surprising, considering most altcoins are in red
This performance can be explained by the price action, which placed TRX in an uptrend since the start of the year. The price has been making higher lows and higher highs for months now, and this has not stopped to date.
Tron has support at $0.077, and if buyers persist, they could take the price back to the key resistance at $0.086. If so, the uptrend would likely continue for some time still.
I have tried to bring the best possible outcome to this chart.
Hit the like button if you like it and share your charts in the comments section.
Thank you

#TRX/USDT breaks the Diagonal Trendline and testing it in 4-Hour#TRX/USDT breaks the Diagonal Trendline and testing it in 4-Hour TF!
If AMEX:TRX retested the Trendline successfully, we can short it. #TRXUSDT is at the major resistance level too. Be ready to Short it.

🔥 TRX Keeps Winning While The Rest LosesTRX has been trading in a very stable uptrend since the November FTX lows. Whilst the market has seen a lot of volatile ups and downs, TRX has been very gradually increasing in value.
Most important aspect of the chart is the bottom support of the parallel channel (the top resistance is a direct copy of the bottom support). This support has held 5-6 times already and doesn't look like it will fail soon.
I'm aiming for a longer-term move towards the top resistance.

TRXUSD ❕ uptrend lineTRX has fixed above 50EMA at 4H TF.
RSI is near neutral values (4H TF)
TD Sequential has formed an upward reversal signal at 30m TF.
I expect a rise after fixing above the support.

TRX .02c target Death ❌ Repeating Topping PatternNot financial advice
Even though my target is .02c it won't happen overnight
There will be small peaks and rises but my overall target rests at .02c
Should be entering Phase D of Wyckoff
Tried to explain on chart with the 4 broken trendline setup happening.
Currently testing bottom of the 4th trendline.
My personal belief is the once we lose this 4th trendline we repeat what we did at the top at .16c when we lost 70%
We lost that 1st trend at .07c
Now apply that -70% loss from .07c we have a target as low as .015
Always DYOR
Practice patience
#PIK
Patience is Key
#TLAW
Think Like A Whale

TRX Buy trade.Here is My Study On TRX
Welcome to my channel! Here you'll find daily technical analysis ofthe latest trends in the crypto market. From Bitcoin to altcoins, I'lIl be sharing my insights and predictions to help you make informed decisions
about your investments. Follow me for the latest updates and join the conversation in the comments!
Crypto technical analysis uses past price history to predict future price. It's not a guarantee and shouldn't be relied on solely for investment decisions. Consider other factors such as market trends, economic strength and
information dissemination. Use with caution.
This Is Not A Finacial Advise

What to Expect NextOn the daily chart, there's an upward trend pattern. Right now, the price is testing a barrier at $0.078. If it manages to break through this level, we can expect the price to continue rising, possibly reaching $0.085. However, if the price can't surpass this resistance, we might see it drop down to around $0.072.
Additionally, the Relative Strength Index (RSI) currently stands at 54. This level indicates a moderately strong momentum in the market. It suggests that there is some bullish sentiment, but it's not too extreme. Traders are neither overwhelmingly buying nor selling at this point.


TRXUSDT 8HInverse Head & Shoulders formation on 8H chart. Wait for breakout of the neckline. Then target will be $0.08

Despite Macro Bearish Conditions TRX Remains Set for New HighsThis is a follow-up to this trade below:
TRX has been holding up here in this zone despite the bearish price action on the macro, has recently started to press up against the resistance zone above, and has also once again defended its bullish trend line. If this price action continues, we could very soon see TRX jump up to the upper end of the range at around 18 cents before pausing for a bit. The overall target for the wave structure, as can be seen in the original post, is 42 cents at a 1.618 extension, but this lower 18 cent target is for more midterm trades entering off the bullish trend line right now.

An opinion for trxI think a good move gonna be happen on this area, they say for this pattern "diamond”
I'm thinking for long position, may bitcoin help us with this … *

TRON IN CONTROL OF BULLSINVERTED H&S pattern has been formed on TRON and what I'm waiting for is the breakout and retest at the neckline to take it to the upside.
Target - 0.08500

$TRX Ready to pump? This #TRX Daily bullish formation (1D TA) will pump after the 4 hourly confirmation with a new local high (4H TA)
Just take a look at the daily clean higher-low formation. Keep it simpel
Bullish price targets on daily term
~ 0.08529 (based on Prev drop-off)
~ 0.09575 (based on 2.618 Fib)

TRX fall out of the bullish triangle ?"Over the past days, the TRX cryptocurrency has been steadily constructing what appeared to be a promising bullish triangle pattern. This technical formation, characterized by its converging trendlines and diminishing price volatility, had ignited anticipation among traders for a potential upward surge in value.
However, recent market developments have shifted this optimistic sentiment. The TRX token seems to have broken free from the confines of the bullish triangle. This breach marks a pivotal moment, suggesting a potential change in the prevailing market dynamics. The breakout from the triangle indicates a shift in the balance between buyers and sellers, and it's crucial to assess the implications of this movement.
As the breakout unfolded, the TRX price underwent a testing phase, revisiting the ascending trendline that had previously guided its upward trajectory. This retest of the trendline can serve as a critical confirmation of the triangle's breakdown, potentially signaling a shift towards a downward trend. Traders and analysts are now closely watching whether the price manages to sustain itself above this level, which could indicate a potential recovery, or whether it succumbs to the pressure, implying a further decline in value.
