SPY (S&P 500 ETF) – Inflection at Fib Resistance | Dual-Scenario🗓️ June 2, 2025 | 📈 1H Chart | ⚠️ Risk-Off Signal Building?
🔹 Current Price: $592.98
🔺 Key Resistance: $595.54–$597.36 (1.0–1.236 Fib Extension)
🔻 Gap Support: $565.51
🎯 Bullish Target: $604.05–$604.90 (1.382–1.618 Extension)
🔎 Technical Structure:
Trendline Rejection Zone: SPY is pressing into a multi-tap descending resistance. Any failure to break convincingly could invite strong selling.
Fibonacci Overlap: $595–597 aligns with major Fib extensions—potential exhaustion zone.
Gap Unfilled: The $565.51 gap remains untested and could magnet price in the event of a rejection.
Volatility Funnel Forming: Narrowing structure implies imminent directional move.
🌐 Macro Landscape:
Fed Watch: The June 12 FOMC is the next volatility trigger. Fed Funds Futures are pricing in only a ~10% probability of a cut. Hawkish hold expected.
Earnings Season Winds Down: Lack of new fundamental catalysts could increase technical relevance.
Liquidity: Reverse repo balances are falling, suggesting reduced short-term liquidity—typically bearish for risk assets.
Inflation Watch: Sticky Core PCE remains above 2.75% YoY—Fed unlikely to ease aggressively.
📉 Risk Management:
Short Bias Setup:
Entry: $595–597 rejection
Stop: $598.5–599 (Above 1.236 Fib)
Target: $577 (mid-Fib) → $565.51 (gap close)
R:R ~3:1
Bullish Breakout Plan:
Entry: Confirmed breakout + hold above $598
Stop: $593.50
Target: $604–605
R:R ~2.5:1
Volatility Hedge: Consider using VIX calls or SPX put spreads to hedge directional risk around key Fed dates.
🎲 Probabilities:
Scenario Chance Commentary
Pullback to $565 Gap 65% Strong resistance + weakening breadth + macro headwinds
Breakout to $604 35% Requires bullish macro surprise or liquidity-driven melt-up
🔔 Action Plan:
Fade rallies into resistance unless a high-volume breakout confirms. Use stop discipline and hedge exposure into macro events. Stay nimble.
💬 Thoughts? Are we due for a flush or prepping for a face-ripper?
1557 trade ideas

SPY/QQQ Plan Your Trade For 6-3 : Carryover in Carryover modeToday's pattern suggests we may see more upward price consolidation/trending.
As many of you already know, I've been tracking the Excess Phase Peak pattern all the way up this incredible rally from the $480 lows on the SPY. In my opinion, we have moved into the "island" topping phase where price is struggling to break either upward or downward right now.
Currently, price seems to be attempting to break to the upside after yesterday's meltup. Today should be interesting because we could see solid REJECTION of yesterday's move with a big breakdown move. We'll see how things play out.
The SPY trend is still BULLISH based on my research. Thus, until and IF we get a breakdown, traders should continue to expect a MELT UP type of trend in the SPY/QQQ.
Hedging trades is a good idea right now.
Gold and Silver had a big move early this week and have not stalled into a sideways FLAGGING trend. By my estimates, the APEX of the flag will come near 1900-2100 today (Wednesday 6-3). That is when I think Gold/Silver will attempt to move into extreme volatility and attempt to make another big move.
I hope it is to continue the upside price trend, as this breakout move needs to push higher (breaking recent highs) for metals to move into a new dominant upward price trend.
BTCUSD is trading sideways - possibly setting up that DOUBLE-TOP pattern I suggested was going to take place on 5-20-25. Now, with Bitcoin leading the US markets by about 3-5 days (on average), we'll see if BTCUSD can attempt to move into another rally phase or if BTCUSD breaks below the $103k level and moves into a new downward price phase.
In my opinion, look out below.
Get some.
#trading #research #investing #tradingalgos #tradingsignals #cycles #fibonacci #elliotwave #modelingsystems #stocks #bitcoin #btcusd #cryptos #spy #gold #nq #investing #trading #spytrading #spymarket #tradingmarket #stockmarket #silver

SPY/QQQ Plan Your Trade For 6-2 : Post Market UpdateHuge move for metals today. Absolutely incredible.
Hope you GOT SOME.
BTCUSD and the SPY/QQQ stalled somewhat flat today. SPY was up 0.50% - nothing huge.
Going to be interesting to see how things play out in the Asian/European markets tonight.
Buckle up. Could be some very big moves hitting this week.
GET SOME.
#trading #research #investing #tradingalgos #tradingsignals #cycles #fibonacci #elliotwave #modelingsystems #stocks #bitcoin #btcusd #cryptos #spy #gold #nq #investing #trading #spytrading #spymarket #tradingmarket #stockmarket #silver

Nightly $SPY / $SPX Scenarios for June 4, 2025🔮 Nightly AMEX:SPY / SP:SPX Scenarios for June 4, 2025 🔮
🌍 Market-Moving News 🌍
🌐 Markets Rally on Chinese PMI Surprise
China’s Caixin Manufacturing PMI unexpectedly climbed to 50.8 in May, signaling expansion in smaller export-focused factories. Asian markets jumped, lifting U.S. equity futures as investors recalibrated global growth expectations .
📉 U.S. Factory Orders Remain Soft
April’s U.S. Factory Orders fell 0.4%, underscoring persistent weakness in industrial demand amid elevated input costs and trade uncertainty. Declines in durable-goods orders weighed on industrial stocks .
🏦 Fed’s Bowman to Speak on Economic Outlook
Fed Governor Michelle Bowman is scheduled to deliver remarks at 2:00 PM ET, likely emphasizing caution on future rate moves given mixed data. Markets will watch for any shifts in tone regarding inflation risks and labor-market resilience .
🛢️ Oil Prices Slip on Rising U.S. Inventories
U.S. crude inventories rose by 3.8 million barrels last week, according to API data, pressuring oil prices lower and dragging energy shares down as supply concerns outweighed strong demand signals .
📊 Key Data Releases 📊
📅 Wednesday, June 4:
2:00 PM ET – Fed Governor Michelle Bowman Speaks
Remarks on economic outlook and monetary policy, watched for any hints on the Fed’s next moves.
⚠️ Disclaimer:
This information is for educational and informational purposes only and should not be construed as financial advice. Always consult a licensed financial advisor before making investment decisions.
📌 #trading #stockmarket #economy #news #trendtao #charting #technicalanalysis

SPY New All Time Highs IncomingThe #SPY weekly chart is so bullish but don't take my word for it.
Simply look at the weekly bullish crossover that occurred between the 7 week & the 20 Week MA.
The last time this occurred was in Nov 2023 and the markets ripped 19% before having a major 3 week pullback and then another soaring continuation higher.

Bullish Intraday Patterns Everywhere!SPX had a wonderful intraday hourly chart confirmed breakout. This pattern is bullish and likely will continue higher.
The bulls tomorrow would love to confirm the daily chart breakout and will try to push for that.
SPY/SPX is holding more relative strength than the Q's & IWM which is displaying broad participation.
There are many bullish charts showing accumulation, golden crosses and bullish MA crossovers.
The DXY appears to be wanting to break down to around $97.00 which should yield more upside.
We secured profits today on SPY 594 calls & NVDA 144 calls.
We still remain net long and see the S&P 500 over $6000
Apple, XYZ, AI - are bullish setups were continuing to manage.

SPY/QQQ Plan Your Trade For 6-2 : Gap Breakaway PatternToday's pattern suggests the SPY may attempt a GAP Breakaway in Trend mode (likely BULLISH). But, the Russia/Ukraine war is overshadowing that potential pattern as big news this morning.
From what I can tell, Russia is mounting a large-scale attack after Ukraine launched a big drone attack targeting Russian aircraft.
No matter how you slide and dice this news, it means this conflict is entering a new phase. A possibly much more destructive phase for all involved.
Gold and Silver are reacting to this news by skyrocketing higher. I believe this upward move in metals could continue for many days/weeks as long as this conflict continues to grow.
BTCUSD is trading slightly downward right now, but not as much as I would have expected based on the news. We'll see how BTCUSD plays out this week and if we get a bigger breakdown over time.
Currently, if you had actively hedged your positions, I believe you will be OK this week as Metals seem to be the big movers right now. The SPY/QQQ should react to this war news, but being somewhat isolated from this conflict economically, we may not see any huge moves in the US markets today.
Overall, hedge your positions to protect against surprise news/risks and try to prepare for the longer-term swings. Volatility will stay elevated over the next few weeks..
So, GET SOME.
#trading #research #investing #tradingalgos #tradingsignals #cycles #fibonacci #elliotwave #modelingsystems #stocks #bitcoin #btcusd #cryptos #spy #gold #nq #investing #trading #spytrading #spymarket #tradingmarket #stockmarket #silver

SPY: New Month of June! :O Hey everyone,
Entering a new month, how exciting.
Hope you all had a great weekend and have a great week ahead!
As always, safe trades and take care!

SPY: Bullish Outlook Based on Market StructureETF Strategy: Still Buying for 2025 Growth
I'm continuing to buy SPY and adding other strong ETFs like VEA, QQQ, and TQQQ. The market structure looks solid after the recent bounce, and I’m positioning for continued growth through the rest of 2025. My goal is to close the year with a strong percentage gain.

600 before 580?, Jolts, Jobs Data, calling China🎮 What’s Happening Now:
1. The market trades like a simulation.
Levels get hit to the penny and reverse.
Fake breakouts, engineered sweeps, and chop-fests designed to trigger stops and crush premium.
It’s like trading inside a casino that reads your mind and moves the exit every five minutes.
2. AI + HFT firms front-run sentiment and order flow.
They scan Reddit, Discord, X, TradingView, and even order book imbalances in real time.
The second you find an edge, they’re already there—front-running or fading it.
3. Implied volatility and option decay weaponized.
They bait you in with movement, then nuke premiums before you can cash out.
If you're not closing green trades fast, they flip red—"correct trades, wrong time frame" syndrome.
⚖️ What Retail Is Up Against:
Smart order routers sniffing your orders.
Liquidity gaps intentionally created then filled.
Volume surges that mean nothing—just decoys.
AI-driven volume clusters that draw you in and dump you out.
💡 What some traders are doing to adapt:
Selling premium with iron condors, calendars, butterflies—less directional, more probability-based.
Trading futures or futures options, where fills are better and data is cleaner.
Sniping high-R:R setups, holding nothing overnight unless it's ironclad.
Using AI to fight AI—some build their own bots to scan volume shifts, OI skews, or gamma pins.

579 gap will be filled.Happens all the time. Chart shows an incredibly large gap. if you lower the deviation on your gap indicator a small gap can appear below this very large gap. i have seen on numerous... NUMEROUS occasions when this gap gets filled and then has a nice rebound(not necessarily sustained). I don't know if it will happen tomorrow, but if there starts to be a sustained selloff in the days ahead i will feel confident that this is the target. 579 is the price. again, it could happen on monday or it could happen next monday. i have no idea what the market is going to do from day to day, but keep this level in mind.

SPY dowsing roadmap for this weekI've been posting the weekly readings my dowsing has given for SPY's potential price movement the past couple months and it's really interesting.
I go week by week, but am starting to include each day of the week looking forward. I left on the chart the prior notations from those ideas I've posted & you can reference what I had versus what actually occurred.
This week is quite negative. I've had the number around $562-62 coming up for a while, & beyond that, around the $542-48 area as I recall. I don't really get any positive gain over last week's close.
We'll see what happens.

$spyyieahhh
Back after getting crushed last 2 months, but hey at least we are having fun 'they say'.
Interesting set of patterns. long term uptrend. Looking at a dip to 563 over next month hopefully.
Bunch of confluences there:
1. High volume at 560 (there's a volume gap right below 585 which would make this a quick move down.
2. Mid point of the long term parallel channel.
3. 61% fib of entire move down.
You would expect next long term target to be the upper test of the channel, 620s. Let's see how this move down, if we have any goes. Yieahhhh

SPY Trapped in Gamma – Big Move Loading or Just Dealer Chop?
📊 SPY GEX Daily (Options Sentiment Breakdown)
SPY closed at $589.39, and we’re now seeing tight compression between call resistance at 592–595 and heavy put walls down at 586 and 580. Gamma is stacked on both sides — a dealer tug-of-war. Unless we break cleanly above or below this zone, expect whipsaw chop.
GEX Breakdown:
🟩 Call wall at 595, with strong dealer hedging from 592 up to 600.
🟥 Massive negative GEX starting at 586 → 580 → 575, all with dense put walls (–79.88% at PUT Support).
🔻 IVR is 18 and falling – nobody’s paying up for protection yet, but things could move fast once they do.
💡 Options Playbook (Based on GEX):
Neutral-to-Bearish: Fade pops near 592–595, use 595c/600c credit spread or play 585p/575p vertical if 586 breaks.
Bullish Flip: If we break and hold over 595, gamma flips positive fast → play Jul 19 600c or 595/605 spread.
This is a gamma box — price likely stuck 586–595 unless volume shifts dealer hedging or macro breaks out.
🕵️♂️ 1H Price Structure (Swing & Intraday Planning)
SPY 1H still showing weak structure. Multiple CHoCHs and BOSs bouncing around the same zone. Price got rejected from the purple supply at 592, and is now hovering around 589–590, still trapped under a descending trendline.
What stands out:
📉 Structure = lower highs + broken BOS → short-term bearish.
📦 Supply pressure between 590.5–593.9, demand sits down at 573–576.
💣 Bearish readings across BBP, MACD, Stoch — and market breadth thinning.
📈 Swing Bias:
Short under 590–592 → target 586 first, then 580 if momentum kicks in.
Bullish case only resumes on clean break above 595.
📊 Intraday Plan:
Fade pop to 590.5–592 for scalp short (look for lower highs).
Bounce off 586 is playable for scalp long — but keep stops tight.
Until SPY breaks out of this gamma trap, you want to scalp or spread trade with discipline. No need to swing for home runs here.
🧠 Final Thoughts
SPY is pinned between high call resistance and aggressive put support. The GEX box says: "Be patient or get chopped." We need either macro news or volume spike to break the hedging stalemate. IV is low, so positioning ahead of a breakout (via spreads or small directional bets) could pay off — just manage size tightly.
⚠️ Disclaimer:
This is educational commentary only. Always manage your own risk, and never trade based on someone else’s analysis alone.

SPY Weekly Options Outlook — June 1, 2025📉 SPY Weekly Options Outlook — June 1, 2025
🚨 AI Model Consensus: Moderately Bearish into June 6 Expiry
🧠 AI Model Breakdown
🔹 Grok (xAI)
Bias: Moderately Bearish
Technical: Price below 10-EMA, RSI cooling, MACD divergence.
Trade: Buy $589P @ $4.72 → PT +50%, SL if SPY > $591
🔹 Claude (Anthropic)
Bias: Moderately Bearish
Technical: Short-term cooling, daily trend still intact.
Trade: Buy $573P @ $0.94 → PT 100%, SL 50%, exit by Wed
🔹 Gemini (Google)
Bias: Neutral
Technical: M5 bearish, daily bullish = mixed.
Trade: No trade today due to inconclusive bias
🔹 Llama (Meta)
Bias: Slightly Bullish
Technical: M5 bullish EMAs, daily MACD bearish
Trade: Buy $590C @ $5.20 → PT +20%, SL −50%
🔹 DeepSeek
Bias: Moderately Bearish
Technical: Breakdown below support, MACD/RSI bearish
Trade: Buy $588P @ $4.27 → PT near $585, SL at $590.50
✅ Consensus Takeaways
4 of 5 models favor bearish or moderately bearish direction
Max Pain at $585 = common gravitational level
Momentum showing weakness, especially intraday
Only Llama sees upside bias; Gemini stays out due to signal conflict
🎯 Recommended Trade Setup
💡 Strategy: Bearish Naked Weekly Put
🔘 Ticker: SPY
📉 Direction: PUT
🎯 Strike: $588
💵 Entry: $4.32 (ask)
🎯 Profit Target: $6.00 (+39%)
🛑 Stop Loss: $2.16 (−50%)
📏 Size: 1 contract
📅 Expiry: 2025-06-06
⏰ Entry Timing: Market Open
📈 Confidence: 70%
⚠️ Key Risks to Monitor
⚖️ Daily uptrend still intact — bounce possible at support
📉 Low VIX = limited volatility expansion (slower premium growth)
🔺 Watch for quick reversals or news spikes above $590 that can hit stop-loss
⌛ Theta ramps midweek — trade must move early
📊 TRADE DETAILS (JSON)
json
Copy
Edit
{
"instrument": "SPY",
"direction": "put",
"strike": 588.0,
"expiry": "2025-06-06",
"confidence": 0.70,
"profit_target": 6.00,
"stop_loss": 2.16,
"size": 1,
"entry_price": 4.32,
"entry_timing": "open",
"signal_publish_time": "2025-06-02 09:30:00 UTC-04:00"
}

$spyyieahh
Retest of mid line parallel.
Let's see how thos one works out, by 28 July we should see that touch of mid line and then boom or bust ?

Bearish Trend Starting SP500 SP:SPX AMEX:SPY Cannot Across 605 with MACD crossdown & RSI top lower
Last Support 593 If Breakthrough That Signal Confirm Complete Down Trend

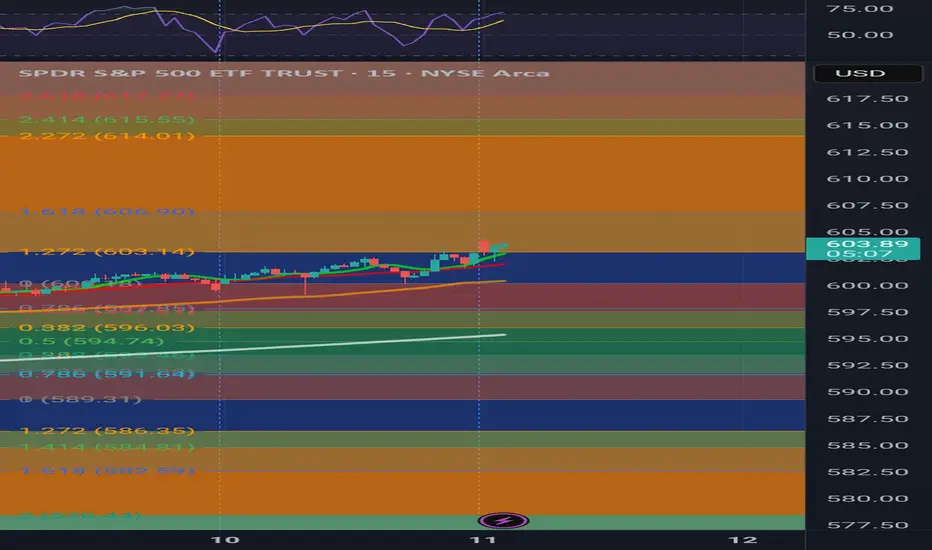
Jeremy Chew SPY Notes 6/12/2025🧠 SPY (SPDR S&P 500 ETF) — Technical Summary
Chart Timeframe: Daily (1D)
Latest Close: ~$603.75
After-Hours Price: ~$595 (notable drop of ~1.45%)
🟩 Recent Price Action:
Strong rally off March/April lows (~458) has pushed SPY through major Fibonacci levels.
Sharp uptrend support (green line) has held since bottom, but is now being tested.
Today’s after-hours drop to $595 places price back below the 78.6% Fib retracement level (~587) — a potential warning sign of a reversal or short-term weakness.
🔍 Fibonacci Levels (from ~644 to ~458 swing):
Level Price Status
23.6% ~518.2 Support (cleared)
38.2% ~536.4 Support
50.0% ~551.4 Support
61.8% ~566.1 Support
78.6% ~587.2 Currently being tested
100% ~644 Major resistance
🔺 Support Levels (Key Areas to Watch):
~587.2: 78.6% Fib + Bollinger Band middle (critical support now at risk).
~566–568: Fib 61.8% + horizontal consolidation support.
~551: Fib 50%, secondary support if breakdown continues.
Green uptrend line: Dynamic support — near convergence zone with ~587.
🔻 Resistance Levels:
~603–606: Immediate resistance (price rejected here intraday).
~615–620: Horizontal price shelf from Feb highs.
~644: Major swing high from earlier in 2025.
📈 Bollinger Bands (20, 2):
Price was hugging the upper band earlier today — sign of bullish momentum.
After-hours dip to $595 pushes price toward the 20-day SMA (~593) — possible mean reversion or early correction forming.
📉 Volume & Momentum:
Volume during the rally has been moderate to low, suggesting limited conviction.
No major volume spike despite the recent breakout attempt.
If selling volume increases tomorrow, it may confirm a short-term bearish reversal.
⚠️ Interpretation:
The after-hours dip to $595 is a yellow flag. It:
Falls below the breakout level of ~603.
Threatens the 78.6% Fib (which is a typical exhaustion zone in retracements).
May break below the sharp uptrend support line, triggering profit-taking.
Short-term bias: Shifting from bullish to neutral/bearish unless it reclaims 603 quickly on volume.
🧭 Next Key Watchpoints:
Bulls want to see:
A bounce from ~593–587 zone.
A reclaim of 603 with strong volume.
Bears want to see:
Breakdown below 587 with follow-through.
Confirmation below trendline and push toward 566.

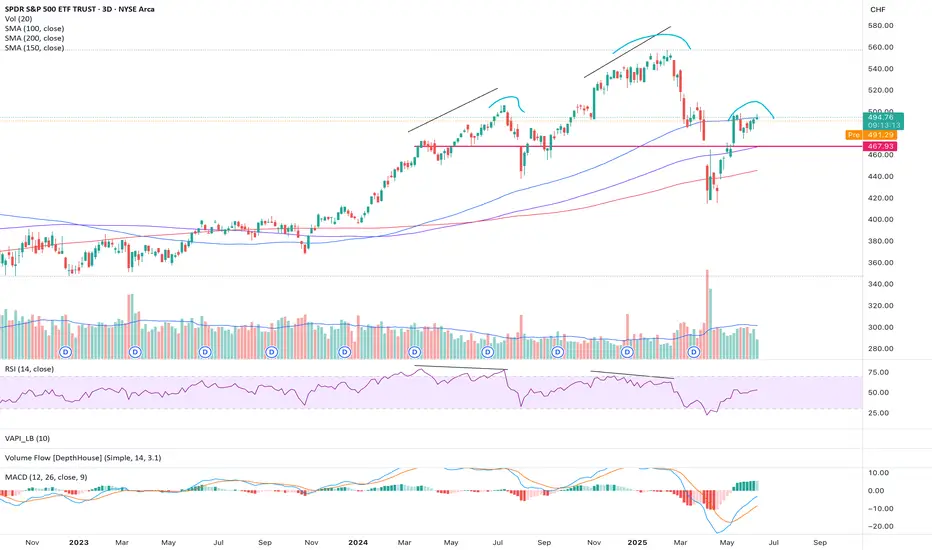
SP500 in CHF terms, bearish outlook- checking the SP500 in USD seems misleading these days
- therefore I checked it with CHF and earlier movements made more sense
- RSI bearish divergences were followed in earlier periods
- now we have a potential head and shoulders formation
- seems more likely to head south
Nightly $SPY / $SPX Scenarios for June 12, 2025🔮 Nightly AMEX:SPY / SP:SPX Scenarios for June 12, 2025 🔮
🌍 Market-Moving News 🌍
💱 Dollar Slides on Trade Truce Hopes & Fed Outlook
The U.S. dollar dropped 0.4%—its lowest level since April 22—after President Trump signaled flexibility on a July 8 trade deadline and U.S.–China talks showed renewed progress, boosting expectations for Fed rate cuts
📊 S&P Shiller CAPE Hints at Overvaluation Risk
Stocks and bonds rallied following rebound, but valuation metrics flash caution: the S&P 500 now sits in the 94th percentile of Shiller CAPE, and equity risk premium has dropped to zero. Analysts warn these levels often precede corrections
🛢️ Oil Holds at Seven-Week Highs
Oil prices remain near seven-week highs (~$66–67/barrel), supported by gradual OPEC+ output increases and hopes that easing trade tensions will aid demand
📈 CPI Cools Again, Bonds Climb
U.S. consumer inflation rose just 0.1% in May (2.4% YoY), easing expectations for tighter Fed policy. Consequently, Treasury yields softened and bond markets outperformed equities
📊 Key Data Releases 📊
📅 Thursday, June 12:
8:30 AM ET – Producer Price Index (May)
An early gauge of inflation at the wholesale level—may reinforce the cooling trend seen in CPI.
8:30 AM ET – Initial & Continuing Jobless Claims
Weekly updates on unemployment filings. Key to monitor for labor-market tightening or softening.
⚠️ Disclaimer:
This report is for educational and informational purposes only—it does not constitute financial advice. Always consult a licensed financial advisor before making investment decisions.
📌 #trading #stockmarket #economy #news #trendtao #charting #technicalanalysis

SPY SHORT FROM RESISTANCE|
✅SPY went up to retest
A horizontal resistance of 610$
Which is also an All-Time-High
So its a very strong level
Which makes me locally bearish biased
And I think that we will see a pullback
And a move down from the level
Towards the target below at 596.43$
SHORT🔥
✅Like and subscribe to never miss a new idea!✅
Disclosure: I am part of Trade Nation's Influencer program and receive a monthly fee for using their TradingView charts in my analysis.


607 EOD Non uclidean Mathematics Dual Band Fibbonaci📍 SPY is now accelerating through the 1.272–1.618 active band.
📍 607 is the next harmonic projection level on the mirrored Non-Euclidean spectrum.
📍 No rejection at Passive ⇒ continuation through Active ⇒ magnet to 607.