SPY PRINTS RARE 'BUY' SIGNAL FOR THE FIRST TIME SINCE MAR 2020!!On the 2 Day chart, AMEX:SPY is signaling its intent to print a buy signal on our CM Ultimate RSI Indicator as soon as tomorrow, for the first time since March 2020
In this video, we look at that exact signal & see what the past 11 years of price action says about what's the next move for AMEX:SPY
1557 trade ideas

uh owell we've so far passed all my support points and are like in super duper oversold territory. Traders want to bounce but I'm going to finally change my 6 month outlook. BEARISH. Short term it depends on how the chips fall -- if we get some straws to grasp at on the economic data side of things, we could bounce easily to $580.
But people are not liking the current field, even after all the panic selling, there aren't many management firms snatching up the deals. Except for NVDA, people really fell on that knife these past 2 days, hoping its profits remain magnificent and its costs don't increase. Maybe TSLA will be a buy soon -- Musk owns less than 50% of the company right? They can vote him out in June? I mean I was expecting a bounce and extra profits from the CEO being so close to the POTUS but maybe people are sensing he's too MIA, off playing video games or something.
Worst of all, the administration isn't even giving people platitudes. There's no, 'we're doing everything we can to prevent a full Biden recession'. There's almost a calm acceptance that it might happen and we'll be better off for it. At first it was just uncertainty around rate cuts but its blossomed into caution around CapEx and MA (because somehow the outlook on tariffs is even murkier now than in December) and dent in employment activity due to mass layoffs at the federal level. Like this year just cannot get any worse -- and any bullish reversals will be due to that sentiment; that we're impervious to further drops in the stock market because the bad news is already priced in. But we haven't accounted for all the people who will have to cash out of their 401k's this fall and therefore cannot discount the possibility of a 25% market correction or more. Like, I'll change my mind when the administration starts acting like recessions are bad and we should work our hardest to avoid them rather than just making sure Biden gets some of the blame (no way Trump escapes all the blame anymore, he'll be lucky if he can avoid a government shutdown Friday).
Like usually treasuries move inverse to stock market action, but what if the pause in business activity is because of unpredictability at the federal government? How long before we float the idea of reneging on our debts and we get downgraded to a B+? Like we talk about protectionist policies and fiscal conservativism; what could be more of an America first policy than just defaulting on our owed debt? I just hope we can default in tranches so that not all $36 trillion becomes worthless all at once. Maybe the Fed can look into that -- stop selling short term notes for example and commit to honoring our immediate debts...

SPY - L3 Bullish Daily Exhaustion SignalAMEX:SPY first level 3 bullish exhaustion signal on the daily since Jan 2016, when in marked the exact bottom. The other 3 times it happened in the past 30 years were during the 2000-2003 dot com bust.
Within 10 candles after the signal:
75% win rate
+3.5% average move
4 data points over 30 years

Reverse Head and Shoulder in the 30 minWith a 1 day RSI of 31 and a reverse head and shoulder forming, this market technically wants to go higher.
The question is what will "you know who" say tomorrow?
I'm calling a dead cat bounce, that gives us an opportunity to buy some April puts.


Where were these, "the world is about to end" folks during 2022?I've seen waaaaaaay to many posts recently on multiple sites/apps regarding the stock market and how it's crashing under Trump... I dreaded politics when I was younger because it was always so divisive and more importantly, in my eyes, neither party was transparent. As I've gotten older, my feelings aren't as bad regarding politics as a whole but my feelings, towards each party in regards to the divisiveness they create and carry on has gotten worse. These feelings sometimes carry over to my network of friends, family, and community because a lot of times differences of opinion or feelings toward a political party or person also create a divide.
The main reason for this post is to point out a few reasons why people shouldn't have your panties all in a bunch regarding Trump... I included a screenshot of the stock price action for AMEX:SPY in 2022. As you can see, there were 4 different occasions, from Jan to Oct, where the market dropped double digit percentage points. Let's recap...
1/4/22 to 2/24/22, in 51 trading days the price dropped over 14%
3/29/22 to 5/20/22, in 52 trading days the price dropped over 17%
6/2/22 to 6/16/22, in 14 trading days the price dropped almost 13%
8/16/22 to 10/13/22, in 58 trading days the price dropped 19%
With that being said, from Jan to Oct of 2022, the market tumbled almost 27%. I don't recall seeing as many frantic posts, news commentators dragging and blaming the president everyday, or the POTUS supporters or non-supporters of the democratic party pointing fingers as much as I have recently.
I say this with all due respect to everybody and their individual opinion towards a party or person... I have never nor will I, ever attach my beliefs or moral compass to any specific political party or person so much that I need to block a friend (maybe not a friend to begin with), family member, or anyone else just because they disagree with me. I always loved diversity and it seems to be have become a distant memory to some just because of a difference in opinions. Obviously, this is a conversation that can go on for awhile but I just wanted to get that off my chest while also reminding some to reserve their panicking of a stock market crash or that the world is about to end because of the price of eggs or talks of changes in tariffs.
Again, just take a look back at the market in the year 2022 and remind yourself... the market has always had corrections throughout it's history and every time, it has rebounded and continued to evolve.

$SPY - Trading Levels for March 12 2025
30min 35EMA attack right at open. That level is a BEAST!!! It needs to be on your chart. 566/568 Bear call spreads if we pop up, order in at .90

SPY - support & resistant areas for today March 12, 2025The key support and resistance levels for SPY today are above.
Follow me to get this notified when I publish in the morning.
Understanding key levels in trading can provide valuable insights into potential market movements. These levels often indicate where prices might reverse or consolidate, serving as important signals for traders considering long (buy) or short (sell) positions.
Calculated using complex mathematical models, these levels are tailored for today's trading session and may evolve as market conditions change.
If you find this information beneficial and would like to receive these insights every morning at 9:30 AM, I invite you to support me by boosting this post and following me @OnePunchMan91. Your engagement is greatly valued! However, please note that if this post doesn’t receive more than 10 boosts, I will have to reconsider providing these daily updates. Thank you for your support!
Need any other charts daily, comment on this.

SPY daily chart for March 12, 2025Hey traders! Checking out the SPY daily chart for March 12, 2025, and it’s looking like a critical moment. We’re sitting in a reversal zone ($556-$562), with the downtrend still in play via that sloping trend line (~$560-$565). MACD’s bearish, but the histogram is flattening, and Stochastic RSI is oversold—hinting at a possible bounce. Key levels: support at $556 (break below targets $540-$545), resistance at $562, $571.36, and $577.05, with $606-$607 as the big hurdle.
My plan: Long if $556 holds with a strong bullish candle, stop below $554, targeting $562 then $571. Short if we break $556 with volume, stop above $558, aiming for $545. Risk-reward 1:2, and I’ll watch volume closely—low moves can fake you out. News today could shake things up, so I’m staying flexible. What do you think—bullish bounce or more downside? Let’s discuss!
* Key Levels:
* Green resistance: ~$606-$607
* Red support/resistance zones: ~$562, $571.36, $577.05
* Current reversal zone: ~$556-$562
* Downward-sloping trend line intersecting around $560-$565
* Current Price: Appears to be in the $556-$562 range, near the lower end of the reversal zone.
* Indicators: MACD shows a bearish crossover with declining momentum, while Stochastic RSI is oversold (below 20), hinting at a potential bounce.
Technical Analysis
The SPY chart reflects a clear short-term downtrend, marked by the downward-sloping trend line and a series of lower highs and lower lows. The price has recently entered a reversal zone ($556-$562), which could serve as a support area. The MACD’s bearish crossover suggests continued selling pressure, but the widening histogram is starting to flatten, indicating a possible slowdown. The Stochastic RSI being oversold is a strong signal that a bounce or consolidation might be on the horizon, though it’s not a guaranteed reversal without price confirmation.
Key levels to watch include:
* Support: $556 is the critical level. A break below could push toward $540-$545.
* Resistance: $562 (top of the reversal zone), $571.36, and $577.05, with the trend line acting as dynamic resistance around $560-$565.
* Major Resistance: $606-$607, where prior resistance held firm.
Potential Scenarios
* Bullish Case: If SPY holds $556 with a strong bullish candle (e.g., hammer or engulfing pattern) and the Stochastic RSI begins to rise, we could see a move to $562 or even $571.36. Volume confirmation would be key.
* Bearish Case: A decisive break below $556 with high volume could accelerate the downtrend, targeting $540-$545. Watch for MACD to reinforce bearish momentum.
* Consolidation: The price might range between $556 and $562 if momentum remains indecisive, especially given the oversold conditions.
Game Plan for Today’s Trading Session
* Entry Points:
* Long: Enter long if the price respects $556 with a bullish reversal signal (e.g., a strong green candle). Set a stop-loss below $554. Target $562 initially, then $571.36 if momentum builds.
* Short: Enter short if the price breaks below $556 with confirmation (e.g., high volume, bearish MACD). Set a stop-loss above $558. Target $545, with a stretch to $540.
* Risk Management:
* Aim for a 1:2 risk-reward ratio. Risk $2 to make $4 per trade.
* Monitor volume—low volume moves are less reliable.
* Be cautious of macroeconomic news (e.g., FOMC updates or inflation data) that could sway the market today.
* Execution Tips:
* For day trading, consider a 1-hour or 15-minute chart to fine-tune entries.
* Watch the trend line rejection around $560-$565 for bearish confirmation or a potential bounce.
My Thoughts and Suggestions
I’m keeping a close eye on this reversal zone ($556-$562) as it feels like a make-or-break point. The oversold Stochastic RSI gives me hope for a bounce, but the downtrend isn’t done until we see a clear reversal signal. I’d lean toward a cautious long if $556 holds, but I won’t chase it without volume backing it up. On the flip side, a break below $556 could signal more pain, so I’ll be ready to short with tight stops. Today’s market moves might hinge on news, so staying flexible is key. Let’s see how it plays out—any thoughts from you all?

SPY/QQQ Plan Your Trade for 3-12-25 : Rally111 PatternToday's Rally pattern in Carryover mode may prompt a powerful base/bottom move in the SPY/QQQ.
In today's video, I explain in great detail how I read these charts and why the Excess Phase Peak (EPP) patterns are so important.
We are moving into the Consolidation Phase of the EPP patterns for the SPY/QQQ.
We are already into the Consolidation Phase of an EPP pattern for Bitcoin
Gold and Silver are a bit mixed. Yet Silver has already broken above the upper EPP Peak, rallying into a new EPP Peak level. Meanwhile, Gold is still struggling to find momentum for a bullish breakout.
While I don't believe the US markets are poised for a big downward price move, today's video shows you what may be likely 4 to 12+ months into the future.
So, pay attention to today's video. It clearly illustrates how to use the EPP patterns with Fibonacci and shows you what I believe could happen over the next 6 to 12+ months.
If the SPY/I continues to try to rally higher today, it will be interesting. This means we have potentially found our consolidation base and are now moving into a very volatile sideways consolidation phase.
Get some.
#trading #research #investing #tradingalgos #tradingsignals #cycles #fibonacci #elliotwave #modelingsystems #stocks #bitcoin #btcusd #cryptos #spy #gold #nq #investing #trading #spytrading #spymarket #tradingmarket #stockmarket #silver

Time for EWJ outperformanceI do think the best way to play the US underperformance story is through Japanese equities. Europe has moved too fast in a short time frame, China seems to me like a short term story whereas Japan seems to be the best way to play it.
Corporate earnings growth has been present in Japan post GFC unlike China and Europe to a lower extent.
Japanese valuations are great and the economic story is starting to be interesting.
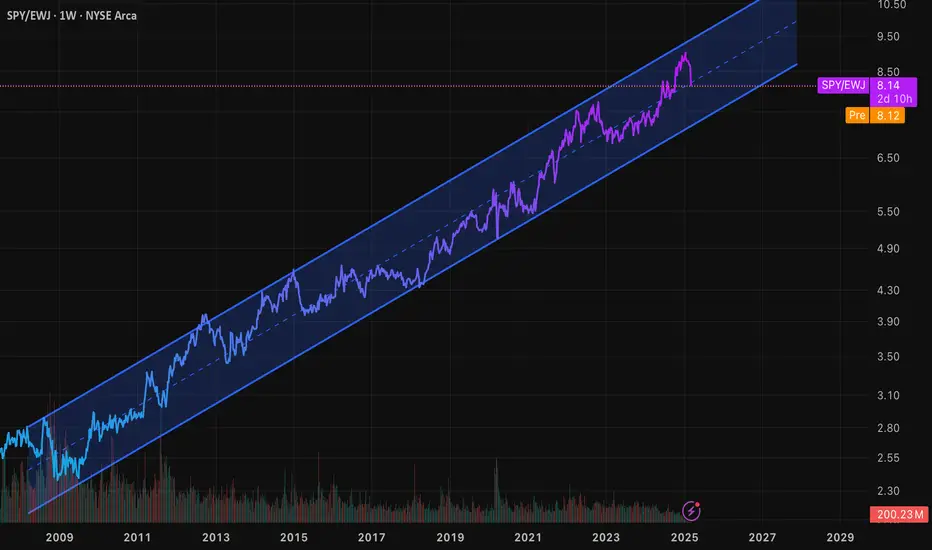
S&P underperformance against global marketsIn addition to previous post on spy/efa we can see the spy/urth actually testing the historic support and breaking down. The valuation differential + The destruction of US competitiveness as a result of tariffs would be tailwinds for the continued outperformance of row equities over the US

Multi decade asset allocation shift in the process?Rest of world equities (in particular europe) had been underperforming the US for essentially the post GFC era. It seems we are close to getting a test of the support for this decade+ trend. If we get a clear breakdown it might mean its time to bet on equities outside the US.
A few months ago we have gotten a gold breakout against the S&P which seems to me to be the start of a multi year trend.
If rest of world equities outperform that should mean that value would outperform growth. There is value in the US market in particular in the Energy, Healthcare and Small cap financials.

SPY S&P 500 etf Oversold on the RSI ! 2025 Price Target ! The SPDR S&P 500 ETF Trust (SPY) is flashing a major buy signal, with its Relative Strength Index (RSI) currently sitting at 28.33 — firmly in oversold territory. Historically, every time SPY has entered oversold levels on the RSI, institutional buyers have stepped in aggressively, driving sharp rebounds in the following weeks and months.
The last time SPY dipped below the 30 RSI threshold was during market pullbacks in 2022 and 2023 — both of which were followed by significant rallies as institutions capitalized on discounted valuations. The current setup is no different. With earnings growth stabilizing, inflation cooling, and the Federal Reserve signaling a potential shift toward rate cuts in the second half of the year, the backdrop for a recovery is aligning perfectly.
Technically, SPY is also approaching key support levels that have held strong in past market corrections. The combination of an oversold RSI and strong institutional appetite at these levels creates a compelling case for a bounce.
My price target for SPY by year-end is $640, representing over 15% upside from current levels. With sentiment stretched to the downside and technical indicators flashing green, SPY looks primed for a sharp and sustained rebound. Now could be the perfect time to position for the next leg higher.

Nightly $SPY / $SPX Scenarios for March 12, 2025 🔮 🔮
🌍 Market-Moving News 🌍:
🇺🇦🇷🇺 Ceasefire Proposal in Ukraine 🇺🇦🇷🇺: Ukraine has expressed willingness to accept a month-long ceasefire proposal, leading to a surge in the euro to five-month highs. This development has introduced volatility in European and U.S. equity markets, influenced by ongoing U.S. tariff plans.
🇺🇸🇨🇦 U.S. Tariff Increases on Canadian Imports 🇺🇸🇨🇦: President Trump has threatened to double tariffs on Canadian steel and aluminum imports to 50%, escalating trade tensions and contributing to a deepening stock market sell-off. This move has raised concerns about inflation and economic growth, affecting investor confidence.
📊 Key Data Releases 📊:
📅 Wednesday, March 12:
📈 Consumer Price Index (CPI) (8:30 AM ET) 📈:The CPI measures the average change over time in prices paid by urban consumers for a basket of goods and services, serving as a key indicator of inflation.
Forecast: +0.2% month-over-month
Previous: +0.3% month-over-month
⚠️ Disclaimer: This information is for educational and informational purposes only and should not be construed as financial advice. Always consult with a professional financial advisor before making investment decisions.⚠️
📌 #trading #stockmarket #economy #news #trendtao #charting #technicalanalysis

SPY...for those why spy, let's eye n find some levelsUsing a still in progress gap detector tool and the classic CyQo-B0wStr1ng method, we arrive at some interesting levels.
As always, use the Log function on the bottom of the scale and see what's on another level for levels...yeah
remember to just credit CyQoTek if it interests you or yah pass it on- more attention so more people make money is important. I don't sell things cause im not a shill or grifter.
"If someone tells you they will charge you for a service you don't want to do or can't do and they know what they are doing and all goes well, great, benefit all around. When someone tells you you need to pay them for something cause they want to help spread their findings and make everyone successful...it is called a con or ploy. Your parents ever charge you to teach you to eat; your grandfather ever need a subscription to teach you to fish: When someone can make money...good money...trading, and needs to sell something or wants you to be part of the "Sub-Club", run...don't walk away." Top 3 Hedgefund founder speaking over a private dinner I got to attend.
He followed with a simple statement:
- When you starve your kingdom, you eat well until the last peasant falls. But if you give your kingdom gold and serve fair justice, your grandkids will still be ruling as if no one realizes there is a monarchy...just an all knowing person who gives to all if everyone gives it their all.
anywho....enjoy:
4hr gap fill far:
4 hr gap fll view close:
4hr gap fill n fib channel:

Have we finally broke the down trend?!Prices looks to have broke the down trend from late February and seems to be coming back to test the low prior to breaking that line ($555.56) and will hopefully that has happened, bounce to fill the gap ($574.44)… have the bulls finally stepped back into the market? 👍 or 👎?

Possible Inverse Head and Shoulder Pattern?!?I originally thought this may be a triple top or triple bottom but there may be an inverse head and shoulder pattern forming. We will not know for sure until the next shoulder possibly forms which would be around the end of April, 2025.
A typical inverse head and shoulders pattern is a trend reversal pattern that signals a potential reversal in a downtrend.The SPY is currently NOT in a downward trend but this may still be an inverse head and shoulder pattern. We will have to keep a close watch on the market in the next month.
Regardless, the SPY should go upward tomorrow and for the next week as the indicators are changing to a bullish signal, including the hourly, 2 hour, etc up to and including the 6 hour indicators. The daily indicators should start changing shortly.
The targets I have in place are:
35 point move: 600. This is based on a conservative move of the last upward movement from Jan 13 to Jan 24th.
1 fib move: 613.37
7 day move: Mar 19. This is based on the last upward move from Jan 13 to Jan 24th.
If it hits one of these targets, I am out of my trade.
My stops are:
1) the low of the previous Heikin Ashi candlestick,
2) 2 red Heikin Ashi candlesticks,
3) a specific dollar amount for a total loss for my trade or
4) a specific dollar amount per contract.
If it hits one of those stops, I am out of my trade.
I am using the Heikin Ashi candlesticks.
1) They show more of a directional movement within candlesticks.
2) They tend to filter out the market noise so you can see the market direction better.
3) It reduces false signals, allowing you to stay in the trade longer.
4) And, it gives you a smoother appearance making it easier to see trends and reversals. (This information is from Dr. Keith Wade who speaks at the Wealth365 Summits. The next summit is in April.)
I personally find:
* the 5 minute indicators typically represents what will happen in the next half and hour.
* the 10 minute indicators typically represents what will happen in the next hour.
* the 30 minute indicators typically represents what will happen in the daily.
* and, the hour indicators typically represents what will happen in the next week.
Typically, I would wait until there are 2 green daily Heikin Ashi green candlesticks before entering.
I use the MacD, the Stock RSI and the DMI to assist me with the direction of the market. I am not perfect at them.
I am trying to take trading classes through Udemy, mostly because they are cheap. LOL! I usually wait for a sale where the courses are as low as $14.99 instead of over $100 per course which they have regularly. As well, you may be able to get access to Udemy through your local library depending on where you live. www.udemy.com
I always try to attend the free Wealth365 Summit which is held about 4 times a year where I always pick up some more useful information. The next one will be around April. Again, I am not affiliated with this company in any way. www.wealth365.com
Happy trading everyone!

Bullish Butterfly Pattern Formation Triggers Reversal On $SPYAround 1:30PM on 03/11/25 the AMEX:SPY formed a bullish butterfly harmonic pattern on the 4H chart, leading to a massive rally above its nearest confluent price reversal zone (PRZ). Meanwhile, the TVC:VIX which has pushed well beyond its latest bearish harmonic pattern, has finally broken below it's nearest confluent PRZ with no more potential bearish patterns left in the upside while also forming a potential bullish pattern to the downside. While AMEX:SPY has formed several bullish harmonics in the 4H during the selloff in the past two weeks, which have resulted in near term rallies, will this time be different now that the TVC:VIX has finally taken out all of its upside targets? Tomorrows economic data can be the catalyst to create continuation to the upside with a near term target of $588.

SPY target levelsI sold out of US stock funds when we dropped through the major channel. These are the support levels where I'm looking to see if we get a bounce or return to a more bullish trend.

The pivot circa: SPY $551.50 WAS FREE - NO STRINGS ATTACHED - MARKET = SUPER OVERSOLD
PRIMED FOR A MASSIVE SHORT SQUEEZE
THE TRIGGER? LIQUIDITY FROM TARIFFS - THAT IS NEXT
TRUMP PLANNED IT. AND HERE IT WILL COME
On the technical side - yes, everyone sees this as voodoo magic - but it is a property of dynamic systems. What do you mean? Ahhhhh, measure and measure well from the previous move... it is a secret!!!
Don't underestimate the smartest president we have ever had...
It takes finance-trained people to forecast properly...
Wharton is a great school (Trump) - hehehe, not the school of hard knocks (or maybe rocks).
The move fits, time range, volume and positioning. Be observant ... we need you wealthy.
Some clues just because I am nice:
"Moniac Model of the economy - it is in new Zealand. that will help you visualize. The guy was Phillips".
They are all short - when you buy now you buy IOUs
What does it mean? hahaha, well a line of buyers that must buy .....
Save this post - and reference it later.
The pivot circa: SPY $551.50
Now, this is a nice post, what do you say?
Remember this post was made 31 minutes ago, that was 1.09 PM on Tuesday March 11, 2025
The concept of the Random Walk is a fallacy promoted by water cooler talkers - and you know there are so many of these troglodytes.
This one is the biggest water cooler talker of all times (my opinion). I call this practice bullshiting
Richard D. Wolff
A prominent contemporary Marxian economist, Wolff is known for his critique of capitalism and advocacy for worker cooperatives. He is the founder of Democracy at Work and author of Understanding Socialism
One more edition to this post:
The relationship between liquidity, interest rates, and tariffs.
I wanted you to visualize the Moniac (representation of the economy developed by Phillips the famed economist, that uses water to represent capital flows, you should really learn this model it will help you tremendously in the future).
Thinks of rates ruled by liquidity, The FED sells T Bills to get cash, it promised to pay interest and return the money latter. Well the Tariffs come in to banks galore, and then the FED has excess liquidity and has to sell less T-Bills so the Fed lowers the rate it will pay and that is that, so simple, and so COMMON SENSE, and yet, the crowd can't conceptualize it. No matter, the Tariffs will have this effect and rates likely will be required to come down. See now how tariffs are much better than income tax revenue, and all other taxes in reality?
According to my estimations, if we go to a tariffs based tax revenue collection, the economy in the USA stands to gain 4% points just because of this switch.
Wink wink, get smarter ....

S&P 500 is gearing up for a drop to $348.11 or even $218.26.SP:SPX AMEX:SPY are gearing up for a potential crash. Markets and indices seem aligned for a downturn.
What will trigger it?
Hard to say, but watching the stock and crypto markets, it certainly looks that way.
My expectations for SPX / SPY:
➖ Fibonacci 161.80% targets have been reached.
➖ Key downside levels: $348.11 and $218.26.
TVC:DXY
The dollar index is leaning towards growth for now. I think it might follow this scenario. Let’s keep an eye on how things develop.

SPY - support & resistant areas for today March 11, 2025The key support and resistance levels for SPY today are above.
Follow me to get this notified when I publish in the morning.
Understanding key levels in trading can provide valuable insights into potential market movements. These levels often indicate where prices might reverse or consolidate, serving as important signals for traders considering long (buy) or short (sell) positions.
Calculated using complex mathematical models, these levels are tailored for today's trading session and may evolve as market conditions change.
If you find this information beneficial and would like to receive these insights every morning at 9:30 AM, I invite you to support me by boosting this post and following me @OnePunchMan91. Your engagement is greatly valued! However, please note that if this post doesn’t receive more than 10 boosts, I will have to reconsider providing these daily updates. Thank you for your support!
Need any other charts daily, comment on this.
