1557 trade ideas


Swing Trading OutlookThe Bulls are still in control but showing some weakness based on Friday's Doji. We are still above the 9SMA, so will continue to look for some short-term swing trades. Meanwhile keep an eye on the possible negative divergences forming. Cheers!

Weekly $SPY / $SPX Scenarios for June 9–13, 2025 🔮 Weekly AMEX:SPY / SP:SPX Scenarios for June 9–13, 2025 🔮
🌍 Market-Moving News 🌍
📱 Apple WWDC & Tech Momentum
Apple’s annual Worldwide Developers Conference kicks off Monday with CEO Tim Cook set to discuss new products, services, and likely AI initiatives—tracks should watch include impacts on NASDAQ:AAPL and AI-related stocks
🧨 GameStop Eyed for Crypto Pivot
GameStop (a meme-stock darling) reports earnings Tuesday. Markets are watching for updates on its $500M bitcoin investment and potential pivot toward crypto-driven revenue streams
🇨🇳 U.S.–China Trade Talks in London
High-level trade dialogue begins Monday between U.S. and Chinese representatives in London, offering possible relief to trade tensions and providing a lift to risk assets
📉 Key Inflation Data Midweek
Wednesday brings the May CPI release—crucial for assessing tariff-driven inflation trends and likely to influence Fed policy outlook ahead of next month’s meeting
💹 Oil Markets React to Trade Uncertainty
Oil prices are stable to slightly up ahead of trade talks, as Brent holds around $66/barrel—reflecting balanced supply concerns and hopes for easing global tensions
🌐 G7 Summit and Global Policy Risks
G7 finance ministers convene in Canada (50th anniversary), tackling trade strains, Russia–Ukraine, and inflation. Global macrospoilers could trigger renewed volatility
📊 Key Data Releases & Events 📊
📅 Monday, June 9
Apple WWDC begins (CEO keynote)
U.S.–China trade talks start in London
📅 Tuesday, June 10
GameStop Q2 earnings (+ bitcoin update)
NFIB Small Business Index (6:00 AM ET)
📅 Wednesday, June 11
8:30 AM ET – Consumer Price Index (May)
Watch for inflation signal from tariffs.
8:30 AM ET – Core CPI (May)
Core inflation trend under scrutiny.
📅 Thursday, June 12
8:30 AM ET – Producer Price Index (May)
Early check on wholesale inflation
8:30 AM ET – Initial & Continuing Jobless Claims
📅 Friday, June 13
10:00 AM ET – University of Michigan Consumer Sentiment (June, preliminary)
Consumer mood and tariff impact insights
⚠️ Disclaimer:
This is for informational/educational purposes only. Not financial advice. See a licensed advisor before making investing decisions.
📌 #trading #stockmarket #economy #news #trendtao #charting #technicalanalysis

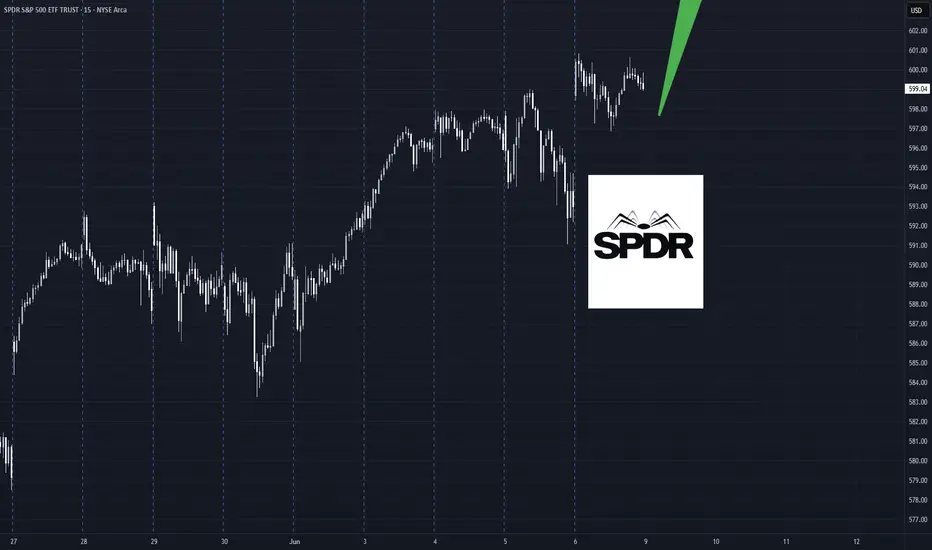
SPY (S&P500 ETF) - Price Attempting Breakout Above ResistanceSPY (S&P500 ETF) price is attempting to breakout above Daily resistance levels of $594 and $597.
SPY ETF has been in an uptrend since May 2025. A Golden Cross also occured on May 19th 2025, signaling that a potential longer term bullish rally could occur.
Friday's candle closed as a Doji signaling some potential indecision after recent price volatility.
SPY price is not at any extreme level on the Daily chart.
If SPY price ever gaps up and rallies up to the $612 to $620 resistance zone, price could sell off stronger (short-term).
In June 2025, trade deal and inflation news will most likely be the catalyst for further volatility, in addition to government news announcements.


SPY Double Rising WedgeWatch the trendlines of both rising wedges and plan your trades accordingly. I will post the Monday Key trading levels in the next post

SPY CHANNEL JUNSPY ( AMEX:SPY ) – Multi-Timeframe Volatility Channel Analysis
SPY remains inside a well-defined ascending volatility channel across all key timeframes (2h, 4h, Daily, Weekly), confirming a strong bullish structure with clear institutional control.
🔸 Short-Term (2h – 4h):
Consolidating between 590 and 605, with recent rejection from upper bounds.
Multiple PUT positions triggered near 599 and 603, suggesting institutional hedging.
Key support: 590. Below that, watch for downside toward 586 or 576.
🔸 Mid-Term (Daily):
Bullish channel still intact.
As long as price holds above EMA20 at 585.77, the trend remains bullish.
Breakout above 608 opens targets toward 611 (gap) and then 617–620.
🔸 Long-Term (Weekly):
Weekly channel projects targets up to 635 if structure holds.
Strong institutional resistance zone between 607 and 611.

SnP forming right shoulderSupported by bullish indicators such as the Zweig Breadth Thrust and if May closes green, it means 1 year from now the market will have double digit returns every single time.

SPY Swing Trade Plan – 2025-06-06📈 SPY Swing Trade Plan – 2025-06-06
Bias: Moderately Bullish
Timeframe: 3–4 weeks
Catalysts: Strong institutional flows, trade talk optimism, solid jobs report
Trade Type: Long equity position
🧠 Model Summary Table
Model Bias Entry Stop Loss Take Profit Holding Period Confidence
DS Moderately Bullish $600.02 $595.54 $618.02 3 weeks 65%
LM Moderately Bullish $598.50 $586.70 $616–618 3–4 weeks 75%
GK Strongly Bullish $600.02 $592.00 $610.00 4 weeks 72%
GM Moderately Bullish ~$600.50 $587.50 $627.50 3–4 weeks 70%
CD Moderately Bullish $600–600.50 $585.00 $620 / $635 3–4 weeks 72%
✅ Consensus: SPY is in a bullish trend across timeframes
⚠️ Disagreements: MACD momentum and entry/pullback levels
🔍 Technical & Sentiment Summary
Trend: SPY above 10/50/200 EMAs on all models
RSI: 60–61 → bullish but not overbought
MACD: Mostly positive, DS cautious on daily histogram
Support Levels: $591.06, $595.54, $597.26
Resistance Zones: $600.83, $605.21, $610
VIX: 17.6 (declining), supports risk-on sentiment
News: Trade talk optimism and strong jobs data fueling momentum
✅ Final Trade Setup
Parameter Value
Instrument SPY
Strategy LONG
Entry Price $600.00
Stop Loss $588.00
Take Profit $625.00
Position Size 83 shares (1% risk on $100K)
Entry Timing At market open
Confidence 70%
💡 Rationale: Aligned bullish signals across timeframes, falling VIX, and strong macro sentiment favor a trend continuation move toward $625. Position sized for conservative risk management.
⚠️ Key Risks & Considerations
MACD divergence could signal near-term stall
Resistance zone at $605 may act as a cap
Macro volatility: Strong jobs could raise rate expectations
VIX Watch: A spike above 20 could reverse market trend
Exit Protocol: Consider closing if SPY closes below the 10-day EMA (~$591)
📊 TRADE DETAILS SNAPSHOT
🎯 Instrument: SPY
📈 Direction: LONG
💰 Entry Price: 600.0
🛑 Stop Loss: 588.0
🎯 Take Profit: 625.0
📊 Size: 83 shares
💪 Confidence: 70%
⏰ Entry Timing: Open
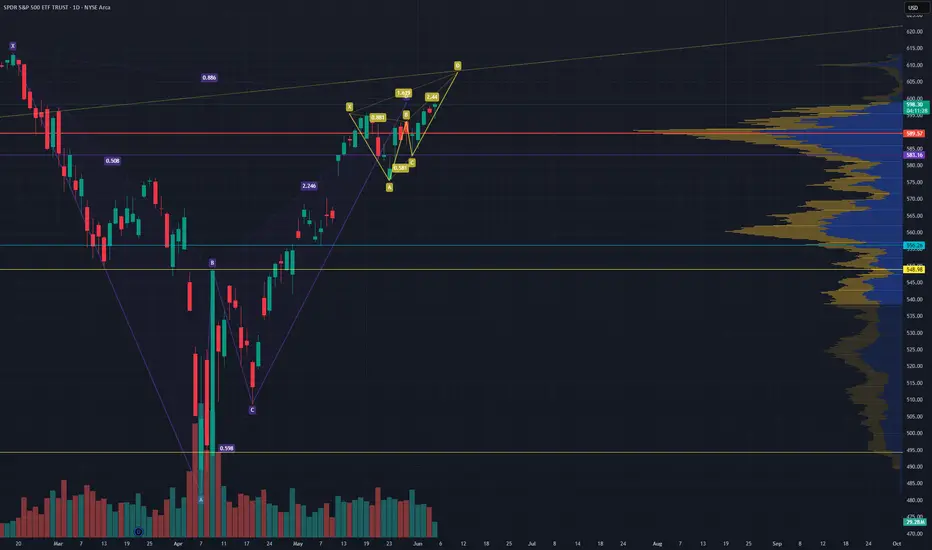
SPY Macro Analysis: Premium-Discount Dynamics, Trade Setup etc..Macro Perspective:
The SPDR S&P 500 ETF Trust (SPY) is currently consolidating in a critical premium zone, with a tug-of-war between buyers and sellers. Economic uncertainty and broader market sentiment suggest a cautious approach, particularly with upcoming economic events (e.g., Fed policy updates, inflation data). The equilibrium level (~599) appears to be pivotal for directional bias.
Technical Breakdown
Premium Zone (599.80–606.19):
Price is testing key resistance levels near Fibonacci 0.886 and 2.618 extensions. A failure here could signal a bearish reversal.
A sustained breakout beyond 606.19 would open doors to higher targets (612–617.50).
Discount Zone (585–577):
A retracement into this zone could attract buyers looking for value entries.
Key support: 565.51 (swing low, potential liquidity grab).
Volume Dynamics:
Noticeable spikes at resistance levels, suggesting potential liquidity sweeps before a decisive move.
Trade Setup
Scenario 1: Bullish Continuation
Entry: Upon breakout and close above 606.19.
Stop-Loss: Below 604 (to avoid fakeouts).
Targets: 612 (initial), 617.50 (extended).
Risk-Reward: Maintain at least 1:3.
Scenario 2: Bearish Reversal
Entry: Upon rejection from the premium zone (~599–606).
Stop-Loss: Above 607.
Targets: 585 (initial), 577 (secondary).
Risk-Reward: At least 1:4.
Scenario 3: Discount Rebound
Entry: Bullish price action confirmation within the 585–577 range (e.g., engulfing candle, double bottom).
Stop-Loss: Below 575.
Targets: 599 (initial), 606.19 (secondary).
Risk-Reward: Adjust based on entry levels.
Risk Management
Position Sizing: Use no more than 2% of your account per trade.
Confirmation: Wait for clear price action signals or key volume levels to confirm entries.
Trailing Stop: Consider trailing stops to lock in profits during trending moves.
Macro Insights
Keep an eye on macroeconomic drivers like inflation data, job reports, and Federal Reserve commentary.
Correlation with bond yields and volatility (e.g., VIX) could provide additional cues for market sentiment.
💡 Pro Tip: Patience pays—let the price come to you. Always stick to your plan and maintain discipline in both entries and exits.

Big BAT Little Deep Crab on SPY WTF is going on with the marketI don't know what to make of this market but the BAT completed and what looked like a cup and handle is starting to look like a BAT and a deep crab. The deep Crab finishes right around a trendline I have that goes way back.
Publishing for tracking purposes
#SPY
Nightly $SPY / $SPX Scenarios for June 5, 2025🔮 Nightly AMEX:SPY / SP:SPX Scenarios for June 5, 2025 🔮
🌍 Market-Moving News 🌍
🇺🇸 JOLTS Job Openings Surprise to Upside
U.S. job openings unexpectedly rose to 7.39 million in April—well above forecasts—indicating that labor demand remains robust despite macro headwinds and trade-policy uncertainty
🛢️ OPEC+ Greenlights July Supply Increase
OPEC+ agreed to boost production by 411 K barrels per day starting in July, adding downward pressure to oil prices and weighing on energy equities
📈 Fed’s John Williams Signals Patience
New York Fed President John Williams reiterated that the Fed sees no urgency to cut rates, citing mixed inflation signals and a balanced labor market—keeping investors cautious on rate-cut timing
📊 Key Data Releases 📊
📅 Thursday, June 5:
8:30 AM ET – JOLTS Job Openings (April)
Measures total U.S. job vacancies, a leading indicator of labor-market strength.
10:00 AM ET – OPEC+ Press Conference (Post-Meeting)
Details on production quotas for July, guiding energy market supply expectations.
⚠️ Disclaimer:
This information is for educational and informational purposes only and should not be construed as financial advice. Always consult a licensed financial advisor before making investment decisions.
📌 #trading #stockmarket #economy #news #trendtao #charting #technicalanalysis

SPY Inverse Head & Shoulders Played Out Clean – Bounce from Buy Just wanted to follow up on the AMEX:SPY idea I published yesterday — this played out exactly as expected 👇🏾
We got that clean pullback right into the 588.50–589.90 buy zone, which aligned perfectly with high-volume support. From there, price reversed and gave us that upside move back toward 593+.
Even more validating: the pattern that formed was a textbook inverse head and shoulders
🔹 Left Shoulder → formed near 586
🔹 Head → at the deeper 585 level
🔹 Right Shoulder → bounced cleanly off the buy zone
🔹 Neckline Break → confirmed the move above 591.12
This is why I always say: have your levels ready and wait for confirmation. No chasing, just execution.
🔑 Buy zone held
📊 Volume-backed support
📈 Continuation in progress
Will continue monitoring for follow-through above 593.46. If bulls hold control, next resistance is near 596–597.

$SPY WILL 100% Hit ATH By End Of July! SPY is loaded up for a breakout run. All-time highs isn't even a question, but when is — and my bet is before July ends , honestly before end of June. In this idea, I go over key support levels, resistance zones, and the momentum shifts pointing toward a bullish continuation.

$SPY market COULD trend till nov25' (confirmation this month)I like to write today,
I see AMEX:SPY at a critical point right now, Im ultra long stocks and hedged today with a short AMEX:SPY ,
because:
We reached the target of a quarterly trend and didnt go higher for a long time.
We have a strange political situation which news affect the markets (more than usually) (positive and negative).
Were coiling at the top again after an insane rally from the lows.
But there are reasons to be bullish:
If we stay up this month we can form another longterm signal (6 month) until end of october and see an insane continuation rally. Target would be about 720 in AMEX:SPY and I guess its above all targets from US Banks for S&P.
Lets see whats coming and play it safe and with some calculated risks, its not safe out there but there are many oppurtunities.
1 step better every day, every week, every month and every year - my wish for you.

SPY/QQQ Plan Your Trade For 6-3 : BreakAway In Trend ModeToday's pattern suggests the SPY/QQQ will attempt to move into a Breakaway type of pattern. I believe that Breakaway may be to the downside, but I could be wrong.
Price has been struggling in a sideways consolidated range over the past 2+ weeks. I believe this range sets up an "Island" type of price formation that is indicative of a topping type of pattern.
Currently, I'm tracking layers of different TA techniques to try to see how price may react in the future. Right now, price appears to be trapped within a range, has recently broken below the STDDEV channel, and may be moving into a very volatile FAILURE/REJECTION phase.
This is where price may attempt to resume trending (up or down) and I believe the move logical move is to the downside at this point.
Gold/Silver had a HUGE MOVE yesterday and are not contracting a bit. I still believe Metals will rally higher and attempt to break to new ATH levels.
BTCUSD is trapped in a sideways price range after reaching new ATH levels recently. Many of you are aware I'm expecting a rollover-top pattern to setup in BTCUSD (and the US markets) and I believe it is just a matter of time to see how the markets react to policies, news, and economic function/data.
Should be an interesting (possibly sideways) day today.
Get some.
#trading #research #investing #tradingalgos #tradingsignals #cycles #fibonacci #elliotwave #modelingsystems #stocks #bitcoin #btcusd #cryptos #spy #gold #nq #investing #trading #spytrading #spymarket #tradingmarket #stockmarket #silver

SPY (S&P500 ETF) - Price Testing Resistance Trendline - DailySPY (S&P500 ETF) price is currently testing a resistance trendline above ($593 to $595 price levels).
SPY price in the medium-term has been uptrending since April and May 2025.
SPY price in the short-term has been consolidating sideways, and a large volume breakout or breakdown has not occurred yet.
The 12EMA (blue line) has been holding as support for 5 trading days. Resistance targets to the upside would be $598 to $600.
The grey gap and the 26EMA (purple line) are downside support targets if a rally does not occur this month ($576 to $567).
Breaking news and tariff trade deals are supposed to occur in June and July 2025.

Nightly $SPY / $SPX Scenarios for June 3, 2025 🔮 Nightly AMEX:SPY / SP:SPX Scenarios for June 3, 2025 🔮
🌍 Market-Moving News 🌍
🏭 U.S. Manufacturing Slump Persists
U.S. manufacturing contracted for the third consecutive month in May, with new orders, backlogs, production, and employment all declining. Trade-war disruptions and elevated input costs continue to squeeze factory margins, setting the stage for today’s ISM Manufacturing PMI release
🌐 Global Trade Tensions Weigh on Stocks
Renewed U.S.–China tariff threats sent the S&P 500 lower overnight, as investors fear higher costs for exporters and slower global growth. Futures pointed to another rough open for $SPY/ SP:SPX
📈 China Caixin PMI Exceeds Expectations
China’s May Caixin Manufacturing PMI unexpectedly rose to 50.8, signaling stabilization in export-oriented factories despite ongoing trade uncertainty. That positive surprise may offer some support to Asian equities today
📊 Key Data Releases 📊
📅 Tuesday, June 3:
8:30 AM ET – ISM Manufacturing PMI (May) Measures U.S. factory-sector health; readings below 50 indicate contraction. Today’s survey will confirm if the May downturn persists.
10:00 AM ET – Construction Spending (April) Tracks monthly change in total construction outlays—an important gauge of housing and infrastructure investment trends.
1:00 PM ET – 10-Year Treasury Note Auction Benchmark auction that influences the yield curve. Weak demand or higher yields here can pressure equities, especially growth-oriented sectors.
⚠️ Disclaimer:
This information is for educational and informational purposes only and should not be construed as financial advice. Always consult a licensed financial advisor before making investment decisions.
📌 #trading #stockmarket #economy #news #trendtao #charting #technicalanalysis

Weekly $SPY / $SPX Scenarios for June 2–6, 2025🔮 Weekly AMEX:SPY / SP:SPX Scenarios for June 2–6, 2025 🔮
🌍 Market-Moving News 🌍
🏭 U.S. Manufacturing Slump Ahead of June PMI
Markets are bracing for Tuesday’s ISM Manufacturing PMI (June 3), with economists forecasting a reading below 50.0, signaling continued factory contraction amid slowing global demand and lingering tariff uncertainty.
🛢️ OPEC+ Meeting to Determine Output Path
On Thursday, OPEC+ convenes to decide production levels for July. Expectations center on a modest output cut extension to support prices, with Brent crude trading near $65/bbl ahead of the decision.
💻 Tech Stocks Eye Semiconductor Legislation
Investors are monitoring Congress’s debate over the Chips Act extension. Senate committee hearings this week could accelerate funding for U.S. chip manufacturing—an upside catalyst for NASDAQ:NVDA , NASDAQ:AMD , and $MU.
🌐 China’s Caixin PMI Signals Pivot
China’s Caixin Manufacturing PMI (June 6) is expected to edge above 50.0, indicating a stabilization in smaller export-focused factories. A better-than-expected print could lift global risk sentiment.
🏢 Fed Officials Remain Dovish
Fed Governor Michelle Bowman and New York Fed President John Williams speak this week, reiterating that rate hikes are “on pause.” Their remarks should clarify the Fed’s view on inflation cooling and potential rate cuts late 2025.
📊 Key Data Releases 📊
📅 Monday, June 2:
10:00 AM ET: Factory Orders (April)
Tracks dollar volume of new orders for manufactured goods—an early gauge of industrial demand.
📅 Tuesday, June 3:
8:30 AM ET: ISM Manufacturing PMI (May)
Measures U.S. factory-sector health. A reading below 50 indicates contraction.
10:00 AM ET: Construction Spending (April)
Reports monthly change in total construction outlays—key for housing and infrastructure trends.
1:00 PM ET: 10-Year Treasury Note Auction
Benchmark auction that can shift yield curve and influence $SPY/ SP:SPX positioning.
📅 Wednesday, June 4:
10:00 AM ET: Factory Orders (April)
Dollar volume of new orders for manufactured goods. (Repeat for emphasis on industrial slowdown.)
2:00 PM ET: Fed Governor Michelle Bowman Speaks
Comments on inflation and monetary policy outlook.
📅 Thursday, June 5:
8:30 AM ET: JOLTS Job Openings (April)
Tracks number of unfilled positions—a barometer of labor-market tightness.
10:00 AM ET: OPEC+ Press Conference (Post-Meeting)
Details on production quotas—critical for energy-sector flow.
📅 Friday, June 6:
8:30 AM ET: Nonfarm Payrolls (May)
Monthly change in U.S. employment—core for Fed policy outlook.
8:30 AM ET: Unemployment Rate (May)
Percentage of labor force unemployed—key gauge of labor-market health.
8:30 AM ET: Average Hourly Earnings (May)
Tracks wage trends—important for consumer spending and inflation.
10:00 AM ET: China Caixin Manufacturing PMI (May, preliminary)
Measures health of China’s smaller export-oriented factories.
⚠️ Disclaimer:
This information is for educational and informational purposes only and should not be construed as financial advice. Always consult a licensed financial advisor before making investment decisions.
📌 #trading #stockmarket #economy #news #trendtao #charting #technicalanalysis

Bullish on SPY!What I have understand is that market negatively reacts to Tariff implementation. This is the market sentiment.
Since Tariffs have been paused, cut off, or delayed to another time. Most courts are suspending the Trump Tariff.
Market has been behaving positively, It has also broken the previous small resistance at the price $575. And has also retracement. If you put moving average of 10, you can see it has retested below level but closes above the MA which is a good signal.
I believe SPY will touch $607 within 2 weeks from now, and hopefully a fundamental news will break the $610 level.
And it is common sense if SPY moves rapidly upwards, almost all of the SP500 companies will go up ( not all).
And I think buying stocks that are already at the high resistance level is good if what I think will happen.

Here's what we've got going into next weekSo here's what I see going into next week, The SPY is in a tight little area and what that means is expect extreme volatility, we break to the downside were heading to the gap, if we break to the upside we're going to new all time highs, my bias is to the down side because we've got a lot of bad news coming in especially with China Looking at Taiwan, also it seems market sentiment Is to the downside, but darn it this thing still keeps climbing higher. I'm going to be going short and buying put options,,this is in my opinion, and what I am doing for myself,, you do you, do your own analysis and research. I blame no one for my mistakes, Even though I would like to, but nobody makes me buy or sell, I am the one that must enter that order and I take responsibility for my actions, I have come to learn that I am gifted with making money on the short term scalping markets, but will quickly become a loss because I hold on longer, my education has costed me thousands and thousands of dollars over the decades, And I am still learning, Praise be to God.

Stock Market Forecast | TSLA NVDA AAPL AMZN META MSFTStock Market Forecast | CME_MINI:NQ1! CME_MINI:ES1! SPY QQQ
Mag 7 Forecast | NASDAQ:TSLA NASDAQ:NVDA AAPL AMZN META MSFT GOOGL
