TSLA Long1. Market Structure Overview
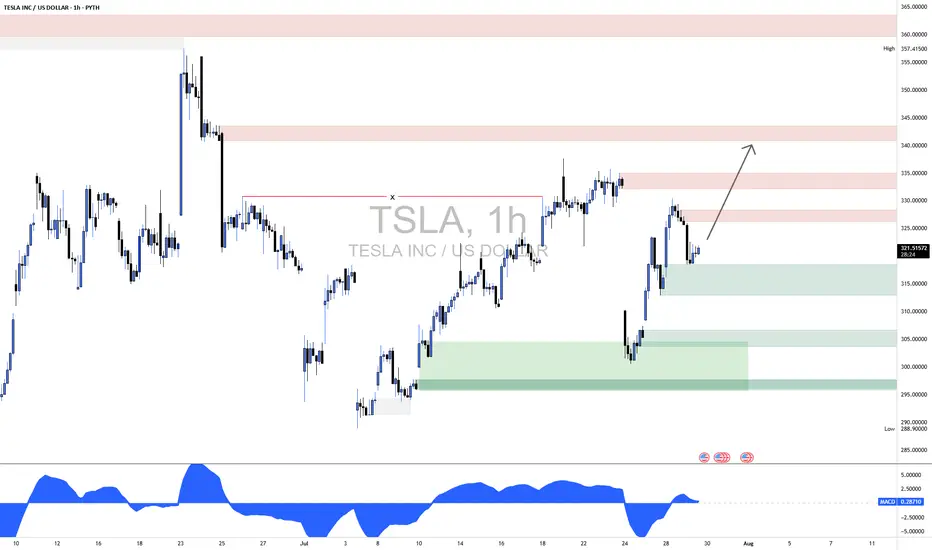
1.1 Previous High Sweep (Fakeout) – ~357.41
Price made a strong push above previous highs but was sharply rejected.
Indicates potential liquidity grab and institutional selling.
1.2 Change of Character (CHoCH) – ~333
Price broke below the previous higher low structure, signaling the end of bullish momentum.
Marks a bearish shift after an extended uptrend.
1.3 Break of Structure (BOS) – ~317
Confirms bearish continuation after CHoCH.
Price closed below support, validating the downtrend.
2. Supply & Demand Zones
2.1 Supply Zones (Resistance)
Zone A (343–357)
Major Supply from the last distribution before the drop.
High volume selling occurred; strong resistance expected.
Zone B (328–336)
Local Supply formed after CHoCH.
Price may react here before testing higher levels.
2.2 Demand Zones (Support)
Zone C (315–319)
Price bounced from here twice; active buyer interest.
Critical zone for near-term bullish continuation.
Zone D (299–306)
Strong Demand and origin of the last large impulse up.
Institutional footprints likely; strong support if retested.
3. Price Action Analysis (Inside Bordered Region)
Current Price (~321.68) is rebounding from Zone C.
Price is forming higher lows intraday, showing bullish intent.
Expected Move:
Short-term bounce toward Zone B (328–336).
If sellers overpower, potential reversal from this supply.
If buyers maintain momentum and break above Zone B, move toward Zone A (343–357) is likely.
4. Momentum & Confirmation
MACD on the 1-hour shows a bullish crossover, suggesting short-term buying pressure.
Structure remains bearish to neutral unless price closes above 336.
A break and hold above 336 would shift bias back to bullish continuation.
5. Financial Context Supporting Price Zones
Recent Tesla Catalysts (July 2025):
Earnings Reported July 24: Mixed results. Strong delivery numbers but concerns about margins due to price cuts.
Investor Sentiment: Divided. Some bullish based on long-term EV growth; others cautious due to margin compression.
Macroeconomic Factors:
Fed policy indecision is increasing volatility.
Tech-heavy indexes (like Nasdaq) are pulling back slightly, causing large-cap techs to see choppy moves.
These events support the supply zone near 328–336 acting as resistance until new bullish data or technical breakouts occur.
TSLA trade ideas
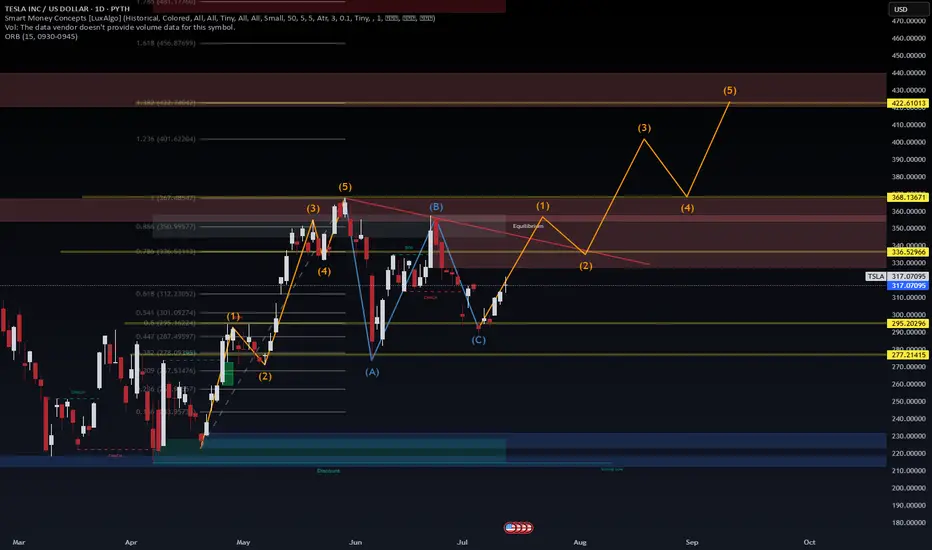
TSLA – Macro Roadmap + VolanX Forecast Confluence📈 TSLA – Macro Roadmap + VolanX Forecast Confluence
Tesla continues to obey our Smart Money Concepts (SMC) + Elliott Wave roadmap, with price rebounding from the (C) correction zone. VolanX DSS and QuanT v3.0 both signal a medium-confidence bullish bias short-term, aligning with our wave count for a new 5-wave structure targeting the $420 zone.
🔍 Technical Outlook (WaverVanir DSS)
📊 Price held above 295.20 demand zone (discount reentry)
⚡️ ABC correction complete, BOS confirmed
🟧 Impulse wave 1 forming above 312–317 key liquidity
🎯 Mid-term targets: 336 > 368 > 422.6
🧠 VolanX QuanT Neural Forecast
1D Forecast: ▲ +1.9% (Medium Confidence)
1W Forecast: ▼ –1.5% (Medium Confidence)
7D Model: Volatility expected, but higher lows forming
Risk: -2.9% short-term drop possible (flagged, high risk zone)
🧩 Confluence
WaverVanir DSS confirms institutional accumulation
VolanX AI models forecast near-term upside but warn of shakeouts
Primary path favors breakout above 336.52 before higher timeframe wave 3 expansion
🚨 Risk Layer
Tight invalidation below 295.20
Optimal scaling opportunity if retrace to 312–316 zone holds
—
🔁 Strategic Play:
Buy retracements into the 312–316 range
Risk below 295.20
Target zone: $368 – $422+
—
📡 Powered by VolanX DSS and WaverVanir Institutional Macro AI
📌 Disclaimer: For educational purposes only. Not financial advice.
#TSLA #WaverVanir #VolanX #NeuralForecast #SmartMoneyConcepts #OptionsFlow #AITrading #WaveTheory #QuantFinance #InstitutionalStrategy #ElonMoves #NASDAQ #TradingView
TSLA Key Technical Levels & Structure
1. 1‑Hour Chart — Uptrend and Resistance
TSLA has been in an ascending channel since April, with recent support around $274–280 on the 4‑h chart
On the 1‑hour, momentum is strong—macros like RSI, MACD, moving averages are all bullish (e.g., the 50‑hour MA is supporting around $330) .
2. Resistance Cluster ~ $357–360
That zone corresponds with prior swing highs and psychological resistance.
A push to $357.82 fits as a logical next target if TSLA maintains this bullish momentum.
3. Liquidity Grab Below
You anticipate a drop from that level to sweep stops and gather buy liquidity—common in breakout strategies.
Price could revisit intraday pivots—like the $330–335 zone or deeper around $320 on drop—which aligns with previous VWAP or double VWAP support regions noted in intraday setups .

TSLA printing another 3 major bearish pattnerNASDAQ:TSLA now showing a bear flag with a measured move to the downside approx $275 USD. This would also fulfill the descending triangle measured moved that its also seen as resistance in the last few sessions rejecting higher prices.
Bearish! Short position taken

Is Tesla's $1 Trillion Market Cap Sustainable in the Long Run?A Milestone Achieved
Tesla, the electric vehicle pioneer led by Elon Musk, has once again shattered records by surpassing a $1 trillion market capitalization. This significant milestone, achieved in early November 2024, solidifies Tesla's position as a dominant force in the automotive industry and a symbol of innovation and disruption.
The Factors Behind the Surge
Several key factors have contributed to Tesla's remarkable market performance:
1. Strong Financial Performance: Tesla has consistently delivered strong financial results, with record-breaking revenue and profitability. The company's focus on cost reduction, operational efficiency, and product innovation has driven its growth.
2. Accelerated EV Adoption: The global shift towards electric vehicles has gained momentum, fueled by increasing environmental concerns and government incentives. Tesla, as the leading EV manufacturer, is well-positioned to capitalize on this trend.
3. Innovative Product Lineup: Tesla's diverse product portfolio, including electric vehicles, energy storage solutions, and autonomous driving technology, has captivated consumers and investors alike. The company's continuous innovation and cutting-edge technology have solidified its position as a technology leader.
4. Elon Musk's Visionary Leadership: Elon Musk's charismatic leadership and ambitious vision have inspired confidence among investors and consumers. His unwavering commitment to pushing the boundaries of technology has propelled Tesla to new heights.
5. Favorable Regulatory Environment: The supportive regulatory environment for electric vehicles in key markets, such as the United States and China, has further boosted Tesla's growth prospects.
The Road Ahead
As Tesla continues to expand its operations and introduce new products, the company's future prospects remain bright. However, several challenges lie ahead:
1. Intensifying Competition: The electric vehicle market is becoming increasingly competitive, with traditional automakers and emerging startups investing heavily in electric vehicle technology.
2. Supply Chain Disruptions: Global supply chain disruptions, particularly related to semiconductor shortages, could impact Tesla's production and delivery timelines.
3. Economic Uncertainty: Economic downturns and geopolitical tensions could negatively impact consumer demand for electric vehicles.
4. Regulatory Risks: Changes in government policies and regulations could affect Tesla's operations and profitability.
Despite these challenges, Tesla's strong brand, innovative products, and dedicated customer base position the company for continued growth and success. As the electric vehicle revolution accelerates, Tesla is poised to remain at the forefront, shaping the future of transportation and energy.
Conclusion
Tesla's achievement of a $1 trillion market capitalization is a testament to its disruptive innovation, strong leadership, and favorable market conditions. While challenges persist, the company's long-term vision and strategic execution position it for continued growth and success in the years to come.

Tesla Pushing higher to 230-240 regionTesla Pushing higher to 230-240 region.
Trader Trick Entry (after 1-2-3 and before Ross hook)

The idea of a bull marketEsteemed analysts and traders,
I hope this correspondence finds you in good health and high spirits, prepared to tackle the upcoming week with renewed energy. I extend my best wishes for your continued success in all your business endeavors. It is worth noting that success in trading is largely dependent on the consistent definition and adherence to one's own rules.
As a supporter of the Elliott Wave Principle, I consider this methodology an invaluable tool for market analysis. After three years of personal experience, I have developed my approach by combining this principle with meticulous consideration of different market scenarios. I strive to avoid market surprises by maintaining a range of market prospects, which enables me to recognize the market structure forming with 100% accuracy.
I am pleased to share my analysis with you, with the caveat that I do not provide buy or sell signals. My perspective on idea analysis is entirely impartial, and if my analysis meets your standards, it may serve as a guide to making an informed decision.
For your reference and comparison, I have attached my previous analysis of the same market. All the details of my analysis are clearly labeled for ease of comprehension. Nonetheless, familiarity with the Elliott Wave Principle theory would facilitate an understanding of the analytical idea.
My study of the Elliott Wave Principle took nearly three years, during which my understanding and experience with this invaluable tool have grown. My progress thus far is a testament to the legacy of Ralph Nelson Eliot, whose genius has provided the foundation for my achievements. May he rest in peace.
I express my gratitude for your continued support and kindness, and welcome your comments and critiques.
May my analysis be a valuable asset to your business journey, and I remain sincerely yours,
Mr. Nobody

Bullish market in TeslaEsteemed analysts and traders,
I hope this correspondence finds you in good health and high spirits, prepared to tackle the upcoming week with renewed energy. I extend my best wishes for your continued success in all your business endeavors. It is worth noting that success in trading is largely dependent on the consistent definition and adherence to one's own rules.
As a supporter of the Elliott Wave Principle, I consider this methodology an invaluable tool for market analysis. After three years of personal experience, I have developed my approach by combining this principle with meticulous consideration of different market scenarios. I strive to avoid market surprises by maintaining a range of market prospects, which enables me to recognize the market structure forming with 100% accuracy.
I am pleased to share my analysis with you, with the caveat that I do not provide buy or sell signals. My perspective on idea analysis is entirely impartial, and if my analysis meets your standards, it may serve as a guide to making an informed decision.
For your reference and comparison, I have attached my previous analysis of the same market. All the details of my analysis are clearly labeled for ease of comprehension. Nonetheless, familiarity with the Elliott Wave Principle theory would facilitate an understanding of the analytical idea.
My study of the Elliott Wave Principle took nearly three years, during which my understanding and experience with this invaluable tool have grown. My progress thus far is a testament to the legacy of Ralph Nelson Eliot, whose genius has provided the foundation for my achievements. May he rest in peace.
I express my gratitude for your continued support and kindness, and welcome your comments and critiques.
May my analysis be a valuable asset to your business journey, and I remain sincerely yours,
Mr. Nobody

The double zigzag pattern will be completed or slightly expandedDear analysts and traders,
I hope you are doing well and are motivated for the week ahead. I wish you all the success in your business endeavors. Remember that success in trading lies in consistently defining and sticking to your rules.
As someone interested in the Elliott Wave Principle, I find it to be an invaluable tool for market analysis. I have developed my approach by combining this principle with my personal experience and by considering different scenarios that are likely to occur in the market. It should be noted that I do not like to be surprised in the market, and that's why I have different market prospects. I follow them to be sure and recognize the structure that is forming so that I can 100% recognize it.
I will share my analysis with you, but please note that I am not providing any buy or sell signals. My perspective on idea analysis is completely unbiased, so if the idea analysis meets your standards, you can use it as a guide to make an informed decision.
I have attached my previous analysis of the same market so that you can compare and see the differences. All the details of my analysis are clearly labeled, making it easy for you to understand. However, having a basic familiarity with the Elliott Wave Principle theory will help you understand the analytical idea more easily.
I have been studying the Elliott Wave Principle for almost three years now, and over time, my understanding of this knowledge and experience has grown. What I have achieved so far is the legacy of a genius called Ralph Nelson Eliot, and I am really happy with my progress. May peace be upon him.
Thank you for your support so far. I will always remember your kindness. Please share your comments and criticisms with me.
I hope my analysis will be useful to you in your business journey, and I wish you all the best.
Sincerely,
Mr. Nobody

4 Accurate Predictions Made by AI for Tesla (TSLA)In the rapidly evolving landscape of financial markets, Artificial Intelligence (AI) has emerged as a pivotal force, transforming traditional trading strategies into sophisticated, data-driven methodologies. This article delves into the role of AI in identifying and capitalizing on market trends, focusing on recent successes in detecting bearish stock patterns in Tesla (TSLA) shares. Through a detailed analysis of three distinct patterns—Cup-and-Handle Inverse, Head-and-Shoulders Top, and Broadening Wedge Ascending—this discussion illustrates how AI technologies, particularly those developed by Tickeron, are reshaping investment approaches.
The AI Revolution in Stock Market Analysis
The integration of AI in stock market analysis marks a significant shift from human-driven decision-making to automated, algorithm-based strategies. AI's capacity to process vast datasets, recognize patterns, and predict market movements is unparalleled. These capabilities enable traders and investors to make more informed decisions, often with higher accuracy and speed than traditional methods.
Tesla's Bearish Patterns
Prediction #1. Downtrend Detected
Cup-and-Handle Inverse Pattern
On December 7, 2023, Tickeron's AI advisor, A.I.dvisor, detected a Cup-and-Handle Inverse pattern in Tesla's stock, indicating a potential bearish turn. Initially priced at $242.64, the stock was monitored closely until December 12, when the bearish trend was confirmed, and a target price was set. By January 12, 2024, Tesla's stock reached the target price of $223.07, offering a 9.83% gain for those who shorted the stock based on the AI's prediction.
Prediction #2. Downtrend Detected
Head-and-Shoulders Top Pattern
Simultaneously, A.I.dvisor identified a Head-and-Shoulders Top pattern for Tesla on the same dates, with the stock also priced at $242.64. This pattern, another indicator of a potential price decline, led to a similar outcome. On January 12, the stock price hit the target of $222.45, again resulting in a 9.83% gain for traders who acted on the AI's advice.
Prediction #3. Downtrend Detected
Broadening Wedge Ascending Pattern
A more recent analysis began on December 14, 2023, when a Broadening Wedge Ascending pattern was detected in Tesla's stock, then priced at $251.05. This pattern, confirmed on January 3, 2024, signaled another bearish trend, culminating in the stock reaching a target price of $233.59 by January 9. This pattern offered traders a 6.44% gain, further showcasing AI's prowess in predicting market movements.
The Role of Tickeron Patterns and AI Robots
Tickeron's innovative approach to market analysis encompasses the development of AI robots capable of scanning the market for specific patterns. These patterns, such as the Cup-and-Handle Inverse, Head-and-Shoulders Top, and Broadening Wedge Ascending, are key indicators of potential market movements. Tickeron's AI robots not only identify these patterns but also provide actionable insights, including target prices and potential gains, thereby equipping traders with the information needed to make strategic decisions.
New Robot factory from Tickeron Trading Results for last 12 months
TSLA
AI Robots (Signals Only)
AI Robot's Name P/L
Swing trader: Downtrend Protection (TA) 73.57%
Trend Trader: Popular Stocks (TA&FA) 37.41%
Day Trader, Popular Stocks: Price Action Trading Strategy (TA&FA) 36.66%
AI Robots (Virtual Accounts)
AI Robot's Name P/L
Swing Trader ($700 per position): Hedge Fund Style Trading (TA&FA) 77.75%
Swing Trader, Popular stocks ($1.5K per position): Mixed Strategy (TA&FA) 65.65%
Swing Trader, Popular stocks ($700 per position): Mixed Strategy (TA&FA) 59.95%
Conclusion
The integration of AI in financial markets represents a paradigm shift towards data-driven investment strategies. Through the lens of recent bearish patterns identified in Tesla's stock, it's evident that AI technologies like those developed by Tickeron are at the forefront of this transformation. By leveraging machine learning algorithms and AI robots, investors can navigate the complexities of the stock market with greater confidence and precision. As AI continues to evolve, its impact on financial markets is poised to deepen, offering promising prospects for the future of trading and investment.
PYTH:TSLA

TSLA in -12.68% downward trend, declining for three consecutive Moving lower for three straight days is viewed as a bearish sign. Keep an eye on this stock for future declines. Considering data from situations where TSLA declined for three days, in 206 of 266 cases, the price declined further within the following month. The odds of a continued downward trend are 77%.
PYTH:TSLA
Technical Analysis (Indicators)
Bearish Trend Analysis
The Momentum Indicator moved below the 0 level on December 29, 2023. You may want to consider selling the stock, shorting the stock, or exploring put options on TSLA as a result. In 55 of 72 cases where the Momentum Indicator fell below 0, the stock fell further within the subsequent month. The odds of a continued downward trend are 76%.
The Moving Average Convergence Divergence Histogram (MACD) for TSLA turned negative on December 29, 2023. This could be a sign that the stock is set to turn lower in the coming weeks. Traders may want to sell the stock or buy put options. Tickeron's A.I.dvisor looked at 43 similar instances when the indicator turned negative. In 32 of the 43 cases the stock turned lower in the days that followed. This puts the odds of success at 74%.
TSLA moved below its 50-day moving average on January 09, 2024 date and that indicates a change from an upward trend to a downward trend.
The 10-day moving average for TSLA crossed bearishly below the 50-day moving average on January 12, 2024. This indicates that the trend has shifted lower and could be considered a sell signal. In 10 of 13 past instances when the 10-day crossed below the 50-day, the stock continued to move higher over the following month. The odds of a continued downward trend are 77%.
The Aroon Indicator for TSLA entered a downward trend on January 29, 2024. This could indicate a strong downward move is ahead for the stock. Traders may want to consider selling the stock or buying put options.
Bullish Trend Analysis
The RSI Indicator shows that the ticker has stayed in the oversold zone for 10 days. The price of this ticker is presumed to bounce back soon, since the longer the ticker stays in the oversold zone, the more promptly an Uptrend is expected.
The Stochastic Oscillator shows that the ticker has stayed in the oversold zone for 18 days. The price of this ticker is presumed to bounce back soon, since the longer the ticker stays in the oversold zone, the more promptly an upward trend is expected.
Following a +4.57% 3-day Advance, the price is estimated to grow further. Considering data from situations where TSLA advanced for three days, in 292 of 349 cases, the price rose further within the following month. The odds of a continued upward trend are 84%.
TSLA may jump back above the lower band and head toward the middle band. Traders may consider buying the stock or exploring call options.

Innovations in Trading Bots Powered by AIIn the dynamic arena of stock trading, Tickeron has distinguished itself with the introduction of Virtual Accounts (VAs), a novel class of AI Robots designed for advanced risk management in the fluctuating financial market. This development signifies a major leap in the capabilities of AI-driven trading tools, offering traders and hedge funds enhanced risk management options.
The Generation of Tickeron's Virtual Accounts
Tickeron, a pioneer in AI trading technology, recognized the growing need for AI Robots capable of proficient risk management. Their team of quantitative analysts developed a platform blending effective algorithms with sophisticated money management models. This innovation gave birth to the Virtual Accounts, heralding a new era in AI trading.
Core Attributes of Virtual Accounts
Customizable Trading Balance and Position Size: Enabling traders to tailor their investment strategies.
Advanced Hedging System: Facilitates both long and short positions for versatile trading.
Loss Limitation Measures: Implements safeguards for better risk control.
Tickeron's Evolutionary Pathway
Tickeron's commitment to revolutionizing trading experiences unfolds through four developmental stages, each designed to cater to the varied demands of their client base:
First Stage: Development of a comprehensive suite of AI Engines for technical and fundamental analysis.
Second Stage: Introduction of Virtual Accounts, enabling manual replication of trades to brokerage accounts.
Third Stage (Forthcoming): Integration of VAs with brokerage accounts for executing real money trades.
Fourth Stage (Proposed): Rollout of fully automated trade execution directly linked to users' brokerage accounts.
Advancing the AI Trading Ecosystem
Tickeron, a central figure in algorithmic AI trading, offers innovative tools like the Pattern Search Engine and Trend Prediction Engine. The deployment of Virtual Accounts offers multiple benefits to traders:
Customizable Trading Parameters: Adjusts trading balance and position size according to individual risk preferences.
Hedging Strategies: Offers protection against market downturns.
Trade Automation: Reduces human error with AI-driven trade replication.
Enhanced Risk Management: Curtails potential losses and bolsters decision-making.
Adaptability: Stays abreast of evolving financial markets.
Continuous Enhancement: Ensures regular updates and improvements to algorithms and AI Robots.
Embracing the AI Revolution in Trading
Tickeron's Virtual Accounts represent a significant advancement in AI-powered trading, providing dynamic tools for effective market navigation. While these innovations promise to transform trading strategies, potential investors are urged to comprehend the associated risks and limitations. As AI reshapes the financial sector, Tickeron's dedication to innovation firmly positions them at the forefront of AI-driven trading solutions for the future.

SND Concepts | Tesla Aiming HigherTSLA looks bullish at H1. The price has the potential to find meaningful resistance at the 260 area only to recover back up to the 280–290 area.
Strategy: SND & Wolfe Wave
K.

Tesla's 2000 Cybertruck Production Underway!As you may already know, Tesla has officially commenced the production of 2000 Cybertrucks this year, and we believe this development presents a unique opportunity for traders like yourself.
Tesla has consistently demonstrated its ability to disrupt the automotive industry, and the Cybertruck is no exception. With its futuristic design, cutting-edge features, and impressive performance capabilities, the Cybertruck has garnered immense attention and anticipation from consumers worldwide.
Given Tesla's track record of delivering groundbreaking products, we believe that the production of 2000 Cybertrucks this year will undoubtedly significantly impact the market. As traders, it is essential to stay ahead of the curve and seize opportunities that arise from such developments.
Hence, we encourage you to consider placing Tesla market orders, considering the potential impact of the Cybertruck production. However, we advise approaching this opportunity cautiously, as any investment involves inherent risks. Conducting thorough research, analyzing market trends, and consulting with financial advisors is crucial to making informed trading decisions.
Tesla's market orders for the Cybertruck are expected to surge in demand, especially with the growing interest from individual consumers and commercial buyers. By placing market orders, you can benefit from the potential rise in Tesla's stock value, which has historically responded positively to significant product launches.
To capitalize on this opportunity, I recommend visiting Tesla's official website or contacting your trusted brokerage firm to place your Tesla market orders. Remember to evaluate your investment strategy and risk tolerance before trading carefully.
As always, staying updated with the latest news and developments surrounding Tesla and the automotive industry is essential. By closely monitoring market trends and emerging technologies, you can make informed decisions that align with your trading goals.

Buy now for TSLS or wait for next dip
I am thrilled to share with you that Tesla chargers are gaining more supporters as the company's plug becomes the American standard. This is a significant milestone for Tesla and a clear indication of the company's commitment to providing sustainable transportation solutions.
Currently, the $210 level is acting as a support level, as it did on Friday and again on Monday. It's important to keep an eye on this level.
However, if the stock manages to break through this level, it's crucial to pay attention to the $258 mark. This level not only represents the 161.8% extension of the recent range but also the 50% retracement of Tesla's bear-market correction.
In short, it's essential to exercise caution when it comes to Tesla stock in the short term. It may be wise to look for opportunities to buy the dip.

TSLA SHORT TSLA up trended well from a double bottom to close out 2022 to a head and shoulders pattern
through February and is now in a downtrend. Within that downtrend, there have been some small
pullbacks. The MACD indicator suggests with the lines crossing under the histogram, that a pullback
will soon occur.
I see this an opportunity to buy put options with mid-May expiration at a strike midway between
current price and the retracement zone from the January up trend.
Fundamentally, competition in China and maybe the USA with Lucid, continue to challenge Telse
as does union efforts in the NY solar panel plant, the delays in Cybertruck and rising interest
rates. Demand has been soft lately TSLA dropped its prices to stimulate interest and revenues
could stall one way or another. This suggests the downtrend may maintain its momentum.
