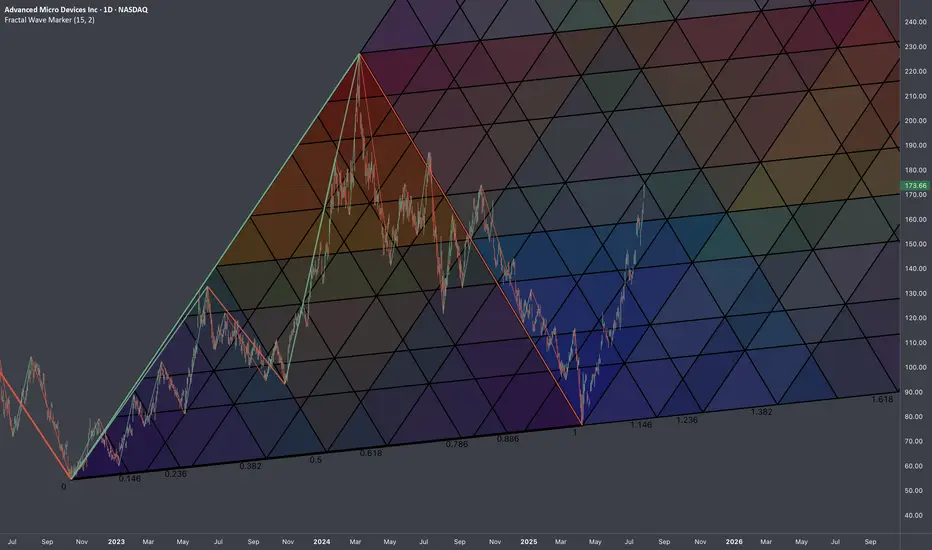
$AMD: Fractal Geometry (Cycle 2022-2025)🏛️ Research Notes
3 Coordinates used for base L-H-L
Fragmented with color spectrum fibs:
Extending structure with same scaling laws:
The chart intended to show objective structure covering unfolding progressions within cycles.
1.92 CAD
2.25 B CAD
35.32 B CAD
About Advanced Micro Devices Inc
Sector
Industry
CEO
Lisa T. Su
Website
Headquarters
Santa Clara
Founded
1969
FIGI
BBG013V1K9K1
Advanced Micro Devices, Inc. engages in the provision of semiconductor businesses. It operates through the following segments: Data Center, Client, Gaming, and Embedded. The Data Center segment includes server-class CPUs, GPUs, AI accelerators, DPUs, FPGAs, SmartNICs, and Adaptive SoC products. The Client segment refers to the computing platforms, which are a collection of technologies that are designed to work together to provide a more complete computing solution. The Gaming segment is a fundamental component across many products and can be found in APU, GPU, SoC or a combination of a discrete GPU with another product working in tandem. The Embedded segment focuses on the embedded CPUs, GPUs, APUs, FPGAs, and Adaptive SoC products. The company was founded by W. J. Sanders III on May 1, 1969 and is headquartered in Santa Clara, CA.
Related stocks
Amd - New all time highs will follow!🪠Amd ( NASDAQ:AMD ) rallies even much further:
🔎Analysis summary:
After Amd perfectly retested a major confluence of support a couple of months ago, we saw a textbook reversal. This retest was followed by a rally of more than +100% in a short period of time. But considering all the bullish mo

Elliott Wave Outlook: AMD Expects Pullback Soon Before RallyThe Advanced Micro Devices Inc., (AMD) favors rally in impulse Elliott Wave sequence from 4.09.2025 low & expect upside in to 168.36 – 190.36 to finish it. Impulse sequence unfolds in 5, 9, 13, 17…., swings & ends with momentum divergence. In daily, it ended pullback in 3 swings at 75.22 low in blue

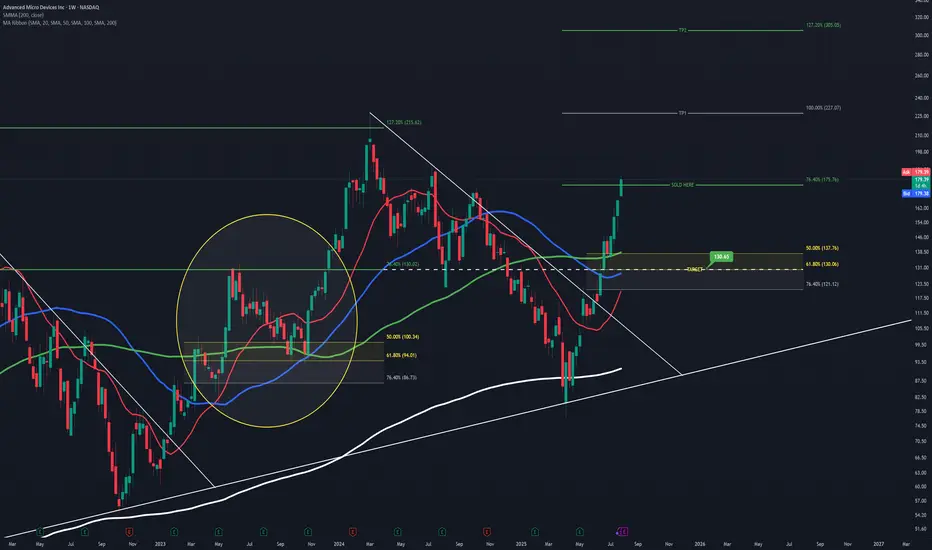
AMD Projection and Entry PointThis is speculation just like before, which played out very well so this is me having another shot at it.
Going off of the prior cycle AMD went through and comparing it to the one it's currently in, you can see a lot of similarities.
Learning from it's past and seeing how it likes to react to c
AMD WEEKLY TRADE SIGNAL (7/31/25)
### 🚀 AMD WEEKLY TRADE SIGNAL (7/31/25)
📈 **MARKET SNAPSHOT**
🟢 Daily RSI: **86.0** 🔥
🟢 Weekly RSI: **80.4**
📊 Volume: 🔺 1.5x (Institutional surge)
💬 Call/Put Ratio: **1.90**
🌪 Gamma Risk: **HIGH (1DTE)**
🧠 Sentiment: **Extremely Bullish** across all models
---
💥 **TRADE IDEA**
📍 Ticker: **\ NAS
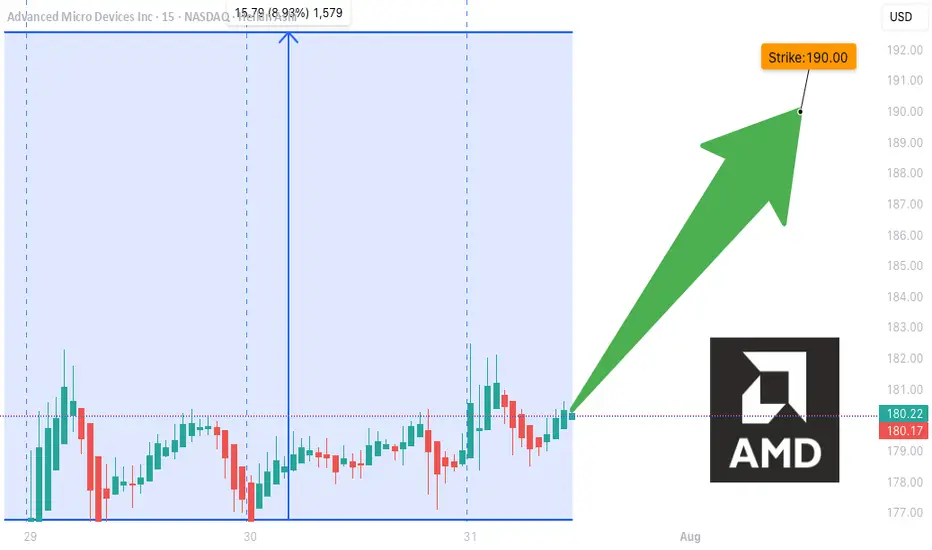
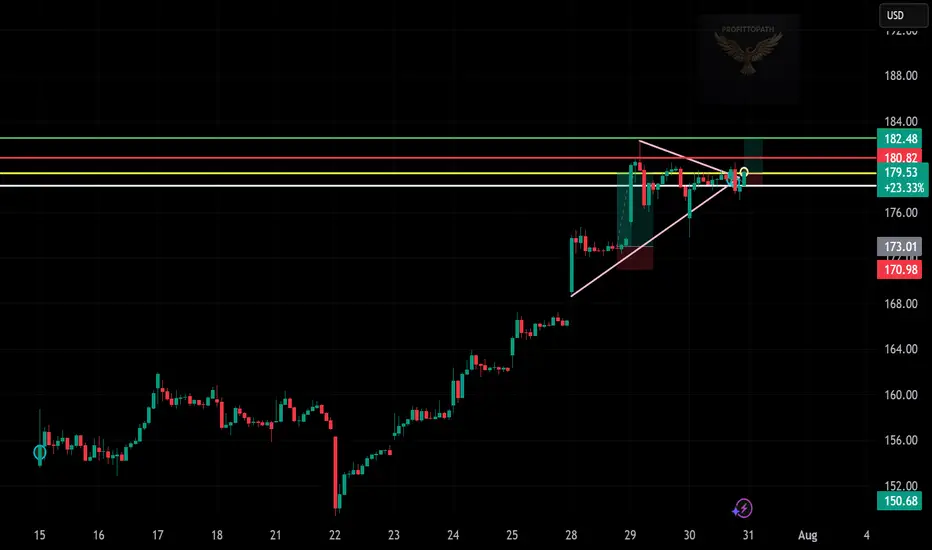
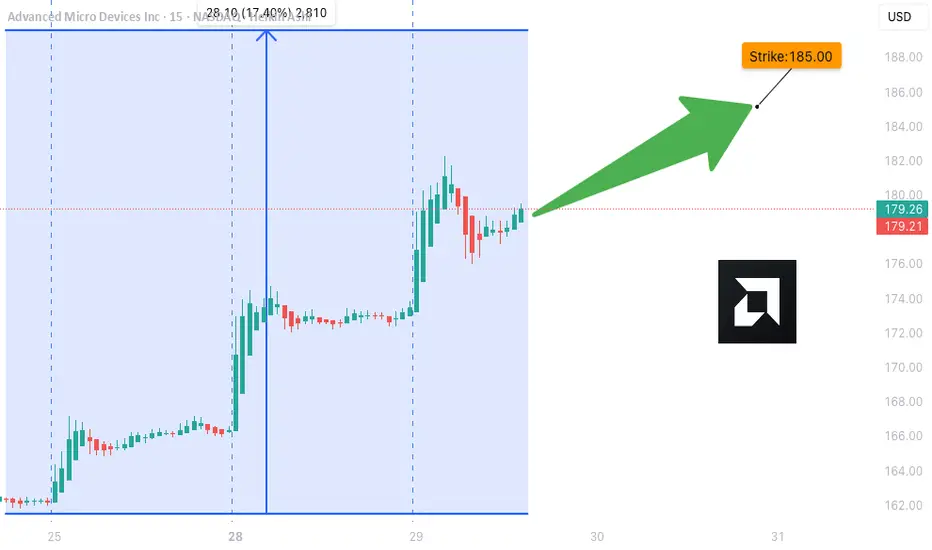
“AMD Breaks Out — Triangle Setup in Action”
📈 Trade Snapshot:
AMD breaks a tight triangle range with momentum. A clean move above $180.82 puts $182.48 in sight.
🎯 Plan:
→ Entry: $179.53
→ SL: ~$173.00
→ Target: $182.48
📌 Clear structure, low-risk entry, breakout confirmed. Let it run.
📋 Hashtags:
#AMD #BreakoutTrade #ChartSetup #Technica
Quick draw upI did quick and simple T/A and in my opinion seems to be the likely outcome. EMA lines are about to cross, it has made a lower low, which has now flipped the Fibonacci and likely to get rejected at the 61.80% - 50% range. The path lines aren't placed specific to the timeframes so ignore that it stre

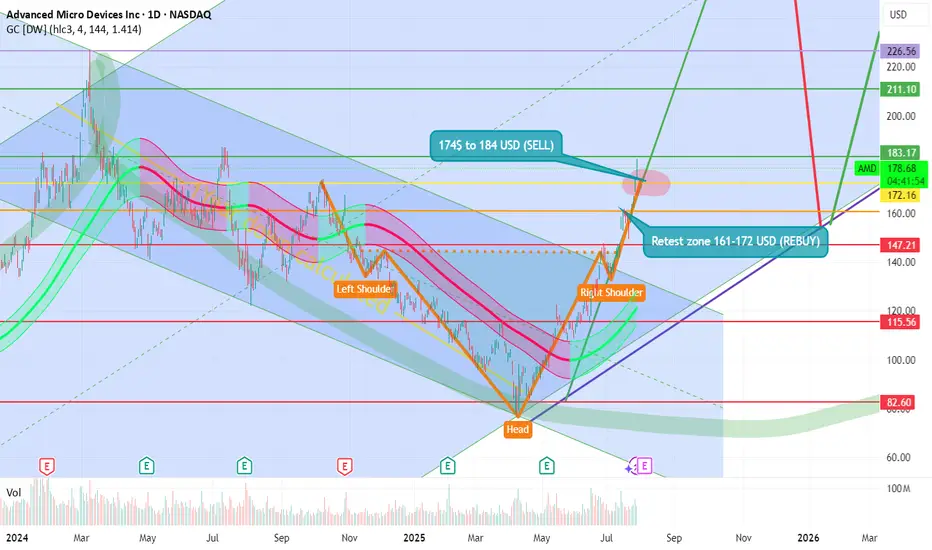
AMD we have made it at 170 USD guys! TSXGANG! 📊 AMD Stock Technical Analysis
🧠 Head and Shoulders Pattern
- This chart shows a classic head and shoulders formation:
- Left Shoulder: First peak around ~$172
- Head: Highest peak near ~$183
- Right Shoulder: Second peak returning to ~$178
🔎 This pattern often signals a potential reversal in an u
AMD Weekly Trade Alert (2025-07-29)
**🔥 AMD Weekly Trade Alert (2025-07-29) 🔥**
💹 *Momentum Confirmed. Calls Loaded. Let’s Ride.*
📈 **Key Bullish Signals**
✔️ Daily RSI: **83.2** (Rising)
✔️ Weekly RSI: **79.9** (Rising)
✔️ Call/Put Ratio: **2.03** 🧨
✔️ Volatility: Low (VIX = 15.2)
⚠️ Volume Weak (0.9x) – But not a dealbreaker.
---
AMD: Potential Mid-Term Reversal from Macro SupportPrice has reached ideal macro support zone: 90-70 within proper proportion and structure for at least a first wave correction to be finished.
Weekly
As long as price is holding above this week lows, odds to me are moving towards continuation of the uptrend in coming weeks (and even years).
1

See all ideas
Summarizing what the indicators are suggesting.
Oscillators
Neutral
SellBuy
Strong sellStrong buy
Strong sellSellNeutralBuyStrong buy
Oscillators
Neutral
SellBuy
Strong sellStrong buy
Strong sellSellNeutralBuyStrong buy
Summary
Neutral
SellBuy
Strong sellStrong buy
Strong sellSellNeutralBuyStrong buy
Summary
Neutral
SellBuy
Strong sellStrong buy
Strong sellSellNeutralBuyStrong buy
Summary
Neutral
SellBuy
Strong sellStrong buy
Strong sellSellNeutralBuyStrong buy
Moving Averages
Neutral
SellBuy
Strong sellStrong buy
Strong sellSellNeutralBuyStrong buy
Moving Averages
Neutral
SellBuy
Strong sellStrong buy
Strong sellSellNeutralBuyStrong buy
Displays a symbol's price movements over previous years to identify recurring trends.
AMD5426832
Advanced Micro Devices, Inc. 4.393% 01-JUN-2052Yield to maturity
5.84%
Maturity date
Jun 1, 2052
AMD5426831
Advanced Micro Devices, Inc. 3.924% 01-JUN-2032Yield to maturity
4.48%
Maturity date
Jun 1, 2032
AMD6026360
Advanced Micro Devices, Inc. 4.319% 24-MAR-2028Yield to maturity
4.04%
Maturity date
Mar 24, 2028
AMD6026359
Advanced Micro Devices, Inc. 4.212% 24-SEP-2026Yield to maturity
4.02%
Maturity date
Sep 24, 2026
See all AMD bonds
Curated watchlists where AMD is featured.


