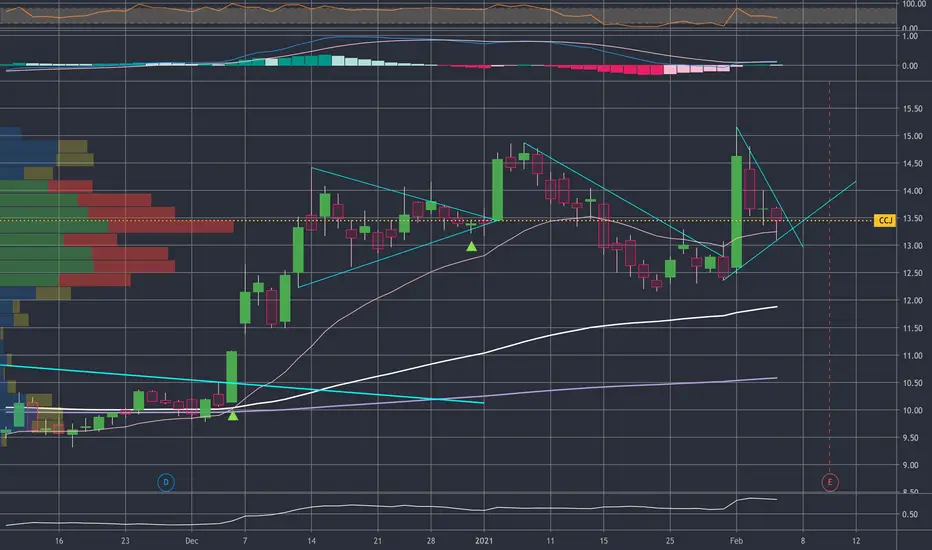
$CCJ - swing the right shoulderThis could have H&S setting up.
I am grabbing commons with plan to swing trade to the top(ish) of the right shoulder, then cut bait and wait for another bull pattern.
If the H&S confirms solidly, I may buy puts for the ride down.
So short term: (1-5 days) go long
pause for 3-5 days to confirm pattern
re-enter with puts if H&S confirms, else re-analyze entry.
CCO trade ideas


CCJ ON A MISSION?Last monthly at 14.29$ wasn't properly retested yet, so to continue in this Bullrun I'd like to see this support claimed.
Otherwise, I see a steep growth continuing up to the monthly at 33.81$ once spot uranium gets bought up.
Beware of the green gap.

CCJ Uranium Hot Potato Trader here, whats up fellow trader!
Cameco is one of the world's largest uranium producers. When operating at normal production, the flagship McArthur River mine in Saskatchewan accounts for roughly 50% of output in normal market conditions. Amid years of uranium price weakness, the company has reduced production, instead purchasing from the spot market to meet contracted deliveries. In the long term, Cameco has the ability increase annual uranium production by restarting shut mines and investing in new ones. In addition to its large uranium mining business, Cameco operates uranium conversion and fabrication facilities.
Probably the best Uranium company out there.
Market Cap: 7.4 B
Option Chain notes of interest
3/19 20c
OI 30,892
4/16 Heavy volume and open interest noted
Did you read the book about the man made of uranium?
In the end, they reveal it was U all along!
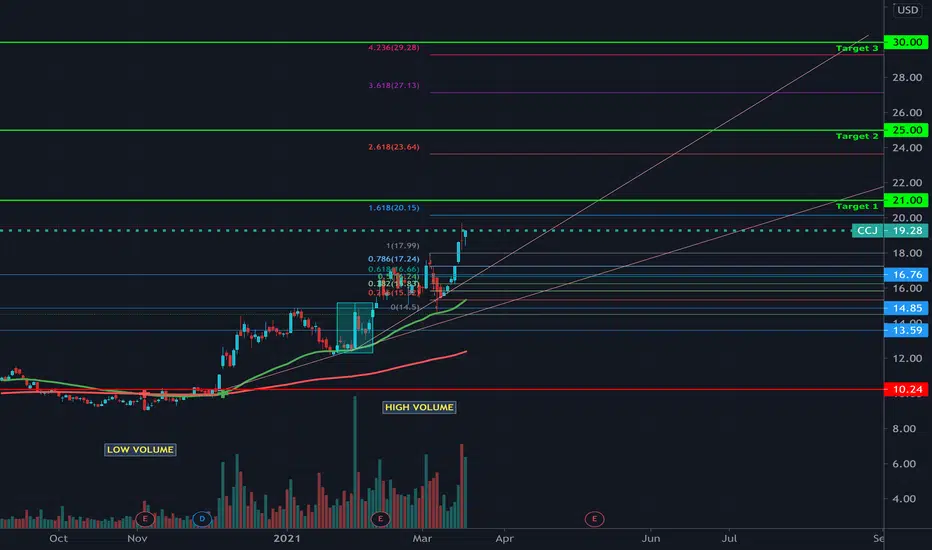
$CCJ Bullish outlookOne of the most technically pleasing charts that I've seen, with a wave 2 and 4 on .618 retracements and on track to hit the 2.618 fib level as a wave 5. Long term this whole sector is going to explode, and although I added a position on an already extended position, uranium spot price added 21% year to date to it's value.

Cameco CCJ 25 to 30 on this movewant to stay above 15.4. think good risk reward here.
not financial advice

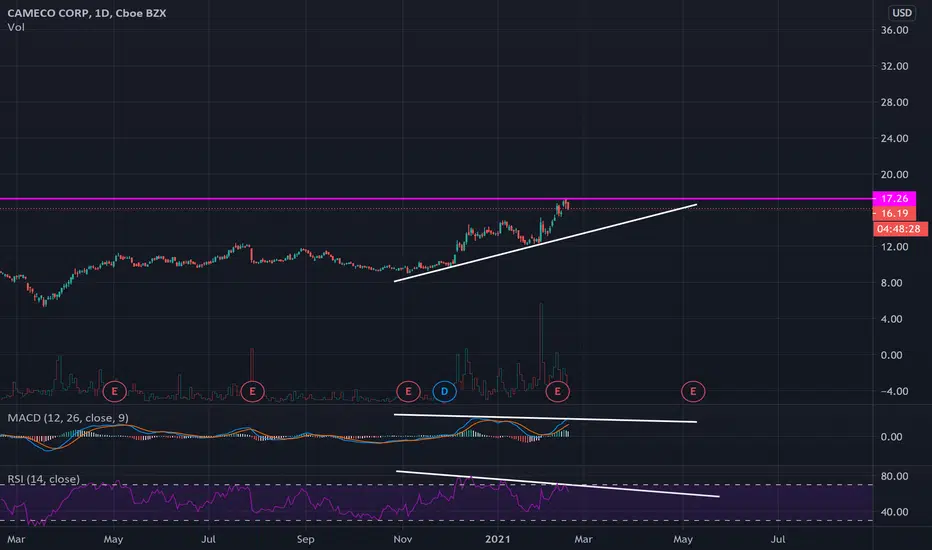
$CCJ Kiss of 50 day with inside bar Over 16 $ i am going long, 1 hour inside bar, this is being loaded big time by smart $ imo

Potential long opportunity on CamecoCameco has been in this ascending channel for some time, which is confluencing with the multi-year falling wedge on the weekly candles. Possible price target would be around $59. At the current time of the market cycle, energy-sector performs best.

CCJIt appears we are finally breaking out of the rising wedge pattern. We are currently holding the 21 MA however, if it falls, we will retest the trend line we recently broke out of. Short term bearish but long term this stock is gonna see some crazy gains.

$CCJ - crushed earningson the 20 EMA, crushed earnings, could be a buy the dip opportunity. Alerts set for breaking up or down.

«Made it»Ever wanted to just take a break from trading, shoving everything all in, close your eyes and not look at the investment for many years? I bet a lot of people have thought this thought plenty of times. The «made it» investment. Trust me, I’m not recommending this at all. But oh my god, this looks like if I was to do excactly that, this is where I’d do it. Do your own research on Uranium. Invest wisely. I wish I «made it»

2021 Actual Trade: CCJ +25% ProfitsTechnically, CCJ registered a +10% gap-up breakout from an ideal round-shape cup pattern. Thus, it got our attention to follow up with CCJ. We decided to get in after four trading sessions on 12/11/2020 near 13 because 12-13 formed to support.
It went up well for the next few weeks.
Although there was a deep pullback almost wiped out all paper profits. But we held through it as 12.5 offered support level in volatile January.
Then, CCJ cannot wait to rally as outstanding volume came in on February 1, 2021, with +18% gains. Institutional investors decided to join the party. It boosted CCJ to our finish line with +25% profits.

CCJ Elliot Wave analysis CCJ very strong company fundamentally with very strong assets. Uranium bullmarket started this year and will continue for the next decade as electricity will be in high demand. Nuclear energy will be inevitable. CCJ is the worlds biggest publicly traded uranium company.
PT shortterm $35-37
PT longterm $60-100> depends on agression of uranium bullmarket..
~slippe


CCJ Halted 02/18 AM?It appears that CCJ is not trading this morning. I googled it and found a paywall article posted 2 hours ago that says "CCJ Halted, News Pending" - does anyone have any ideas what's going on?

Uranium Cycle in its Early InningsUranium is in the early stages of building a bullish regime of volatility over a Tail duration. It currently already has that over a trend duration.
You need to be taking full advantage of dips in this environment. Buy the damn dip.


$CCJ AccumulationCameco under accumulation from 2016. U spot increasing should do very weel over next 5 year IMO

CCJ - Decade-long, absolute unit, falling wedge breakout!Just some classical TA - Falling wedge PT is the size of the left side of the wedge from the breakout point. This wedge has been forming for over a decade and its just gigantic. Massive, massive gains if it works out here. I'm loaded with shares and options, one of my higher-conviction plays in a month or so.