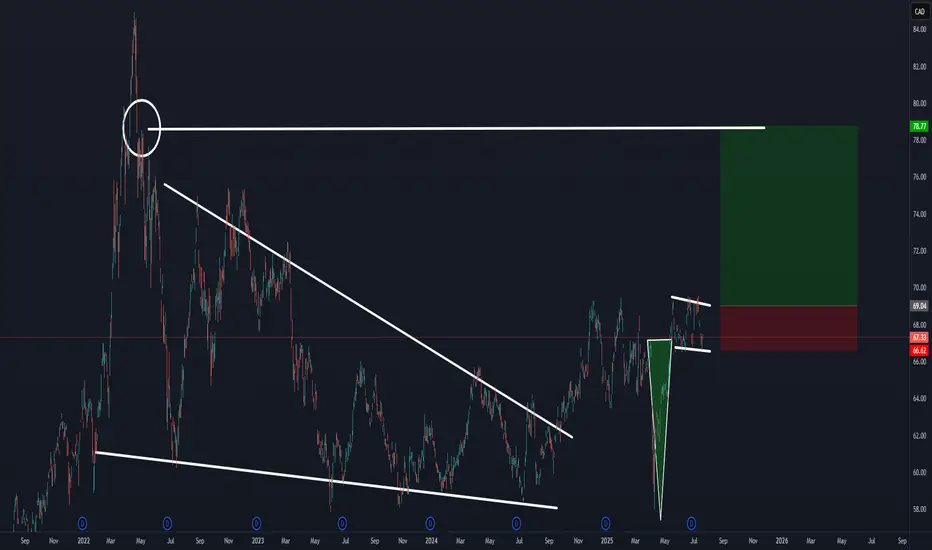
COW : Daily Chart : Multiple Price Action ExamplesThere is a large bull flag.
Then toward its maturation the tweezer pattern forms to confirm the large flag.
Then there is now the Follow-Up after a tweezer which is looking nice.
I would now buy the break higher and follow it up to the left there is green wicks leading the way.
Key stats
About BLACKROCK ASSET MANAGEMENT CA LTD ISHARES GLOBAL AGRICULTURE INDEX ETF
Home page
Inception date
Dec 19, 2007
Structure
Canadian Mutual Fund Trust (ON)
Dividend treatment
Distributes
Distribution tax treatment
Ordinary income
Income tax type
Capital Gains
Primary advisor
BlackRock Asset Management Canada Ltd.
The fund provides exposure to the global agriculture space. The fund holds stocks of companies involved in each phase of commodity production. Such companies include those generating revenue from fertilizers, agricultural chemicals and products, farm machinery and parts, or in packaged food and meats as classified by GICS. The fund includes equities from both developed and emerging markets, with exposure to the whole market cap spectrum. The selection process considers a number of factor rankings, including balance sheet ratios, earnings, growth rates, price momentum, profitability ratios, valuation ratios, and other qualitative factors. An optimizer is used to calculate the appropriate weighting for the underlying holdings. The index is rebalanced quarterly.
Related funds
Classification
What's in the fund
Exposure type
Process Industries
Producer Manufacturing
Consumer Non-Durables
Stock breakdown by region
Top 10 holdings
ABC Zig Zag 5,3,5Correction pattern correction guess, correction correction correction guess, correction pattern, potential pattern guess, test

Agriculture Industry and COWI think, agriculture is a very good industry for investment in future. because its basis on human living and its very necessary for human.
COW has a good chart. in this chart we can see a very good green cloud below the price.
My prediction is when price can cross up 58.13 , it can continue uptrend

See all ideas
Summarizing what the indicators are suggesting.
Oscillators
Neutral
SellBuy
Strong sellStrong buy
Strong sellSellNeutralBuyStrong buy
Oscillators
Neutral
SellBuy
Strong sellStrong buy
Strong sellSellNeutralBuyStrong buy
Summary
Neutral
SellBuy
Strong sellStrong buy
Strong sellSellNeutralBuyStrong buy
Summary
Neutral
SellBuy
Strong sellStrong buy
Strong sellSellNeutralBuyStrong buy
Summary
Neutral
SellBuy
Strong sellStrong buy
Strong sellSellNeutralBuyStrong buy
Moving Averages
Neutral
SellBuy
Strong sellStrong buy
Strong sellSellNeutralBuyStrong buy
Moving Averages
Neutral
SellBuy
Strong sellStrong buy
Strong sellSellNeutralBuyStrong buy
Displays a symbol's price movements over previous years to identify recurring trends.
Frequently Asked Questions
An exchange-traded fund (ETF) is a collection of assets (stocks, bonds, commodities, etc.) that track an underlying index and can be bought on an exchange like individual stocks.
COW trades at 68.49 CAD today, its price has fallen −2.12% in the past 24 hours. Track more dynamics on COW price chart.
COW net asset value is 67.36 today — it's risen 0.03% over the past month. NAV represents the total value of the fund's assets less liabilities and serves as a gauge of the fund's performance.
COW assets under management is 258.03 M CAD. AUM is an important metric as it reflects the fund's size and can serve as a gauge of how successful the fund is in attracting investors, which, in its turn, can influence decision-making.
COW price has fallen by −2.00% over the last month, and its yearly performance shows a 13.73% increase. See more dynamics on COW price chart.
NAV returns, another gauge of an ETF dynamics, have risen by 0.03% over the last month, showed a 5.64% increase in three-month performance and has increased by 8.45% in a year.
NAV returns, another gauge of an ETF dynamics, have risen by 0.03% over the last month, showed a 5.64% increase in three-month performance and has increased by 8.45% in a year.
COW fund flows account for −51.69 M CAD (1 year). Many traders use this metric to get insight into investors' sentiment and evaluate whether it's time to buy or sell the fund.
Since ETFs work like an individual stock, they can be bought and sold on exchanges (e.g. NASDAQ, NYSE, EURONEXT). As it happens with stocks, you need to select a brokerage to access trading. Explore our list of available brokers to find the one to help execute your strategies. Don't forget to do your research before getting to trading. Explore ETFs metrics in our ETF screener to find a reliable opportunity.
COW invests in stocks. See more details in our Analysis section.
COW expense ratio is 0.74%. It's an important metric for helping traders understand the fund's operating costs relative to assets and how expensive it would be to hold the fund.
No, COW isn't leveraged, meaning it doesn't use borrowings or financial derivatives to magnify the performance of the underlying assets or index it follows.
In some ways, ETFs are safe investments, but in a broader sense, they're not safer than any other asset, so it's crucial to analyze a fund before investing. But if your research gives a vague answer, you can always refer to technical analysis.
Today, COW technical analysis shows the strong buy rating and its 1-week rating is strong buy. Since market conditions are prone to changes, it's worth looking a bit further into the future — according to the 1-month rating COW shows the buy signal. See more of COW technicals for a more comprehensive analysis.
Today, COW technical analysis shows the strong buy rating and its 1-week rating is strong buy. Since market conditions are prone to changes, it's worth looking a bit further into the future — according to the 1-month rating COW shows the buy signal. See more of COW technicals for a more comprehensive analysis.
Yes, COW pays dividends to its holders with the dividend yield of 1.99%.
COW trades at a premium (0.23%).
Premium/discount to NAV expresses the difference between the ETF’s price and its NAV value. A positive percentage indicates a premium, meaning the ETF trades at a higher price than the calculated NAV. Conversely, a negative percentage indicates a discount, suggesting the ETF trades at a lower price than NAV.
Premium/discount to NAV expresses the difference between the ETF’s price and its NAV value. A positive percentage indicates a premium, meaning the ETF trades at a higher price than the calculated NAV. Conversely, a negative percentage indicates a discount, suggesting the ETF trades at a lower price than NAV.
COW shares are issued by BlackRock, Inc.
COW follows the Manulife Asset Management Global Agriculture Index - CAD. ETFs usually track some benchmark seeking to replicate its performance and guide asset selection and objectives.
The fund started trading on Dec 19, 2007.
The fund's management style is passive, meaning it's aiming to replicate the performance of the underlying index by holding assets in the same proportions as the index. The goal is to match the index's returns.