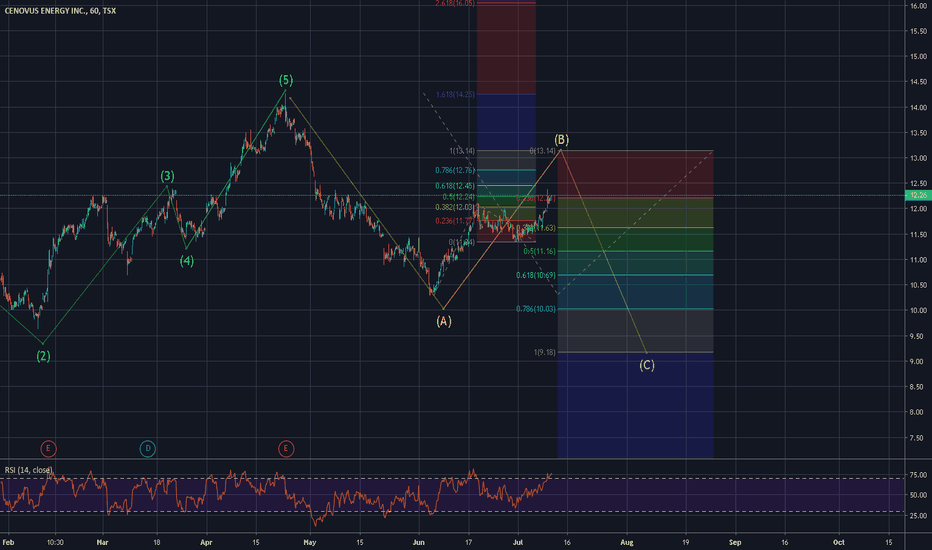
CVE trade ideas
Month of February 2021 - CVE.TOAs we can see the chart, from Feb 1st the price range established in $8 channel.
It is already bounced from the $8.20 toward higher targets, and now getting ready to break through the next resistant poit of $8.80, after that the next target will be $9.98
Timeframe to reach the price target might be by end of Feb to mid March.
Considering the current price of brent oil that is higher than $60, the Q1 report might look better than Q4 of 2020, also Husky deal effect comes to the picture with a better revenue and sale which attracts more money into CVE.
MFI, RSI and CCI on daily chart are in line for a bulish trend!
This is an estimation for a short term investment, for sure long term investors collect more fruits from this stock.
CENOVUS ENERGY Perspective DailyHey people, CENOVUS ENERGY is in a bullish push with a hammer candle shape and a large buy volume issued. On the TIMEFRAME M1 we notice a hammer candle with a large negotiated purchase volume, it bounced off the top of the equilibrium zone. CENOVUS ENERGY will head to last lower which is below the base of the bollinger to reverse the trend. With the retest of the base to finish with the check from the top of the area.
Great possibility of breaking the price with the return of momentum then then the zone to reach the new one and arrival on the top that comes. The high of the bollinger will be broken followed by a breakout of an equilibrium zone with the addition of a bearish breakout gap filling (See TIMEFRAME H4).
And (on the TIMEFRAME H1) an adjustment before outperforming two higher. Propability of attempt to test the intermediate median of ANDREWS PITCHFORK.
Please LIKE & FOLLOW, thank you!
CVE after FDA approval of Covid VaccineThere is a strong pull back on RSI 60, the resistance of $7:40 broke easily, there is a bigger one at $7.80 that supposed to push it back to $7.20, but due to the Covid Vaccine news it should not go lower than $7.40
Belw $9 will be a sell position and rebuy at $6.20
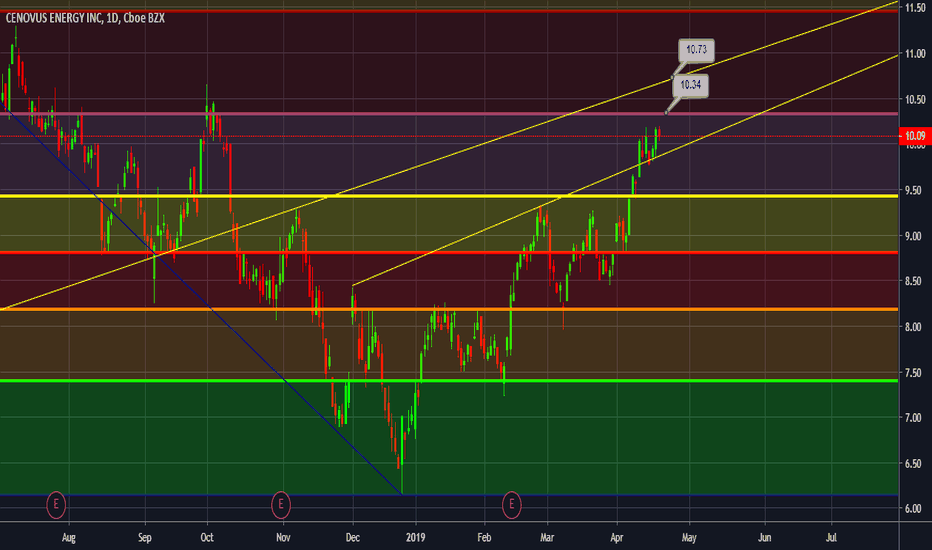
Long option positionThis rally has established a reliable pattern with a sizeable rally after most single down days. As well, it’s rallied after green hammers along the trendline that reliably last 10days four times, then down for between 5 and 8 before another rally.
Current position is 6/21 calls at $10 strike. Cost is .50 per contract. Currently up fifty percent as of 1040am 4/12. Looking to hold this through the next up and down, watching for confirmation. Directly after cashing out this option I’ll look for the green hammer if it bumps the trendline again and likely buy another conservative call at that point. This sector is very much alive right now. If the dollar is strong we'll see good things happen.


