LAC DaytradeUsing the Strat, I've identified a potential reversal on the 4hr time frame.
There's a potential 3-2d-2u bullish reversal and it's also in a buy zone. If the entry point is hit for the put we'd have a continuation (2d - 2d).
If you are not familiar with the Strat and the candle numbers, check out this video .
This is not financial advice. Always do your own DD.
LAC trade ideas

LAC IS FORMING A BULLISH PENNANT IN THE WEEKLY CHARTAfter setting up the new ATH at 36.49 recently, LAC is going through a healthy pullback before the next run up. The weekly chart shows it is forming a bullish pennant with a possible retesting SMA 20 AT 30.20 and the previous ATH at 28 .71 (last January).
It is also forming a trend line support (the bold blue line). If it holds, we can expect a breakout towards $49-50
This is my idea, which could be 100% wrong. Please do your DDs before entering the trade.
Lithium stocks are the fattest pitch in the investment world today.
Lithium is underpinning the biggest energy revolution in history. Simple number crunching makes it impossible to not be long-term bullish on lithium. Globally, there are 1.4 billion cars on the road today. Currently only 10 million of them are electric cars. Electric cars have a rounding error of a rounding error in terms of market share. That is going to change, and it is going to change fast.
Governments across the world have banned the sale of combustion engine vehicles within a decade. All of the major automakers are betting their future on electric vehicles. Lithium stocks including LAC are good investment for long term.
It is a fact that hundreds of millions of electric cars will be hitting the road. All of those cars are going to be using lithium-ion batteries.
Lithium Americas Corp. operates as a resource company in the United States. The company explores for lithium deposits. It owns interests in the Cauchari-Olaroz Project located in Jujuy province of Argentina; and Thacker Pass project located in north-western Nevada. The company was formerly known as Western Lithium USA Corporation and changed its name to Lithium Americas Corp. in March 2016. Lithium Americas Corp. was incorporated in 2007 and is headquartered in Vancouver, Canada.

2021 Actual Trade LAC +56% Profits from uptrend and baseNotice the strong uptrend and short consolidation base

11/7/21 LACLithium Americas Corp. ( NYSE:LAC )
Sector: Consumer Non-Durables (Beverages: Non-Alcoholic)
Current Price: $32.67
Breakout price trigger: $30.00 (hold above)
Buy Zone (Top/Bottom Range): $31.80-$28.00
Price Target: $39.20-$41.00 (1st)
Estimated Duration to Target: 33-37d (1st)
Contract of Interest: $LAC 12/17/21 40c, $LAC 2/18/22 40c
Trade price as of publish date: $1.45/contract, $3.00/contract

LAC: Ascending Triangle (92%) Cup'n Handle (50%)Update on LAC confirmed ascending triangle on the daily chart. Price target on daily chart is still 49$.
Added a confirmed Cup'n handle graph on the weekly showing a possible target price of 36.40$ (Top right graph).
Caution: The S&P Material sector is running into resistance (551.50$) on the Weekly chart (Bottom right graph). If the sector can break through this resistance, LAC will have a better chance of hitting both daily and weekly targets. If the sector does not break through resistance, LAC could reverse and go lower.
Stay humble, have fun, make money!


LAC: Ascending Triangle (93%), WeeklyThis lithium ressource stock, like many energy and ressource stocks, is building into a pretty nice ascending triangle on the weekly chart.
Not confirmed yer but may confirm next week.
If confirmed:
Price Target = 49.09$
Stay humble, have fun, make money!

$LAC Cup and Handle trade continuationWe had a nice run from 13$ on a previous trade here on LAC, but with the bullish engulfing confirmation here today and the cup and handle structure implying a measured move of $37, i think we might have another move on our hands here. Eventually.

Break over the 30 Week Moving Average. Arc its way up to $28If the Arc holds true, possible $28 by 2022 NYSE:LAC

LAC It seems LAC has formed a cup and handle pattern. I like to buy it around 26 with a stop loss at 24.5. my tp is 28.


$LAC Textbook Cup & HandleI'm long here. Breakout retest with nice bullish confirm so far...
Given $24.5 holds, calculated move to upside $30 PT . Earnings upcoming could send it. Let's see how price action looks next week. Lithium, EV, Uranium, precious metals all in for a Q4 run it looks like.
Regardless, from a technical perspective this is text book Cup and Handle and I'm excited to see if chart plays out :)

Updated LAC AnalysisLAC is continuing to hold its rising wedge pattern. It looks like sometime in the next 1-2 weeks it will break to the downside and probably touch the 25 DMA.
Options are limited for LAC, but I'll be purchasing OCT15 $22.5 Puts when the price starts to get crunched at the top of the wedge. I'm predicting around +125% profit on these options and my confidence level is high: any rising wedge pattern generally has a 2/3 chance of breaking downward, but the RSI and volume divergences along with the lithium price rally that has been the main reason behind this last month's price action cooling off all point toward a clear correction.
I guess we'll see.

LAC UpdateIf you stayed in this one with me - congrats! I am out as of now. This was a great run, great company, everything about this stock screams to the moon but I can always rebuy it on the red.
Knowing what you own makes it a lot easier holding it through the chopper.


LAC targetsLAC has been printing a very bullish pattern in the chart
Like in my previous post, it forms a double bottom and expected to hit $25 - which now is almost hitting. The daily candles has bene bullish and it's expected to break the resistance at $25. So what's next? being bullish on this stock, the next target is $37.How do I arrive at this price?
Usually it takes time for the chart to take a more reassuring pattern. Now it's actually forming a rounding bottom, it's might do a parabolic upward trend in price. For a rounding bottom, usually I will take the lowest and the highest price of the round bottom, and using exactly the similar percentage of gains of that to estimate the next target price.
The RSI looks really bullish and the volume is increasing. If it fails to surpass the resistance, it might retrace to $20 and begin its upward movement.

$LAC Lithium Americas ATH Trade Hopefully you find the chart helpful in terms of Supports & Resistance etc.
we refrain from adding commentary on the chart as that is reserved for our members and we are very conscious of not giving financial or trading advice.
Thank you for taking time to consult our chart and we would really appreciate a like, follow or comment.

A Pullback for LAC Is LikelyLAC is likely to revert to the 25 daily moving average for the following reasons:
1. The stock has gained nearly 40% in the last month with no major correction. Even though it has largely been mirroring the rise in Lithium futures, this rate of growth is unsustainable.
2. The daily price chart shows a very clear rising wedge pattern accompanied by both volume and RSI bearish divergence.
3. Aside from any TA patterns, the RSI has been hovering around 70 for the last couple of weeks which signals the stock is overbought.
4. The max pain price is roughly $17.50 for both Sept 17 and Oct 15 options which would suggest a correction will happen soon. In the rising wedge pattern, there isn't much time left.
My position is PUT options on Oct 15th at the 22.5$ pricepoint (marked by the red line).

$LAC Lithium Americas Corp Outperformance Continues.
Hopefully you find the chart helpful in terms of Supports & Resistance etc.
we refrain from adding commentary on the chart as that is reserved for our members and we are very conscious of not giving financial or trading advice.
Thank you for taking time to consult our chart and we would really appreciate a like, follow or comment.

ABC BullishPrice is outside the top bollinger band set on an 80 SMA verse 20. This exhibits extreme buying pressure and often overbought status. Price eventually returns to the bands as a rule.
ABC bullish. Possible stop under C or last pivot low. ABC is a common corrective pattern and the target is D.
Golden cross when the 50 SMA crossed up and through the 200 SMA. Looks like a cup is trying to form.
No recommendation.
Negative volume is high showing smart money interest. I am not sure they are smarter than we are, LOL, but you know what I mean.
A lot of momentum at this time. Long entry level can be crucial, and more so if a swing trade or a longer term investment. Having a plan for each trade can be important. If you do not have a plan, then what on earth do you do when things do not go your way? (o:

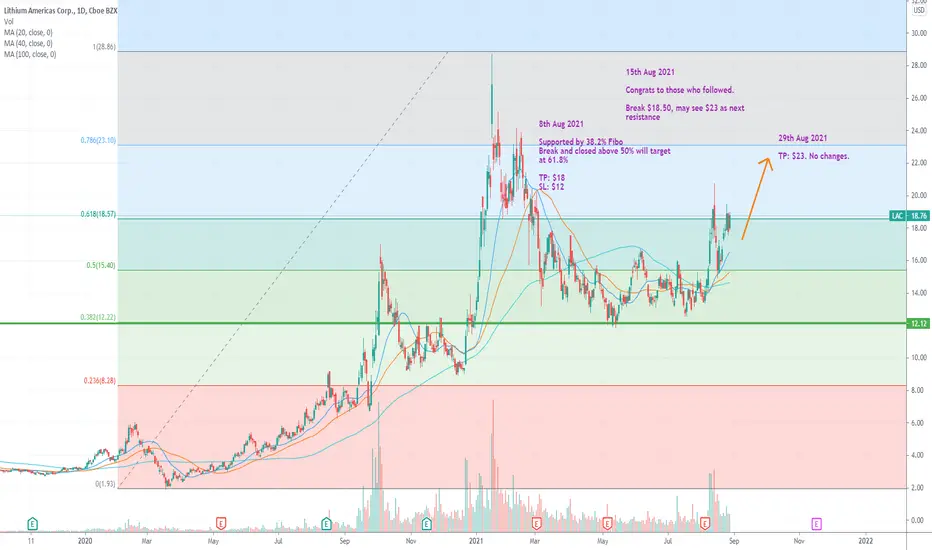
Bullish bias after pullback to 50% fiboPrice pull back to 50% fibo since hitting our first TP previously.
We are eying at $23 the next resistance level.
Continue to hold bullish
A clear Wyckoff accumulation Previously I have covered the target price of LAC at $20. Congratulations whoever who made some money from it.
Now the price is testing the support and seems like it's bouncing off from the support.
Weekly MACD crossed
Bullish divergence of RSI
I have reason to believe it will go to $25 from here. But it has to break the $20 resistance first

