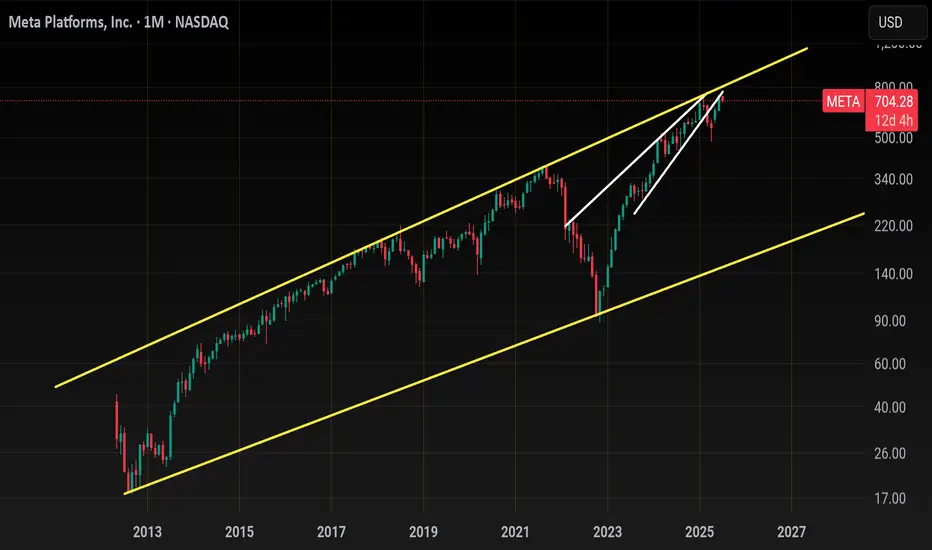
Meta .. (Where we stand)Long term, I think this stock is headed back to 300-400...
Short term I think it's a high chance we see 740-800...
Let me explain
Back in Feb we tagged our long term resistance, corrected and then we retested it with a lower high on the RSI (Bearish divergence) that you can see on the monthly
36.70 CAD
85.43 B CAD
225.36 B CAD
About Meta Platforms
Sector
Industry
CEO
Mark Elliot Zuckerberg
Website
Headquarters
Menlo Park
Founded
2004
FIGI
BBG012TB6JY3
Meta Platforms, Inc. engages in the development of social media applications. It builds technology that helps people connect and share, find communities, and grow businesses. It operates through the Family of Apps (FoA) and Reality Labs (RL) segments. The FoA segment consists of Facebook, Instagram, Messenger, WhatsApp, and other services. The RL segment includes augmented, mixed and virtual reality related consumer hardware, software, and content. The company was founded by Mark Elliot Zuckerberg, Dustin Moskovitz, Chris R. Hughes, Andrew McCollum, and Eduardo P. Saverin on February 4, 2004, and is headquartered in Menlo Park, CA.
Related stocks
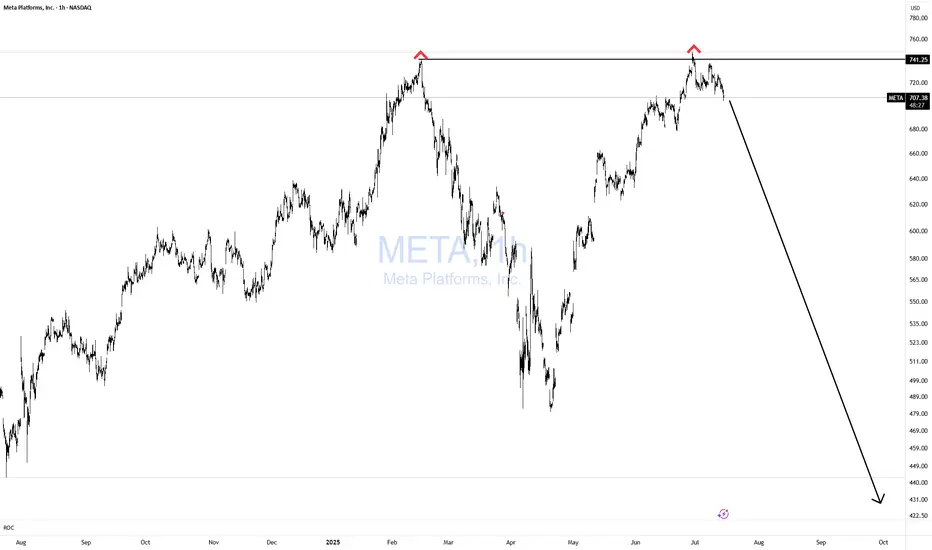
META Double Topping!Does it get any easier than this? NOPE!
If you can't spot this pattern from 1000 miles away, then you need a lot more time in the seat, training yourself in TA.
Simple with great risk reward!
Bulls GTFO!
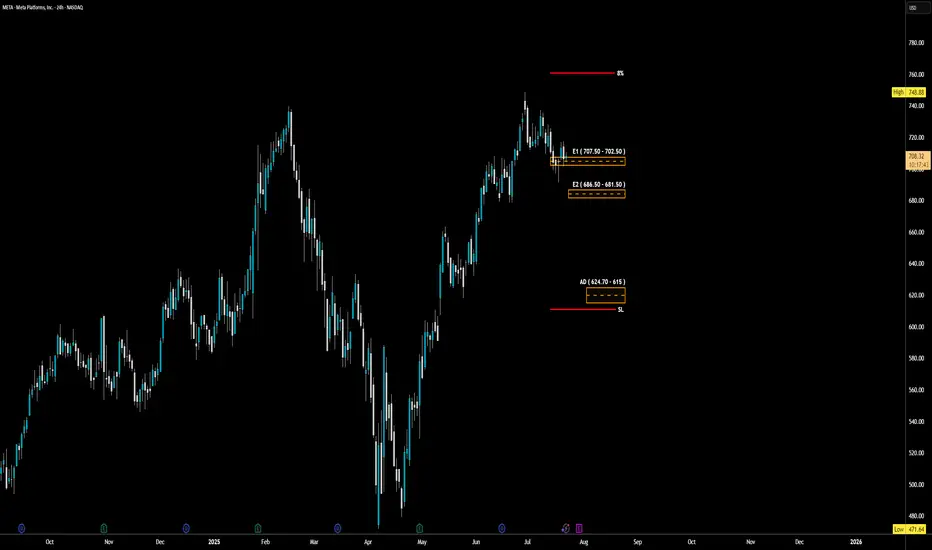
META - LONG Swing Entry PlanNASDAQ:META - LONG Swing Entry Plan
Entry Zone 1: $707.50 – $702.50
→ Open initial position targeting +8% from entry level.
Entry Zone 2: $686.50 – $681.50
→ If price dips further, average down with a second equal-sized entry.
→ New target becomes +8% from the average of Entry 1 and Entry 2.
Edi
META CANT KEEP THE HULK DOWN!!!!META has been consolidating for a few weeks now, but it's still in this bull flag that looks like it might break out soon, hopefully before earnings on Wednesday, July 30. I love technical analysis on charts, and this inverse head and shoulders pattern has been effective on most semiconductor names

New Setup: METAMeta is now setting up for a potential bounce now. If the Markets can be positive tomorrow, we should see Meta also participate.

Stocks SPOT ACCOUNT: META Shares Buy Trade with Take ProfitStocks SPOT ACCOUNT:
NASDAQ:META shares: my buy trade with take profit.
This is my SPOT Accounts for Stocks Portfolio.
Trade shows my Buying and Take Profit Level.
Spot account doesn't need SL because its stocks buying account.
Looks good Trade.
Disclaimer: only idea, not advice

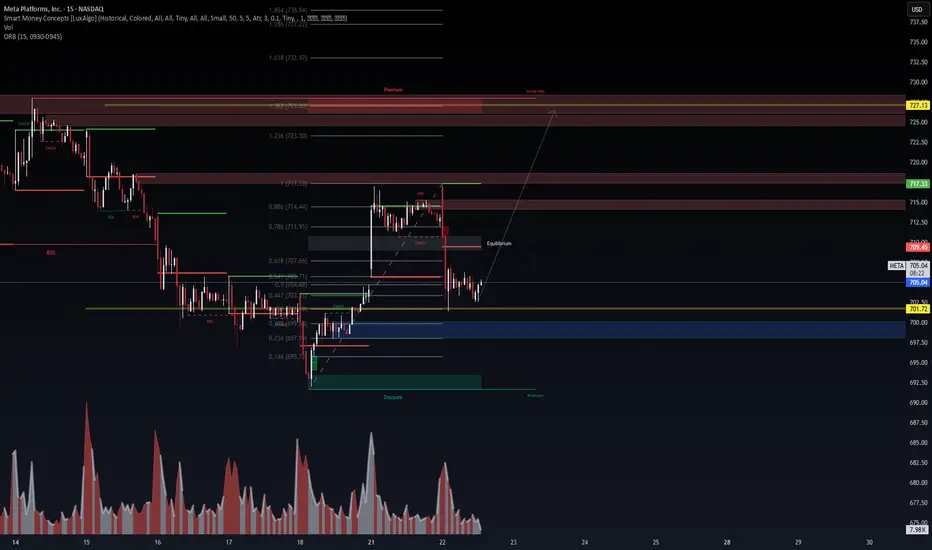
META: That weird drop looks like it was planned :P📊 META (15M) | Smart Money Concepts Setup
🔍 Powered by VolanX Protocol | WaverVanir International LLC
META is showing signs of reclaiming equilibrium after a clear CHoCH -> BOS -> EQH sweep. Price tapped into a premium inefficiency zone and is now consolidating at the equilibrium of the latest impu
META Bearish Swing Alert – Bear in Hiding? Watch for Breakdown B
🔻 NASDAQ:META Bearish Swing Alert – Bear in Hiding? Watch for Breakdown Below $690 🐻
📅 Posted: July 18, 2025
💡 All models say “bearish,” but volume is the wildcard. Tight play, big potential.
⸻
🧠 AI Consensus Summary: Bearish But Not Triggered
Model Bias Key Notes
Grok 🐻 Bearish RSI 40.5, wea
Meta - The breakout in question?🪓Meta ( NASDAQ:META ) is retesting major structure:
🔎Analysis summary:
After Meta perfectly retested a major previous support trendline in 2022, the trend shifted bullish. We have been witnessing an incredible rally of about +700% with a current retest of the previous all time highs. Time wil

7/3/25 - $meta - Still a buy sub $1k/shr7/3/25 :: VROCKSTAR :: NASDAQ:META
Still a buy sub $1k/shr
- reality is, why would you bet against zuck
- his platforms are hitting on all strides. he is willing to internally build the best AI when he's falling behind by hiring the best talent and it is a LOT cheaper to hire for collectively $50

See all ideas
Summarizing what the indicators are suggesting.
Oscillators
Neutral
SellBuy
Strong sellStrong buy
Strong sellSellNeutralBuyStrong buy
Oscillators
Neutral
SellBuy
Strong sellStrong buy
Strong sellSellNeutralBuyStrong buy
Summary
Neutral
SellBuy
Strong sellStrong buy
Strong sellSellNeutralBuyStrong buy
Summary
Neutral
SellBuy
Strong sellStrong buy
Strong sellSellNeutralBuyStrong buy
Summary
Neutral
SellBuy
Strong sellStrong buy
Strong sellSellNeutralBuyStrong buy
Moving Averages
Neutral
SellBuy
Strong sellStrong buy
Strong sellSellNeutralBuyStrong buy
Moving Averages
Neutral
SellBuy
Strong sellStrong buy
Strong sellSellNeutralBuyStrong buy
Displays a symbol's price movements over previous years to identify recurring trends.
US30303M8D7
META PLATF. 22/32 144AYield to maturity
16.27%
Maturity date
Aug 15, 2032
FB5458295
Meta Platforms, Inc. 4.65% 15-AUG-2062Yield to maturity
6.31%
Maturity date
Aug 15, 2062
FB5522241
Meta Platforms, Inc. 4.65% 15-AUG-2062Yield to maturity
6.11%
Maturity date
Aug 15, 2062
FB5458293
Meta Platforms, Inc. 4.45% 15-AUG-2052Yield to maturity
6.11%
Maturity date
Aug 15, 2052
FB5522214
Meta Platforms, Inc. 4.45% 15-AUG-2052Yield to maturity
6.05%
Maturity date
Aug 15, 2052
FB5868810
Meta Platforms, Inc. 5.55% 15-AUG-2064Yield to maturity
5.83%
Maturity date
Aug 15, 2064
FB5581331
Meta Platforms, Inc. 5.75% 15-MAY-2063Yield to maturity
5.77%
Maturity date
May 15, 2063
FB5868809
Meta Platforms, Inc. 5.4% 15-AUG-2054Yield to maturity
5.72%
Maturity date
Aug 15, 2054
FB5581330
Meta Platforms, Inc. 5.6% 15-MAY-2053Yield to maturity
5.70%
Maturity date
May 15, 2053
FB5458289
Meta Platforms, Inc. 3.5% 15-AUG-2027Yield to maturity
5.28%
Maturity date
Aug 15, 2027
FB5458291
Meta Platforms, Inc. 3.85% 15-AUG-2032Yield to maturity
5.23%
Maturity date
Aug 15, 2032
See all META bonds
Curated watchlists where META is featured.

Big software stocks: Red pill gains
9 No. of Symbols


Political stocks: The corridors of power
15 No. of Symbols
See all sparks