MSFT Bullish Continuation out of a Cup and Handle LONGMSFT on the daily chart shows the price action in the bull run out of the Covid lows then a
cup and handle pattern is printed and finally bullish continuation above the level of the cup.
Since the cup has a height of $145 and the level of the lip of the cup is $345, the pattern
forecasts bullish continuation for $ 145 above the cup's lip at $ 345 and so targeting $ 480.
I will continue to add to my MSFT position while watching for pivot lows on the 120-240 minute
charts. MSFT is a major player in the AI space and could even launch its own semi-conductor
division to compete with NVDA and the others. It has a healthy balance sheet and free flowing
cash from which to grow without dependence on interest rates coming down. The RSI indicator
shows consistent strength without signs of being overbought.
MSFT trade ideas

Ressistance And RSI"Microsoft (MSFT) stock: Predicting the current candlestick's price for profit-taking analysis can be done by analyzing the price signals it sends."

$MSFT - Upwards & Onwards. #MAG7: 2024 OUTLOOK NASDAQ:MSFT : Upwards and Onwards. #MAG7
Longer-term time frame perspective. As you can see from the technicals, we have a cup-and-handle ☕, which indicates bullish momentum may continue into next year!
Support: $350
Resistance: $380
With a break above the resistance zone close, I expect the next green zone targets to be hit over time. This case would not be valid if we went below support.
The MAG7 performance this year has been outstanding due to the AI boom. That is set to continue into next year, but remember, Microsoft isn't the only one with a ChatGPT investment... There are many competitions, such as with GOOG and Gemini.
Something to keep in mind is the legal aspect of AI and how that will affect companies going forward. It's a wonderful development, but the legal aspect is equally important
Key Tip: “The goal of a successful trader is to make the best trades. Money is secondary." 🧠
The majority of those who want to embark on trading as a side investment or even as a career lack the mindset and want to get rich quick. By investing or trading in that manner, you will lose your capital.
Have an amazing year ahead,
🍾 Trade Journal | Empowering Your Trading Journey 🍾

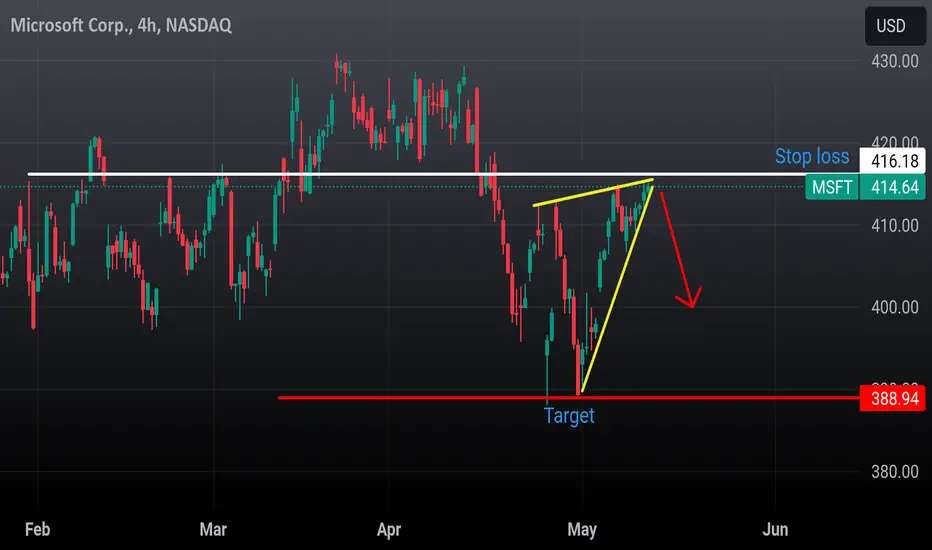
MSFT: Rising Wedge ( Short Term)/ Date: 26.05.24Key Points: NASDAQ:MSFT
1. A raising wedge pattern is used to identify possible trend reversals.
2. It is considered a bearish pattern.
3. It signals that the buying momentum is slowing down.
Support/ Resistance:
4. Around 430 - may act as a resistance.
5. Around 416 - may act as a support
Notice :
looking for a job
------------------------
Is Your company hiring an assistant day & swing Trader/ assistant technical analyst/ assistant equity analyst?
I am a day & swing trader, freelancer technical analyst & equity analyst. Now, I am looking for a job .
Skills: Chart analysis, Trend identification, Price pattern recognition, important support and resistance levels identification,
Set up trade idea ( long /short),
Set up entry and target price.
Valuation, making analysis report etc...
Experience: 5 years.

The trend is your friend
A commentary using NASDAQ:MSFT chart
A multi-timeframe momentum indicator of MSFT is shown. As the arcs demonstrate, each time the + and - angles diverge, a strong trend ensues, and lasts until the angles begin to converge. This method highlights the value of segregating price action into its sub components.
This momentum oscillator is created by aggregating the harmonic mean of multiple timeframes ranging from 1 day to 3 weeks. Smoothing is then applied to ensure the indicator gives clear smooth signals whilst minimizing lag.
"Flat" signals are ignored. As a rule, angle must be at least +/- 35 degress in the direction of the trade for an entry to be considered. Volume and cycle analysis (not shown) acts as secondary filters .
Based on experimentation and given the nuances of pinescript, overlaying the results on a 2 day chart gives the best visual representation.

What do you think about MSFTHello everyone
The biggest monster in the Nasdaq is tiered or it was just a correction and then it continues to its rally.
No one knows but it not important because Elliotticians can surf on the waves and we give enough time to MSFT to disclose this secret for us.
We Elliotticians have a key factor and it is the difference between Impulses and Correction. What is readily clear for now is that Microsoft investors are not yet interested to make a bearish impulse trend and this can be a clue that we are not in the end of a Bullish trend but as I said no one can know till the chart shows us the reality.
I recommend not to enter any position and just take time and count it to find it that we are in a bearish main correction or it will continue.
Thanks

$MSFT earnings? Could we see another drop to $370?NASDAQ:META had a negative reaction to earnings yesterday. I was originally thinking that MSFT's earning reaction would be positive but as I look at the chart and options flows, I'm starting to think we're going to see a negative reaction.
I think most likely outcome is that we drop from here to around the $370 level, if that level can hold there's potential for one more rally into May to the $454 level. Otherwise if it can't, we risk seeing more downside to the lower levels.
Let's see what happens after the market closes.

MSFT unstopableMSFT is still on tred, could break that white trend line for a healthy pull back.
Now wave 3 could have ended, but maybe could extend to fib extension 200%-261.8%. If not, then wave 5 will be an extension. if this is the case we have to wait the end of wave 4 to estimate the final target. However, I am keeping a target of 480.

MSFT, morning updateMy count has MSFT in wave 5 of (3) of ((5)). I'm looking for price to move towards, but not go above, 510.47. Once wave 5 is complete (which could be at any point now that MSFT has higher high on the monthly), I expect price to pull back towards 380 region for wave (4) of ((5)).

Microsoft unveils AI-powered Copilot+ PCs with Qualcomm chipsOn 20 May, Microsoft Corp. (MSFT) hosted a private product presentation , a precursor to the official Microsoft Build 2024 developer conference. The highlight of this event was the unveiling of the Copilot+ PCs, a new category of personal computers. These PCs are distinguished by their embedded neural processing units (NPUs), designed to enable artificial generative intelligence operations directly on the devices without an internet connection.
The performance specifications for the new Surface Laptop and Surface Pro, powered by Qualcomm chips, are particularly notable. Microsoft reports that the Surface Laptop is 23% more productive than the M3-based Apple MacBook Air under peak loads in multi-threaded tasks. Additionally, the Qualcomm chips render the Surface Laptop 58% faster in AI-driven tasks than its Apple counterpart.
Exploring investment opportunities, let's analyse the technical chart of Microsoft Corp. (NASDAQ: MSFT):
On the Daily (D1) timeframe, Microsoft's stock has recently broken through a resistance level at 424.00 USD, with new support forming at 418.00 USD. Following a recent corrective dip, the stock has entered an uptrend, suggesting room for further price increases. A downside target could be around 410.00 USD if there is a trend reversal.
A short-term buying target could be 448.00 USD if the uptrend persists. A medium-term investment price target could be 470.00 USD as the positive momentum continues.
—
Ideas and other content presented on this page should not be considered as guidance for trading or an investment advice. RoboMarkets bears no responsibility for trading results based on trading opinions described in these analytical reviews.
The material presented and the information contained herein is for information purposes only and in no way should be considered as the provision of investment advice for the purposes of Investment Firms Law L. 87(I)/2017 of the Republic of Cyprus or any other form of personal advice or recommendation, which relates to certain types of transactions with certain types of financial instruments.
Risk Warning: CFDs are complex instruments and come with a high risk of losing money rapidly due to leverage. 69.88% of retail investor accounts lose money when trading CFDs with this provider. You should consider whether you understand how CFDs work and whether you can afford to take the high risk of losing your money.

What Does FOMO Mean in Trading?What Does FOMO Mean in Trading?
FOMO, or the fear of missing out, is a common emotion that traders experience. It is more than just an internet slang term. This powerful phenomenon can have a negative impact on trading decisions, leading to impulsive actions and poor risk management. This FXOpen article explores the psychology of FOMO, discusses how to identify it in trading, and shares strategies you may use to overcome it.
FOMO: What Does It Mean?
FOMO meaning in trading can be explained as follows: it is the psychological need for validation and the fear of being left behind. It can stem from various feelings and emotions, including greed, jealousy, and impatience.
The Social Proof
When traders see others making quick profits or getting on the next big trend, they often feel compelled to jump in as well. From newsworthy events to something as simple as a conversation with another trader, there are many things that can kick off a bout of FOMO.
This phenomenon is closely tied to social proof, where people look to others for guidance, especially in uncertain situations. People tend to follow the actions of others to conform to social norms. Traders who give in to FOMO are essentially following the crowd without fully understanding the risks involved.
The Fear of Regret
The fear of regret is another force behind FOMO. Traders worry that if they miss out on a potentially profitable trade, they’ll regret it later. This fear can cloud their judgement and lead to hasty decisions. It can be amplified by social media and trading forums, where traders may see others boasting about their profits and feel pressure to keep up.
It’s important to remember that hindsight bias often magnifies the perception of missed opportunities, making the fear of regret an even more significant driving force behind impulsive trading actions.
Real-Life Examples
Emotions have influenced market behaviour in many real-life situations. FOMO in the stock market is very typical. For example, during the dot-com bubble of the late 1990s, investors rushed to buy stocks from the technology sector, driving up prices to unsustainable levels.
Similarly, during the GameStop short squeeze of 2021, retail traders on Reddit’s Wallstreetbets forum drove up the price of the stock. As a result of this situation, GameStop stock rose nearly 2,000% in less than a month. And then, it all came crashing down, leading to significant losses for some investors.
The cryptocurrency* market has witnessed countless FOMO-induced rallies when many invested in highly speculative assets without proper due diligence. A classic example is the sharp rise of Bitcoin in 2017. When the price soared, the fear of missing out on the benefits gripped many, leading to a buying frenzy, and shortly thereafter, prices plummeted.
Identifying FOMO in Trading
A FOMO trader’s experience looks like this:
A trader hears news of astounding profits or very attractive opportunities.
Greed and excitement encourage them to buy overpriced assets as much as possible.
When the prices fall, fear or even anxiety forces the trader to sell at a loss.
The trader becomes impatient, and the cycle repeats.
To avoid falling into this trap and losing money on ill-considered purchases and sales, it is essential to understand when FOMO appears in decision-making. This can be done by assessing the key features of behaviour associated with this emotion. Common signs include:
Making impulsive trades without proper analysis or risk management.
Following the crowd and making decisions based on what others are doing.
Feeling anxious or stressed about missing out on opportunities.
Overtrading or taking on too much risk in an attempt to catch up.
Self-awareness is key to recognising FOMO-driven actions. Traders take the time to reflect on their motivations before making any trading decisions. If you feel like you need to take a “now or never” action, have a break, write down the idea and emotion in a notebook, and try to use techniques to control your emotions. If, after that, the desire to buy or sell the asset remains and can be logically explained, do it.
Fear can appear in trading any asset; for example, there is FOMO in forex, in stock trading, FOMO in commodities, and more. It doesn’t apply to only one type of trading. To avoid it, you need to analyse the market thoroughly and plan your actions. This is where the TickTrader platform can help you. There, users can find the most advanced analysis tools and charts free of charge.
The Consequences of FOMO
Succumbing to FOMO can have significant negative consequences. Traders who act on FOMO may make decisions that are not based on sound analysis, leading to poor performance over time. Let’s consider the main consequences.
Traders who act on FOMO tend to make more trades than necessary, resulting in higher transaction costs and increased exposure to market risks.
FOMO often leads to neglecting risk management strategies. Traders may avoid setting stop-loss orders or ignore position sizing rules, which can amplify the impact of losses when they occur.
FOMO-driven decisions can lead to buying at inflated prices and selling at rock bottom, eroding capital and diminishing confidence.
How to Overcome FOMO
Now that you know FOMO meaning on the stock and forex market, let’s find out how to deal with it. To overcome FOMO, traders can:
Have a well-designed trading plan. Develop a clear and comprehensive trading plan that outlines your strategies, risk tolerance, and position sizing.
Avoid making impulsive trades based on social proof or fear of regret.
Practise self-awareness and reflect on emotions and motivations before making any trading decisions.
Use risk management techniques to limit losses. Set stop-loss orders and limit your position sizes to protect your capital.
It’s important to remember that FOMO affects traders of all levels and can be difficult to overcome. However, with practice and discipline, traders can learn to manage their emotions and make more rational decisions.
Final Thoughts
FOMO is a common emotion that traders experience, but it can have a negative impact on results. The consequences of FOMO emphasise the need for self-reflection. By using risk management techniques, traders can overcome FOMO and make more rational decisions. Remember, trading is a marathon, not a sprint, so you need time, discipline, and consistency.
With this knowledge, you can open an FXOpen account and start your journey. And if you want to learn more about the psychology of traders, study our blog. There, we’ve collected everything you need.
*At FXOpen UK and FXOpen AU, Cryptocurrency CFDs are only available for trading by those clients categorised as Professional clients under FCA Rules and Professional clients under ASIC Rules, respectively. They are not available for trading by Retail clients.
This article represents the opinion of the Companies operating under the FXOpen brand only. It is not to be construed as an offer, solicitation, or recommendation with respect to products and services provided by the Companies operating under the FXOpen brand, nor is it to be considered financial advice.

MicroSoft Takes Another Turn With Move to Bring ‘Call of Duty" Microsoft's gaming strategy has taken a significant turn with the reported move to bring Call of Duty to Xbox Game Pass. The Wall Street Journal reported that Microsoft ( NASDAQ:MSFT ) plans to debut 2024's new Call of Duty at next month's Xbox Games Showcase, alongside the announcement that it will be available on Game Pass on its launch day. Microsoft's bet seems to be that Call of Duty on its Game Pass subscription service will spur a new wave of interest in both the service and the Xbox as a platform.
While rumors persist that Microsoft ( NASDAQ:MSFT ) will raise the price or add new tiers to Game Pass in the near future, it would still let a single person play the new Call of Duty for a couple of months for less than the $70 cost of the base game. This could cannibalize the game's overall sales, particularly on the Xbox platform. In theory, this could authoritatively confirm or deny Microsoft's portrayal of the Game Pass service as a "discovery engine," where players frequently try games before they buy them. This could bring in a new wave of interest from people who might otherwise never have tried a new Call of Duty or might give a few million casual players an excuse to not buy this year's edition of the game.
As we learned last summer during Microsoft's court battle with the FTC over its Activision acquisition, Call of Duty by itself makes up a non-trivial amount of the video game audience. If Microsoft had simply decided to make Call of Duty a console exclusive on Xbox, it would have pulled roughly 7 million players away from Sony's PlayStation 4 and 5 systems. Instead, the reported plan is to let the game stay cross-platform, but to use it to drive Game Pass subscriptions.
The Call of Duty gamble, if it happens, would be the latest in a series of recent Xbox controversies. Microsoft's gaming arm was in good shape at the start of the year, with Xbox topped Windows in revenue for the first time, and its major competitors on console didn't have much left in the tank. Microsoft then announced earlier this month that it would shutter several of its studios, all of which were subsidiaries of Bethesda Softworks. This was the latest in a series of layoffs and shutdowns that has ravaged the international video game industry for the last 18 months, including 1,900 lost jobs at Xbox in January.
It's unlikely that next month's Showcase and the attendant Call of Duty reveals are a make-or-break moment for the Xbox project overall. Instead, it's more likely that Call of Duty on Game Pass will be a final test for Xbox's current operational strategy. If this falls through, the next move is a big executive shakeup, followed by a series of new initiatives. The upcoming year will either vindicate or vilify Spencer's time as head of Xbox, which could either take Call of Duty down a peg or lock it in place as the most valuable IP in the modern games industry.

MSFT - How and why I caught this 20 R:R tradeMSFT has been so predictable and pleasant to trade recently.
Stay Tuned!
Happy Trading :)
- TradereDaddyOG

[mid-term] MSFT Price Prediction :20% profit expect MSFT Price Prediction
Welcome to this updated analysis on MSFT
Let’s get right to it!
This information is to be used for educational purposes only
TRANSPARENCY Strategy

MSFT - A tapered progressionTrying my best to explain what I see - when you start to see it it will all start to make sense and you will never look at the market the same
Happy to answer any questions as always!
Happy Trading :)
- TradeDaddyOG

Billiam Yates (TGR - pt.3)I've made good profit playing MSFT calls over the past year. But now I'm seeing evidence that a major top is in, and there will be some explosive downside near/mid term.
Sell zone is 410-420 (so if it goes to 420 I'll take that as a gift to load June puts). Expecting the reversal to the downside to begin by May 10th.
Target 1 = 399 by 5/17
Target 2 = 390 by 5/31
This is setting up for further downside to 380s at least, probably a lot lower.
~Sincerely
Willy G.

Get confirmationIt seems that with risk management, you can enter a sell position with a target of $358 and a S.L of $432

MSFT - Back at it with analysis and trade opportunitiesWas away for a few weeks and surely missed out on many good opportunities. I had swing positions on a lot of things but am now back to being on the charts.
Here is analysis on MSFT which we can see signs of tapering forming and also a slight potential bullish indication through one of our algo tricks.
Happy Trading :)
- TraderDaddyOG

MSFT Bear pennant here. Looking for a move to close gap a 390 in the next 2weeks.!
Larger picture is a correction through a rising wedge (See link)..
That correction is still on going and i think Msft will retest 366 before this fall via H&S
XLK sector also at resistance here.. Overbought and set for a pullback
Stop losses set at 417
MICROSOFT MOMENTUM IS AT APEX = 0 ACCELERATION TO UPSIDEVelocity vectors defined, long squeeze imminent. Load your shorts bois, we're going down swinging ;)
Love,
dysonring2050

Last High For A Long Time Coming...Looks like we're on the last leg here of this impulsive move and we will probably top out later this year to complete our 5 waves and after that it will be a multi year bear market...maybe much longer.


A channel, inside a channel, inside another channel.The smallest channel will most likely break to the upside. Ultimately we’re going to hit the mid-point of the largest channel. Or hit the low end.
