Potential Bullish Cup & Handle!☕ NASDAQ:SSRM Update – Potential Bullish Cup & Handle! 🚀
👀 NASDAQ:SSRM appears to be forming a potential Cup and Handle pattern, which is typically bullish.
🔑 Keep an eye on the development of the handle and watch for a potential breakout above the resistance level of the cup.
SSRM trade ideas

SSR Mining Inc. (SSRM) trade ideaSSRM is nearing a key resistance point, highlighted by a horizontal breakout formation following a steady upward trend. A breakout above this level, with rising volume, could indicate further bullish momentum. Keeping an eye on momentum indicators and the stock’s positioning relative to the 50-day and 200-day moving averages will be critical for validating the breakout.

SSR.ASX Down -70% of Late.SSR Mining has suffered and been Punished by the Markets for these reasons.
Recovery Trades are inherently very Risky, but if successful can offer great Returns.
I'm keeping an Eye on this Ticker and looking for a Reversal.
I will call this one LONG should we see a Reversal.
As always, please get a few outside Expert's Advice before taking Trade or Investment decisions.
Should you appreciate my Chart Studies, Smash That Rocket Boost Button. It's Just a Click away.
Regards Graham.

Bullish engulfing candleSSR Mining Inc. is a leading, free cash flow focused gold company with four producing operations located in the USA, Türkiye, Canada, and Argentina. They produce over 700,000 oz of gold a year.
Friday had a bullish engulfing candle
I see a target price of $14.30 , where there is resistance.
War news again this weekend will push oil and gold up again.
Good luck traders

SSRM: Interesting valuation and chartSSR Mining has a very interesting setup here, both a quarterly and also a daily signal warrant a long entry here. If the quarterly signal pans out, initially we'd target $16.50 by Q4 2020, but eventually, this could make price trigger further quarterly confirmation for bulls, potentially pushing price to even higher levels, circa 28.31.
Free cash flow is an important metric in the mining business, and in the case of $SSRM, it is at a very healthy levels relative to the market cap. This allows them to have sufficient leeway to pay workers (and avoid the problems with the work force South African miners had recently, for instance), expand into new projects and maintain their currently exploited mines, among others.
Going back to the technicals at play, the current correction in the daily timeframe and reaction to quarterly support paves the way for a very high reward to risk long trade. There's a few different ways to decide on a stop loss distance and position sizing, but in general, for equities I try to give them enough room for the trade idea to pan out favorably, before being forced to bail on a trade or being stopped out prematurely.
Best of luck,
Ivan Labrie.

SSRM could benefit from gold rushSSR Mining Inc., together with its subsidiaries, engages in the acquisition, exploration, development, and operation of precious metal resource properties in Turkey and the Americas. The company explores for gold, silver, copper, lead, and zinc deposits. Its projects include the Copler Gold mine located in Erzincan province, Turkey; the Marigold mine located in Nevada, the United States; the Seabee Gold Operation located in Saskatchewan, Canada; and the Puna Operations in Jujuy province, Argentina. The company was formerly known as Silver Standard Resources Inc. and changed its name to SSR Mining Inc. in August 2017. SSR Mining Inc. was incorporated in 1946 and is based in Denver, Colorado.
Profit and operating cash flow is positive
Volume is increasing
Positive earnings
Risk reward - 2.95
Resistance 17.37, Target 24.39
Stoploss 14.35

SSRM a Hidden Gem SSRM has traded in a range since the pandemic of 2020. However, the longer term trend for SSRM - going back to 2015- is upward. Obviously there is high positive correlation between SSRM and the spot price of gold due to the companies revenue streams which rely heavily on the price of gold. SSRM has wonderful fundamentals. Despite the companies relatively small market cap, SSRM has seen impressive revenue and margin growth in the last five years. The company is also sitting on around 400 million in free cash flow which translates to a very strong price to free cash flow ratio of around 11.5 for SSRM. Also, in recent years the company has lowered its debt levels and now sits at very low levels of debt compared to total equity and/or assets.
The overall takeaway: SSRM has great fundamentals and appears undervalued when compared to competitors like NEM and HMY. SSRM seems like a great long term buy at its current valuation. This is largely a play on gold/inflation so keep that in mind when deciding the right allocation amount for your portfolio.
This is not trading advice. Good luck!

Mining stock breakoutI guess that's what you call a breakout.
MarketBeat analyst sees an average price of 30 which would be consistent with the 1.618 on the monthly here.
I had been averaging down this stock an will let it run since I believe we are now resetting the cycle on mining stock.

SSRM Potential 50 Percent GainCompany Profile
Sector: Materials
Industry: Metals & Mining
Company Location: Vancouver, BC
SSR Mining Inc., together with its subsidiaries, engages in the acquisition, exploration, development, and operation of precious metal resource properties in Turkey and the Americas. The company explores for gold, silver, lead, and zinc deposits. Its projects include the Copler Gold mine located in Erzincan, Turkey; the Marigold mine located in Humboldt and Lander Counties, Nevada, the United States; the Seabee Gold Operation located in Saskatchewan, Canada; and the Puna Operations in Jujuy, Argentina. The company was formerly known as Silver Standard Resources Inc. and changed its name to SSR Mining Inc. in August 2017. SSR Mining Inc. was incorporated in 1946 and is based in Vancouver, Canada.
12- Month Price Targets
Mean - $24.70
High - $27.00
Low - $20.00
Target vs. Current - 51.5%


SSR - Potential Buying OpportunitySSR broke out of its downtrend in April 2021 and made a high of $24. 40 , in the beginning of June. Since then it has been pulling back and currently at its 61.8% Fibonacci retracement zone. Price Action at the current zone shows that it has found support and any bullish price action will be an encouraging sign to get long. My target will be $23.15, the next Resistance level (potential 10% gain) with a stop below the recent swing low.
Please note these are my own notes, by no means trading advice. Please do your own research before entering into any trade.

Expecting last bearish waveBearish idea on SSRM gold mine. According to gold retracement the short is based on a potential third and last bearish movement to 10.30$ where the bullish movement started.


# SSRM long from 19 retest and target is 25# SSRM long from 19 retest and target is 25
# SSRM long from 19 retest and target is 25
# SSRM long from 19 retest and target is 25
thanks

SSRM Technical Analysis 🧙SSR Mining Inc is a minerals company focused on mining precious metals in the Americas. More than half Silver Standard's revenue is attributable to the production of gold, with a significant portion derived from silver production. The company owns and operates the Marigold mine in Nevada, United States; the Seabee Gold Operation in Saskatchewan, Canada; and the Pirquitas mine in Argentina. The majority of gold production is derived from the Marigold mine, and Silver Standard's silver production is principally derived from the Pirquitas mine.
If you understand the idea,🎯 press a thumb up! 👍 Have a question? Don't be shy to ask! 🤓 Interested to study how to analyze charts, follow me!

BUY to SSR MINING DailyHello traders, SSR MINING is in a fake bearish push with weak sales made and a trace made by sellers. On the TIMEFRAME M1 we see a panic which will leave the stabilization zone to move towards its last lowest. And make a big turnaround likely to break the VWAP to breakout the price catch up on losses before session to get to the next high. Which is a significant resistance on the (TIMEFRAME Daily H4 and H1). Enter a resistance to pass (See TIMEFRAME H1 or M15).
Please LIKE & FOLLOW, thank you!

SSRM, Aroon Indicator entered an Uptrend on Sep17, 2020.Over the last three days, Tickeron A.I.dvisor has detected that SSRM's AroonUp green line (see chart) is above 70, while the AroonDown red line is below 30. When the green line goes above 70 while the red line stays below 30, this is an indicator that the stock could be poised for a strong Uptrend. For traders, this could mean going long the stock or exploring call options in the next month. Tickeron A.I.dvisor backtested this indicator and found 194 similar cases, 165 of which were successful. Based on this data, the odds of success are 85%. Current price $22.66 crossed the support line at $22.47 and is trading between $23.71 resistance and $22.47 support lines. Throughout the month of 08/17/20 - 09/17/20, the price experienced a +9% Uptrend. During the week of 09/10/20 - 09/17/20, the stock enjoyed a +8% Uptrend growth.
Bullish Trend Analysis
The Momentum Indicator moved above the 0 level on August 25, 2020. You may want to consider a long position or call options on SSRM as a result. In 51 of 65 past instances where the momentum indicator moved above 0, the stock continued to climb. The odds of a continued upward trend are 78%.
The Moving Average Convergence Divergence ( MACD ) for SSRM just turned positive on August 28, 2020. Looking at past instances where SSRM's MACD turned positive, the stock continued to rise in 28 of 32 cases over the following month. The odds of a continued upward trend are 88%.
SSRM moved above its 50-day Moving Average on September 14, 2020 date and that indicates a change from a downward trend to an upward trend.
Following a +8.26% 3-day Advance, the price is estimated to grow further. Considering data from situations where SSRM advanced for three days, Tickeron A.I. shows that in 145 of 182 cases, the price rose further within the following month. The odds of a continued upward trend are 80%.
The Aroon Indicator entered an Uptrend today. Tickeron A.I. detected that in 165 of 194 cases where SSRM Aroon's Indicator entered an Uptrend, the price rose further within the following month. The odds of a continued Uptrend are 85%.


recent bull flag + news: reached another milestone = BUYStock looks like it's preparing for a surge. Follow for more ideas

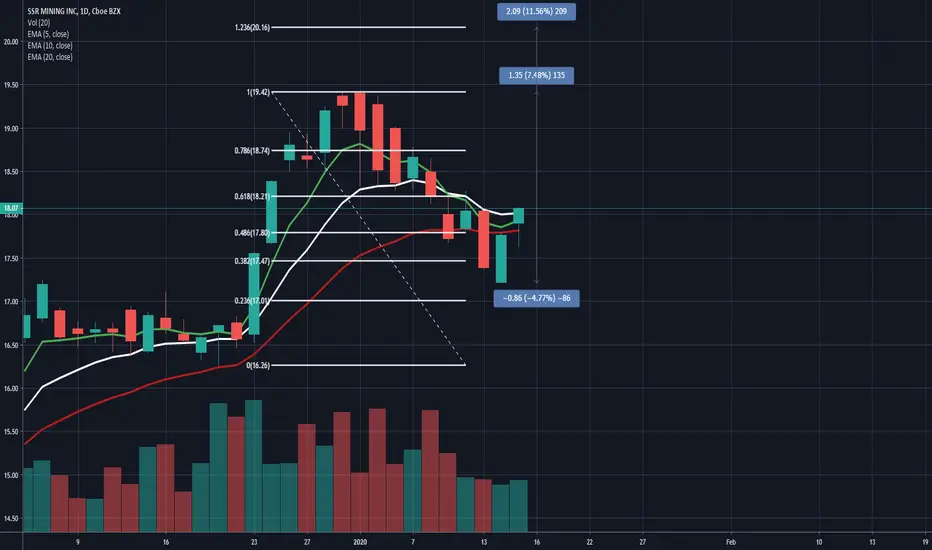
SSRM Long• SSRM
• Entry: 18.07
• Stop loss: 17.21 (-4.77%)
• Profit target 1: 19.42 (7.48%)
• Profit target 2: 20.16 (11.56%)
Trade Journal: Long SSRM - 1/15/2020SSRM broke out of a 4 month base in December and has been in a pullback for the past 2 weeks. I've been watching SSRM to go long on this pullback and the trade setup finally triggered. SSRM had pulled back into a key area of support - the previous breakout area and the 38.2% Fibonacci retracement level. Furthermore, a bounce at this area would be considered a 21EMA pivot. SSRM also has a clear downtrend on the 30m timeframe therefore my gameplan was to get long when the trend reverses with higher highs and higher lows signaling a bullish trend. I went long SSRM at 17.97 with a stop loss below today's low at 17.55. My target on the trade is 19.25. I plan to take partial profits when the 30m bullish trend terminates.

ssrmjust a chart showing when the trend changes and ribbon gets pointy, madrid ribbon the same. turning points are when traders go long or short and positions in the future are a battle line

SSRM LongHit scanners (along with JAZZ pharma ) late last week. Solid long term trend forming. Nice.
