SU trade ideas
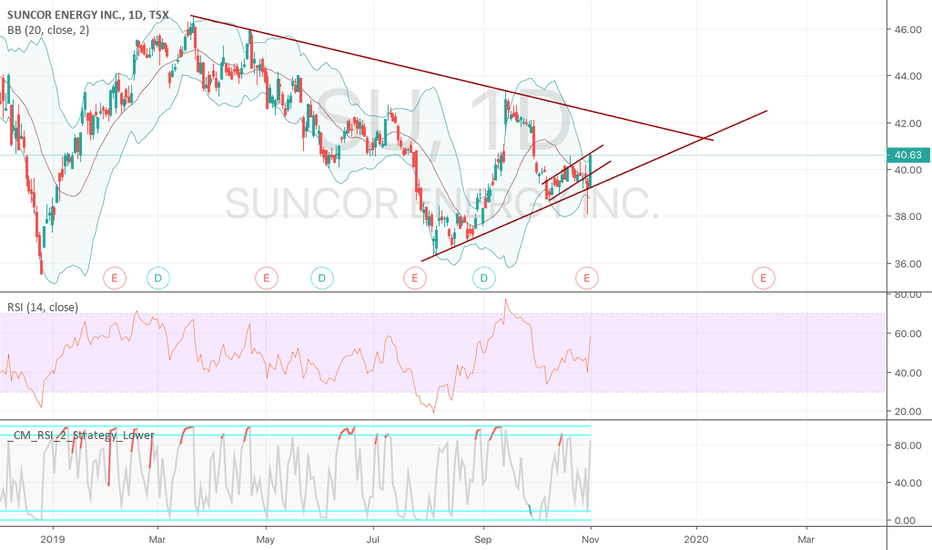
SUNCOR: Leading Energy as Predicted; Solid 2020 AheadAs I expected, Canadian Energy is off to a fairly nice start in 2020, led by Suncor (SU) and Canadian Natural Res. (CNQ). While CNQ started gaining momentum in late 2019, SU has finally caught up. Don't forget about smaller stocks like Tourmaline (TOU) - however, expect volatility in a big way when trading 'cheaper' energy stocks, but the overall trend is up.
In the long-run (2020 and 2021), both charts for SU and CNQ look quite promising with an eventual strong break-out to the upside, however this strong upside may take 12 or more months.
My target for SU by the end of 2020 into early 2021 remains at about $55 (conservatively optimistic), and the buy-point is a 2nd re-test off the 45 level if one has not entered already.
Importantly, be prepared for volatility throughout the trading sessions almost everyday as the energy sector has IMMENSE short interest, so do not lose hope if your stock moves up and down 1 or 2% to the up and downside within hours but dips will be bought throughout the day or subsequent day(s).
- zSplit
SUNCOR: Will Hit At-Least $55 by 2021Part of my latest series of posts has been on Canadian Energy (and certain parts of US energy) for 2020 and the strong rebound for 2020 and likely lingering into or through 2021.
I've posted my reasons behind this as per my related ideas below so to refrain from excessive repetition I kindly encourage the reading of my other ideas.
Except Suncor to break out of a rising triangular wedge and target 46 then 55. Near the beginning of 2022 it is certainly possible Suncor tops $70.
Top picks: Diamondback Energy, Suncor, Canadian Natural Resources, Tourmaline Oil and Enbridge.
- zSplit
ascending triangle breakout playLooks like this is about to break out from it's ascending triangle MACD histrogram is ticking up and has a cross over.
price action is sandwhiched between the 200 ema and the resistance and i would imagine the rising 55 ema would add more upwards pressure aswell.
RSI seems more neutral bearish to imo
my target is 47.80
NYSE stock picks (Suncor Energy - SU)NYSE:SU
Suncor Energy is looking to set up to the upside with buyers trying to push beyond the 32.50 area which is considered a strong resistance area.
if buyers are able to breach this area it'll be expected to target the 37.90 area - If we take a look at the MACD we find the indicator is beginning to stay above the zero line as well as the RSI is more inclined into trading in its upper boundaries and pushing into the overbought area showing that there is momentum building behind the stock
Also with a surprise worse than expected earnings(E: 0.77 - Actual: 0.67 - 13.36% less than expected) in the last release price was still able to continue its move upwards hinting to a stong appetite towards a bullish stance.
Suncor bounce incomingTSX:SU failed to break pass the resistance line at around $41.80~, the very low MACD is also starting to cross over and it looks like it is bouncing perfectly right off the Bollinger Band. Good long opportunity here until it needs to make a decision at the previous support trend line around the $47 mark.
$SU Weekly Chart: Inverse H&S+ Cup & HandleHaven't wrote up a good chart in a while.
Weekly Chart:
Forming a strong inverse head and shoulders pattern with a cup and handle pattern as well.
3 Lines are my fav techs the Keltner Channel. Green line is middle kelt showing candle closing and holding above it on the week.
Looking for close $31+ or over the middle kelt.
Long term target: $36
Short term target: $33-34


