TLRY LONG TRIGGER on WWThe purpose of this hindsight post is to introduce wolfe wave version 1.4. The latest version allows users to modify the wolfe wave length. In previous versions, the wolfe wave length was defined with length=13. In the new release, users can introduce user-defined length values. When displaying user-defined wolfe waves on charts, it is recommended to also select a color that corresponds to the specific length value. For instance, in TLRY there are three bullish wolfe waves identified in 3 different time-frames. Each color represents different length value which range from 9, 13, and 21. The green color wolfe wave corresponds to length =13. The blue color wolfe wave corresponds to length =21. The yellow color wolfe wave corresponds to length =9. It is highly recommended to combine the wolfe waves with ttm squeezes of uncommon time-frames, ie 78 min. The expected move for TLRY is achieved and therefore entry into TLRY should not be considered.
TLRY trade ideas

$TLRYBreaking out of a falling wedge pattern.
Look for first target around $14 per share.
Second target around the $16 region.

TLRY TimeAnother beautiful, long Falling Wedge on TLRY here since around March. After that huge run from TLRY, there was much selling and bearish divergence on the chart from being so overbought. The run up left many gaps in the chart and they needed to be filled before TLRY could even think of going for another run.
Bullish divergence seen on the RSI, RSI value is making higher highs while the price continues to make lower lows, meaning some bullish divergence. Also coupled with the MACD cross today, I think this could be the start of a nice reversal for TLRY.
Has consistently used the fib retracement levels for support and resistance, so if we target the 236 fib level at around 20-22 dollars, that would give us an 80% return on our investment. However, just looking at the closer resistances, for the short term I would target first resistance at around 12-12.5, and then at around 14, then up to 16-17 $.
GAPS:
There were many gaps in the chart due to the run up in Jan - Feb which needed to be filled, the last of which were at 9.6 - 10.5. We did not COMPLETELY fill the gap so be careful about that, only a partial gap fill.
SUPPORTS:
I would be looking back to the trendline which acted as a bounce for this recent run today. Around 10$, then I would look at 9$ as the next support level after the gap fill.
RESISTANCE:
$12 - $12.5
$14
200 SMA at $14.70

Tlry- Descending wedge breakoutLets see if this descending wedge breakout is really bullish. I am also seeing that the options are cheap, that maybe a huge driver and everything the market is currently experiencing.

TILRAY ROCKET HIGH TODAY +16% This is not an advice just a note for myself to remember. Months it was low and today it flew 16% up to 11.83 (came from prox 10)
It had no pullback and no backtest of the opening which TIlray normally does. This makes me wonder if this high is sustainable. I think it will not go that easy tomorrow to 15 or higher....I think it will test the opening price once more. Or at least test 50% of this rise of 16%. I am afraid to buy more because it can drop very fast. Tilray does not have good numbers only good news of legalisation and some products possible with cannabis in it.....I don't see a further rise this easy. Feel free to share your point of view with me or share a nice analysis with me.
I know the price is very far from the ATH -75% i think.

DOA trading Strategy - TLRY#TLRY - Green DOA sniper and meter are firing on Daily chart
We should see a breakout at this wedge before EOW

Tilray two scenarios Hello! Tilray has been steadily declining since its initial impulse and it is reaching critical levels. Gaps will be filled and we will touch 9 dollars in the next couple of weeks. If 9 dollars holds then we could see a retrace to the trend line ($30). If $9 doesn’t hold then we will go much lower.

Tilray could fill a gap belowI'm looking to start to enter a laddered trade on this name, and hoping that the SAFE banking act gets the go ahead. Probably going to keep my position small as I already have some exposure in this sector in Aurora. Looking for entries inside the gap.

TLRY Long Term Swing Hi Guys , What do you think about my analysis on TLRY right here ,
As we can see from the chart , a huge selling off from TLRY and seller is slowing down ,
with an extra confirmation ,we are seeing a falling wedge chart pattern is forming ,
and also the price is coming back to fill up the previous gap as well as line up nicely with the major support right there ,
now we are looking for a long position but we need an extra confirmation before entering the trade ,
what we are waiting for, right now is a breakout from the falling wedge pattern , or strong bullish candlestick .
if you like this idea , please give it a thumbs up or comment down below thanks !

$TLRY Tilray Bleed to $10.00
Hopefully you find the chart helpful in terms of Supports & Resistance etc.
we refrain from adding commentary on the chart as that is reserved for our members and we are very conscious of not giving financial or trading advice.
Thank you for taking time to consult our chart and we would really appreciate a like, follow or comment.

Tilray: Please Stop! 😔😔😔It’s falling and falling and will continue to fall for a little longer. This should go on until a little under $9.73. There, the correction should finally end and new increases should follow.
Be patient!

TLRY Spike StudyJust studying some and figured to put some thoughts to writing, solely for my own friction of thought.
$TLRY's sudden price jump occurred during the formation of a minuette 5 wave, which extended. The steep sell off right after, was pretty scary, but expected at the same time. I am trying to decide if we witnessed an anomaly, or if this insane price action marks the beginning of a reversal. The fact that it was a wave 5 certainly justifies the sell off, but there are several waves of higher degree, that haven't been completed yet.
There are many catalysts for the industry ahead, this year.
There are many catalysts ahead for TLRY, once the merger completes
The spike was caused by a short squeeze, meaning investors were correct to be bag holders, and shorts had to cover their positions
The sell off brought the price back to pre-squeeze levels, and found demand, confirming the above.
So now what?
There are examples of assets that spiked, then traded sideways for a time, before continuing higher. $GRWG is a good example, when it spiked from $2 to $20. If you study that spike, you see a retrace of 50%(ish), 2 months sideways chop and then started on a textbook impulse wave to the current level of $55, with both spike, correction and impulse wave following Elliot Wave Theory to a tee.
Frost and Prechter, page 66, describes behaviour following fifth wave extensions:
"The most important empirically derived rule that can be distilled from our observations of market behaviour is that when the fifth wave of an advance is an extension, the ensuing correction will be sharp and find support at the level of wave 2 of the extension.
As marked on the chart here, you see the extension take off from iii, then plunge back into the ii range that I marked with green. The book continues:
"Sometimes the correction ends there, and sometimes only wave A ends there. Although a limited number of real life examples exist, the precision with which A waves have reversed at this level, is remarkable."
and finally:
"This guideline need not apply when the market is ending a fifth wave at more than one degree, yet the action suggests that we should still view this level as at least potential or temporary support."
For $TLRY, I am quite confident that we ended minuette 5 of minute 3. Even if I got a degree wrong here, we are still looking at minor 3 inside intermediate 3. So, in theory, we still have a series of 4-5's to complete before this primary wave is complete. At the same time, the top of minute 1 is at $9.66, so this asset has lots of room to move.
Trade with caution.

short term +500% (also look at ganja penny stocks +1,000%)Tilray, Inc. engages in the research, cultivation, production, marketing, and distribution of medical cannabis products.

Divergence on critical supportClear divergence after bouncing off critical support level. Low risk entry with SL & TP levels marked. As always, safe trading. Let me know your thoughts down below!

TLRY is going down. 30% profit opportunityNASDAQ:TLRY just broke under a massive support level. Most signs are showing that it will go down to the take profit area shown on the chart.
⚠️ Let me know your feedback and comments below!
⚠️ Follow me if you would like to see more analysis like this

Tilray $TLRY Set Up For Breakout The chart here really speaks for itself. $TLRY is coming to the end of the Falling Wedge it has been trading in since February and is very likely going to break out to the upside.
We are also seeing higher highs on the RSI while the price is dropping. This is bullish divergence, paired right at support, making this a very clean setup.
A very modest target will be $17 after successful breakout and in my opinion, has room to go higher.

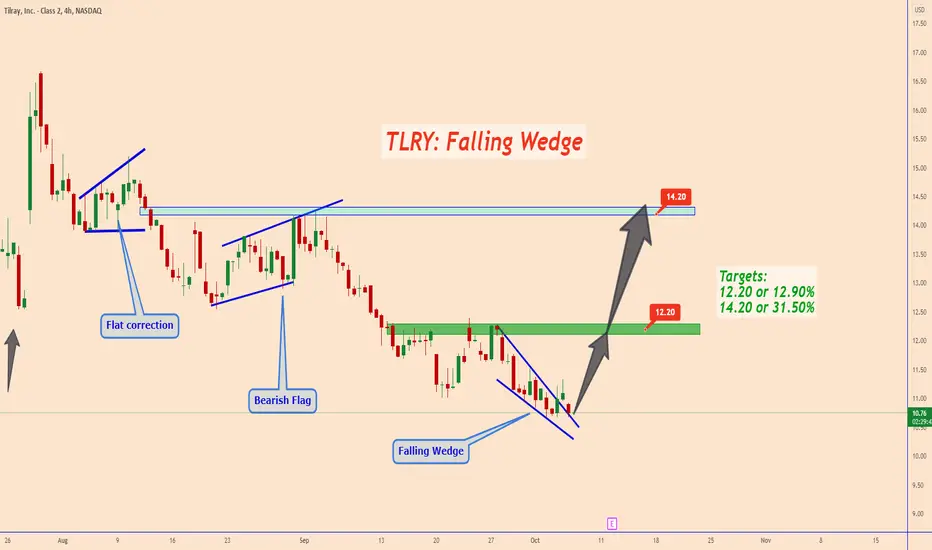
TLRY: Falling WedgeTLRY company completed a falling wedge pattern.
For this company this price it's a bit low and it will increase again.
As are looking the last months the stock market it's suffering in almost all the sectors.
So the move down it's not related to specific stocks.
Targets:
12.20 or 12.90%
14.20 or 31.50%
Thank you and Good Luck!
TLRY - Massive falling wedge brewing Expecting 2 more months of punishment in the MJ sector. Still looking for $10 gap to be filled.. Either way, $36 EOY TP.. GLTALs


TLRY Inverse Head and Shoulders PatternNASDAQ:TLRY is attempting to break out of an inverse head and shoulders pattern. The pattern calls for a measured move target around $13.


Tilray (TLRY) - Sideways to down I suspect we will see another sideways to down week. I suspect more negative news out of China will hinder the SPY. This will lead to more broad sell off. I dont see Tilray moving much upward unless there are positive news on banking and legalization. Any up moves will quickly sell off short term. I may add to my position for cost average down by selling puts, but the premium is vey low.
Holding 20,000 shares at 15.50 cost basis
Cover calls sold over time my cost basis is actually 13.11 at the time of this post

Bull Divs FormingBull Divs have formed on both the RSI and MACD on TLRY. Price is falling into an area where there is strong support. Seems like a massive double bottom pattern is shaping up. This I think is a great longer term hold with a macro trend reversal on the horizon.
