Reversal Looking Good So FarWe saw TLRY pick up some points today and should see a kick up to resistance level at $15.30 before seeing some retracement.
Looking to see a higher low form after retracement to make a W formation.
TLRY trade ideas

🟢 Added to $TLRY New Target 19.84 for 22.92% 🟢 $TLRY Target 19.84 for 22.92%
Or double position at 12.44
I added here because it bounced off of support… if it hits support again (13.41) I will add again before doubling at 12.44.
-----
—
On the far right of the chart is my Average (Grey) Current Target (Green), and Next Level to add (Red) Percentage to target is from my average.
Numbers with an A are places that are a good idea to add if you can.
Numbers with a D are places where you should double your position.
I start every position with .5 - 1% of my account and build from there as needed and as possible.
I am not your financial advisor. Watch my setups first before you jump in… My trade set ups work very well and they are for my personal reference and if you decide to trade them you do so at your own risk. I will gladly answer questions to the best of my knowledge but ultimately the risk is on you. I will update targets as needed.
GL and happy trading.

TILRAY - DON'T FALL IN THE BEAR TRAPTilray again looks like a Bear until it isn't. Bullish ABC Pattern retested it's C Bottom at $13.20 shaking most weak hands off the stock.
Price below all moving averages looks to me like a nice bear trap and since retested the C in a 'Spring on Steroids' should now begin her voyage to Fibonacci 0.5 range from here.

TLRY PUTS below $13.40TLRY looks good for Puts below $13.40 . The stock recently broke a major support trend and has lots of room to the down side back to around $12.

DELTA COVID VARIANT - Support BrokenSupport price has been broken but appears to be holding for now.
News of DELTA COVID VARIANT has the market spooked for another "Covid Crash".
No Buy In point presenting itself yet. Wait and see if support holds and if price can get to bullish reversal confirmation.

NASDAQ: TLRYTilray is the world's biggest weed company measured by revenue , i will be brave enough to put my money to trade or invest into this company .
Tlry has dropped 20% from the last month and with today dropping 4% i will be catching the falling knife
Entry : $13
Exit : $11
TP : $22.45 ( long swing )
"not a financial advice"

$TLRY - $12.74 support needs to hold$12.74 is the next support area. If that hold, we can see range bound consolidation between $13 and $19.
RSI oversold. Stochastic oversold.
Good case - 12.74 hold.
Bad case - $9.41
Entry - $12 - $13 (Greedy/high risk)
Stop loss - $11
Profit taking - $17 - $19
———————————————————
How to read my charts?
- Matching color trend lines shows the pattern. Sometimes a chart can have multiple patterns. Each pattern will have matching color trend lines.
- The yellow horizontal lines shows support and resistance areas.
- Fib lines also shows support and resistance areas.
- The dotted white lines shows price projection for breakout or breakdown target.
Disclaimer: Do your own DD. Not an investment advice.

TLRY Setting up for W formation - BULLISHTLRY looks to be setting up for Left leg of W formation. Right leg MUST be higher than left leg for confirmation.
WAIT FOR CONFIRMATION!
NASDAQ:TLRY

TLRY looks like a good playTLRY is looking good. The 10/20 MA looks like it's going to make a stronger turn up.

$TLRY gorilla glue sniper*This is not financial advice, so trade at your own risks*
*My team digs deep and finds stocks that are expected to perform well based off multiple confluences*
*Experienced traders understand the uphill battle in timing the market, so instead my team focuses mainly on risk management*
My team has been watching cannabis company $TLRY for the past few months. We have been watching on the sidelines waiting for the share price to hit the support that it reached early this morning.
My team expects $TLRY and other weeds stocks to start a reversal soon. Bullish sentiment is finally here.
My team entered $TLRY at $15.90 per share and plan to take profit at $29.
This is a long-term play.
ENTRY: $15.90
TAKE PROFIT: $29.00
STOP LOSS: $14.85
If you want to see more, please like and follow us @SimplyShowMeTheMoney

Watch for move up in TLRY I'm getting a lot of energy in the marijuana sector (dowsing, signs, psychic friend even got TLRY last Fri and I got it on Thurs).. specifically, TLRY and also ACB. I have it as getting a big move up. I do have a message about being patient as well, so this might not happen until Tues. The next date for this one is 7/14 maybe for a high?? These dates are often near a swing high or low, or can be big moves.
The problem I keep having the past week is a ton of my picks are moving between 14-30% and then giving it all back, Including TLRY on Monday when it was up 14% and then puked all over itself.
Yesterday was BBBY (up 31% then close +10%). Others have been CLNE, WKHS, XERS and others. So at this point I just want to take profits starting at 14% and then watch.
I do think this short term kind of pop is likely again in TLRY rather than a sustained trend type move.
I'm not good at keeping up with my ideas, so sorry.

First Time In A Long Time For TLRYFirst time in a long time that TLRY failed to close above its 200DMA. Despite this, it remains consistently trading around the 786 fib over the last few months. Without any fundamental catalyst, it really could depend on that industry at large. I think the whole MJ Bill was a buy the rumor/sell the news for what it's worth. Not a whole lot of range on the move leading up to that headline. But since it broke below the 200 for the first time in a while, volume (bullish volume) is going to be something to monitor for, closely if this is on your list, short term. These are the levels to keep track of on a larger scale.
"With so many states and countries riding the legal cannabis wave, the discussion surrounding federal marijuana legalization in the US is changing. More proposals are getting submitted, and more conversations are happening. Whether this next step results in a real bill is to be seen. But what we can say is that the speculative nature of the cannabis industry tends to feed off of the unknown. So if marijuana penny stocks are on your list right now, keep this in mind, and volatility can play its role in bullish and bearish sentiment-driven trading."
Quote Source: Best Penny Stocks To Buy Before Marijuana Legalization? 4 To Watch Now


Tilray TLRY at Key SupportTilray is currently at a key supporting ascending trend line (red dotted line) which can be seen best on the daily chart.
The only decent spot for a stop loss would be around the prior pivot which is around $13.20.

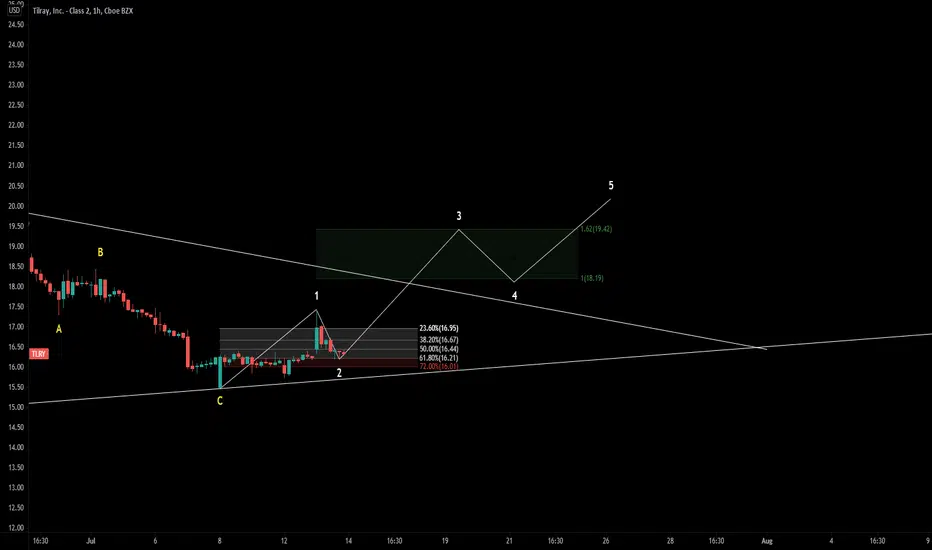
TLRY targetBased on Fibonacci the current pattern seems to be stabel. That offers the opportunity to determine new price targets, mentioned in the chart above.

TLRY Bullish Triangle PatternTLRY has been in a triangle pattern for the past month or so
We had a false breakout recently with volume that came in, but no perseverance.
setting entry @ 17.45 but feel free to buy starter position on it


Power of sma200 Tilray
Volume is increasing, we could see a breakout this week around $18-$20
Sma200 support price is consolidating and its similar to amc pattern
If were right we can see tilray making new 52wk high on my fibo extension $100 is
Not far from reality.

$TLRY HTF ACB Long #1 Main Watch
$TLRY HTF ACB Long (Swing)
Monthly - Decel
Weekly - Support/Inverse H&S Pattern/50 ema
Daily - MACD Divergence/Support/Decel/Doji/Descending Triangle Pattern
RR - 9
Execution - Live on 60 min 50 ema break on vol
Additionally on Watch:
Main - $ZOM
Main - $FCEL
Main - $MJ
Secondary - $CNRG
Secondary - $GALT
Secondary - $WEED
Secondary - $BIDU
TLRY - A WEED Stock That Can Get Really HighNice setup on TLRY here that has been correcting from a powerful rally for some time.
On the previous bounce price tagged the 200ma and completed an ABC correction to 0.618. Here the same thing is happening again - price has today bounced off the 200ma and completed a 0.618 ABC correction.
Also price is approaching 1.618 fib time from the two previous peaks.
This is a long term hold and I've bought a LEAP ITM call option here. IV was around 75, high delta.
This stock is a real firecracker if timed well.
Not advice.

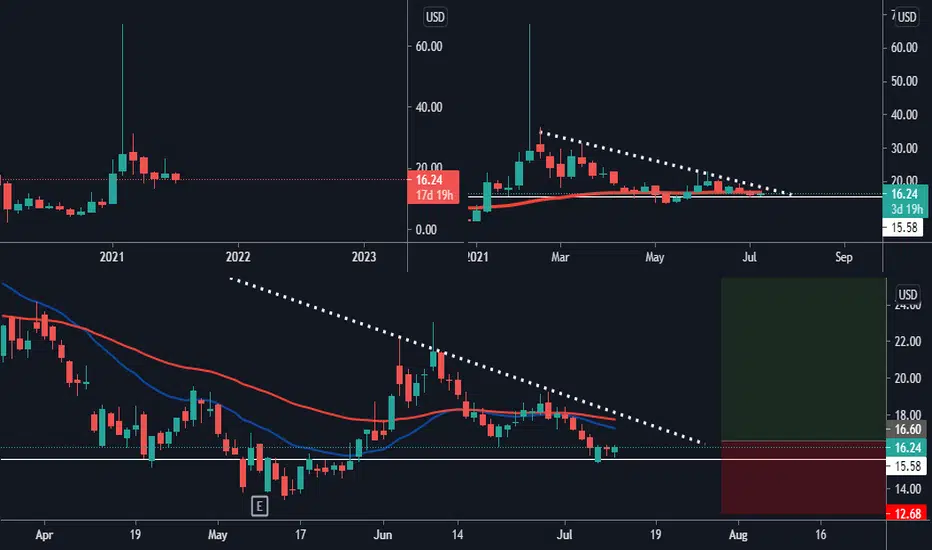
Megaphone on the daily if 200MA is brokenThere is a gap that needs to be filled in 12 - 9.5 level. Invalid if 200MA is not broken in the next week or 2.
This megaphone breakdown will be the fake breakdown to the huge wedge we have on the daily, the final tree shake. It will be followed by strong buying as soon as bottoms.
Not advice. Do your DD. I'm long & doubling my position if we get to that level.

TLRY | Fractal IdeaHey all,
bit of an experimental one from me today.
Since merging with APHA, TLRY has struggled to resume the uptrend earlier in the year.
We can see quite a clearly defined upwards channel within which most of TLRY shares are traded. If the channel holds through today's strength, we could be at the beginning of a similar exponential rise as earlier in the year.
This is purely for illustrative purposes and not a recommendation whatsoever. I will be following this loosely over the coming months to see if this may hold true.
Any thoughts?
Thanks!
(*This is not financial advice, for sake of discussion and illustrative purposes only*)
