TLRY WEEKLY Looking for TLRY to range $40-44 and then advance up in the coming weeks. Looking to head back towards all time high.
TLRY trade ideas


TLRY 4 hr update Not enough volume to say Defiinitively that a reversal has happened. Let’s look for a back test of resistance and see what happens there.

Big Opportunity TILRAYThe Canadian cannabis companies Tilray Inc. and Aphria Inc. announced the completion of their merger the first Monday of May after shareholder approval of both companies. As a result, the combined company has become the world's largest cannabis company as measured by revenue.
The two cannabis companies announced in December that they will merge under the name Tilray. The new combined company is ecpected to deliver cost-effective synergies within 18 months of closing this deal, generating a tax benefit of $ 81 million or more.
In the charts you can also see my previous prediction which I did not post. It has passed the last break of structure (long persp.), which is an indication to rise at least 70% I think. Does this sound like a double chance opportunity? What do you think? Please share your thoughts with me :).

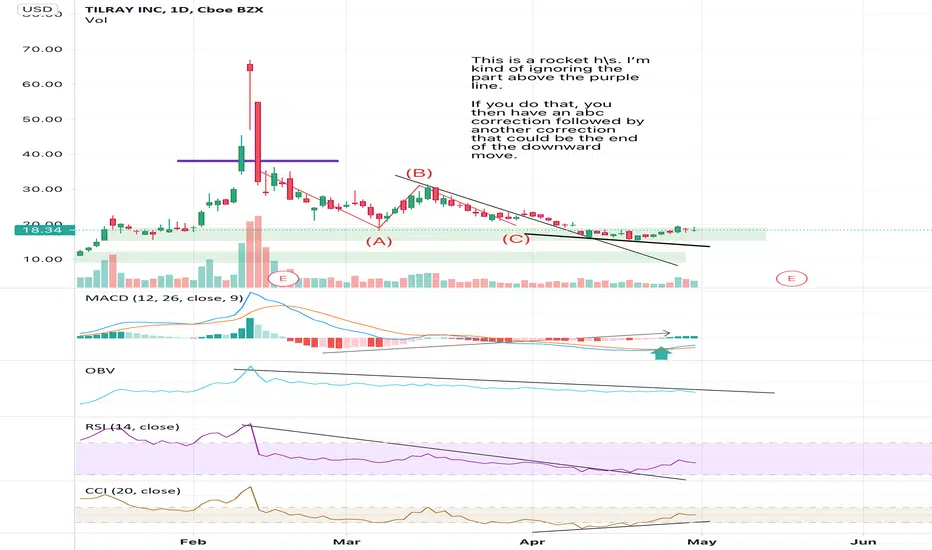
TLRY 4 Hr Analysis On the chart, I have provided the 4 hr bullish Falling wedge pattern that led me to believe the bottom in near these price levels in the first place. She attempted to break this morning but failed so far. A convincing break with some volume would have been a beautiful site to see. We can see a decent buy volume come in upon the first touch of $13ish and I consider this to be a positive signal. The bullish divergence print in the RSI is picture perfect 👌. Long TLRY. This IS financial advice, and I say that because I am not some shill on Reddit who says this isn’t financial advice and then proceeds to act like some expert and basically ridicule anybody who questions their scams.

$TLRY DailyLooking like a good sport reversal
Held the 200d
Macd coiling
Best in class in pot stocks


TILRAY TO ASSIST IN YOUR VOAYAGE TO A HIGHER STAGE MID TERM IDEAHigh-margin medical cannabis agreements in Europe represent critical waypoints on road to conquer the U.S., bolstering the company’s future balance sheet and putting it on firm footing with European regulators.
As in the U.S., legal recreational cannabis remains on the horizon in Europe, where a combined population of more than 500 million in the U.K. and European Union makes it a lucrative proposition.
News are coming soon for Tilray push into the U.K., Sweden, Poland, Luxembourg, and China, with deal discussions ongoing in India. Tilray will begin distributing even in Luxembourg and businesses pushing into Poland by the third quarter of this year.
In China, the group will have a distribution agreement for wellness products with CBD—a non-psychoactive chemical in cannabis that is used to treat pain and anxiety, among other conditions. A similar agreement is under development in India.
This has the potential to be the Tesla of (Medical) Cannabis and if we can wait for it long term to start making profits then until 2030 we may see new ATH exceeding expectations.
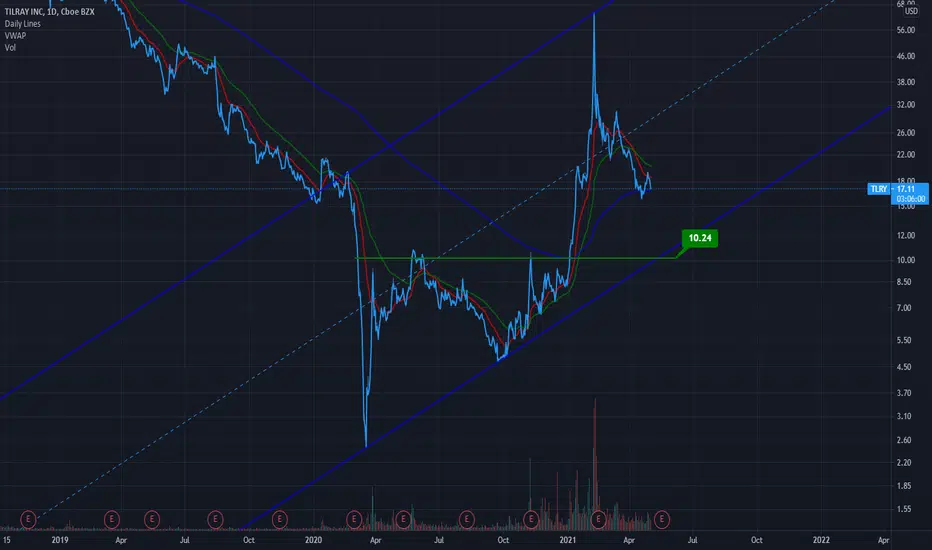
Currently (after a massive short attack) ended up at the current low tens price levels where it can be an accumulation opportunity rarely seen with this potential. .
Enough with the (boring) fundamentals..
Technicaly speaking looks like a bear until it isn't. I will not go through RCI Stochastics MACD or even volume and other indicators which usualy produce false signals depending on the time frame you are looking at. Besides if we are about to start an Elliott wave 5 one may argue that most indicators give pointless divergencies in wave 5 and are only a good consultant up to wave 3.And regarding the volume smart money usualy buy or sell AM or PM so they play/confuse the algos in counting the actual daily volume.
Anyhow I will not go through elliott either since the waves count is no count until they count. Besides Elliott experts say that in commodities there is an exemption and that is: wave 5 may be larger than wave 3. On another note with AI machine learning 90% of MM trading done by Artificial inteligence so maybe no 5 waves exist no more but only 3 waves. and wave 3 may be an Arc that after it bursts shit happens.
So like I said, techicaly speaking looks like a bear until it isn't, however seems to me that we might be near a C bottom of a bullish ABC pattern at low tens (possible Wyckoff accumulation zone or V shape recovery instead - nobody knows - and this is why always better to buy shares instead of gambling with options - it's a Fugazi after all - ) hence Tilray may strongly reverse from here without prior notice.
Remark: This is my first and last idea. I have to continue my voyage. Stay strong. Stay Bullish!


$GME vs $TLRY studyI like to go back to TLRY sometimes to look at how a stock comes out of a hype cycle...

Let's Talk some more About TlryIn this analysis, I am providing you my long term outlook for Tlry Inc, using a basic elliot wave theory model. TLRY is up there with my number ONE prospects right now. It is up to you to decide where the wave counts are. Remember I'm not going to always provide you guys every little detail, my goal is to provide more simple price path charts to see people educate themselves in this market to make sound decisions on their own someday. Closer followers like to use my price paths as entry exit levels but for anybody trying to really learn this, feel free to ask questions. That being said, you can see the old Buy and sell boxes from a few years ago that I have left on the chart and you can find linked to this update. Although we fell 50% lower from the green box, our upside target hit pretty spot on, and we made profits. We took profits and re invested into TLRY over 50% lower between $15-$25 and are ready for the next wave up. I can see TLRY reaching triple digit prices before too long and accumulating seems wise. Horizontal levels are historical supports/resistance. All I have done is drawn waves through them. Now it's up to you to decide if you agree or not. Give me a like or comment if you agree or tell me why you don't agree. Hope everybody has a great week. Shorter term analysis to come.


TLRY - Daily with Fib Ext, SSL, and moreTLRY - Daily with Fib Ext, SSL, and more
Going with a new setup moving forward. Will be using the: ADX indicator for strength, the DMI/Stochastic for confirmations on trends and overbought/oversold, a new WAE indicator by Lazy Bear, and this SSL Off Chart indicator.
I am trying to confirm "whats potentially coming" since I primarily play options and after spending two full days researching it seems like these indicators work really well together and when you add in the fib extensions it gives a really good picture of what "might" be coming.
NO POSITION

Long TLRY Price path projection on the chart. Closer followers, message me privately for more details on this gem.


Tilray Inc (NASDAQ: $TLRY): Marijuana Prohibition Boom 2021 🌿🌿Tilray, Inc. is a leading global cannabis-lifestyle and consumer packaged goods company with operations in Canada, the United States, Europe, Australia, and Latin America that is changing people's lives for the better – one person at a time – by inspiring and empowering the worldwide community to live their very best life by providing them with products that meet the needs of their mind, body, and soul and invoke a sense of wellbeing. Tilray’s mission is to be the trusted partner for its patients and consumers by providing them with a cultivated experience and health and wellbeing through high-quality, differentiated brands and innovative products. A pioneer in cannabis research, cultivation, and distribution, Tilray’s unprecedented production platform supports over 20 brands in over 20 countries, including comprehensive cannabis offerings, hemp-based foods, and alcoholic beverages.

$TLRY - 200EMA | MORE SELLING OR BOUNCE?NASDAQ:TLRY
$TLRY HAS ALREADY CLOSED BELOW THE 200 EMA ON THE DAILY. ITS EITHER GOING TO BREAK BELOW THIS LEVEL AND HEAD TOWARDS 12-13 OR THE 15 LEVEL OF SUPPORT WILL HOLD AND $TLRY WILL HEAD BACK TOWARDS 18-19.
I PERSONALLY BELIEVE $TLRY WILL CONTINUE ITS DOWNTREND, SO I AM CURRENTLY BEARISH.
BREAK BELOW THE 15 WITH VOLUME, PUTS COULD BE A PROFITABLE PLAY.
****JUST A THOUGHT, JUST A TRADE IDEA****
GOOD LUCK,

TLRY - More downside to comeStill seeing a lot of downside for APHA/TLRY SP.. and pot sector.. $10 would be a potential buy-point, however need to keep an eye on broader market direction GL
NEW POSITION $TLRY Target 21.61 for 24.84% $TLRY Target 21.61 for 24.84%
Or next add level is at 13.01
I really really love trading TLRY. Always a good swing.
—
On the far right of the chart is my Average (Grey) Current Target (Green), and Next Level to add (Red) Percentage to target is from my average.
I start every position with 1% of my account and build from there as needed and as possible.
I am not your financial advisor. Watch my setups first before you jump in… My trade set ups work very well and they are for my personal reference and if you decide to trade them you do so at your own risk. I will gladly answer questions to the best of my knowledge but ultimately the risk is on you. I will update targets as needed.
GL and happy trading.


$APHA is merging. Here is $TLRY.MACD histogram green after a lengthy red period. MACD signal lines have crossed into a buy signal.
RSI is starting to head back up away from oversold.
CCI is giving bullish divergence.
OBV is starting to creep back up, but nothing eye popping.
$TLRY - On Hold for Breaking Above The TrendlineNext resistance 20$.
Long above 20$
I do not recommend buying or sell TRLY stocks.
