TLRY going higher before FridayMy charts are showing me that TLRY still has room to jump higher another 4 points to maybe 30 this week. Momentum is still showing on my charts to conintue maybe jump up tomorrow. I am holding $25 call options expiring this Friday and may sell tomorrow on opening jump up.
These are my views only and this is for educational purposes only.
TLRY trade ideas


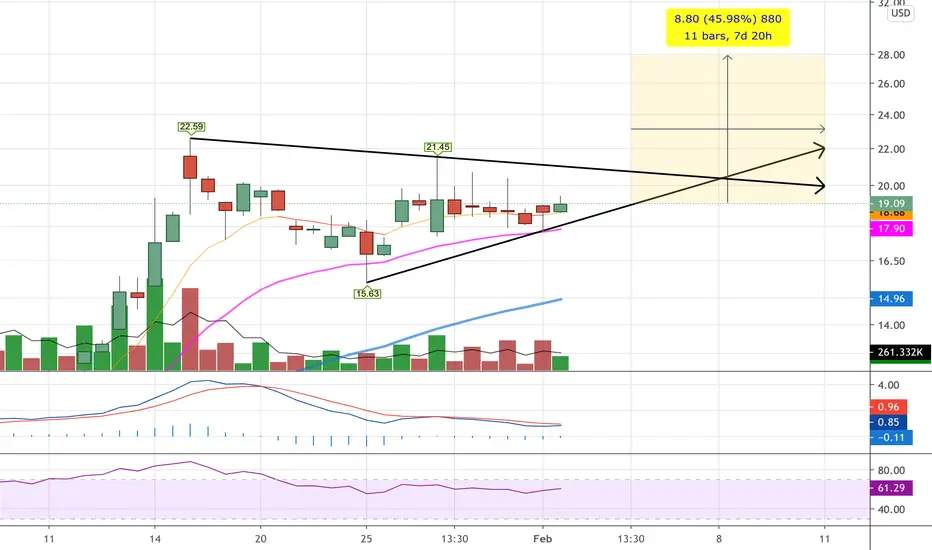
TLRY bull wedge? short term to 20+?This is a pretty great looking chart (sort of looks like a dragon!). I show a bull wedge forming with support on the bottom end from both the 50 hour and previous uptrend line. Should be good for a short term trade (i.e. next 10 days) to 20+. i'd say the trade is broken if we close meaningfully below 17.


TLRY keeping the trend lineI've been worried a bit that Tilray won't make it, still it holds the line. It's a great long term investment, would be nice to also be a good choice in short/mid term.
If you're asking me - I'm in.


$trly updated chart 2/2/21Been tracking $trly for awhile now you can check out my past ideas on it... finally had a nice green day over 100% returns!
Resistance: For resistance I will be looking at the trend based extension, so around the the 25 28 area

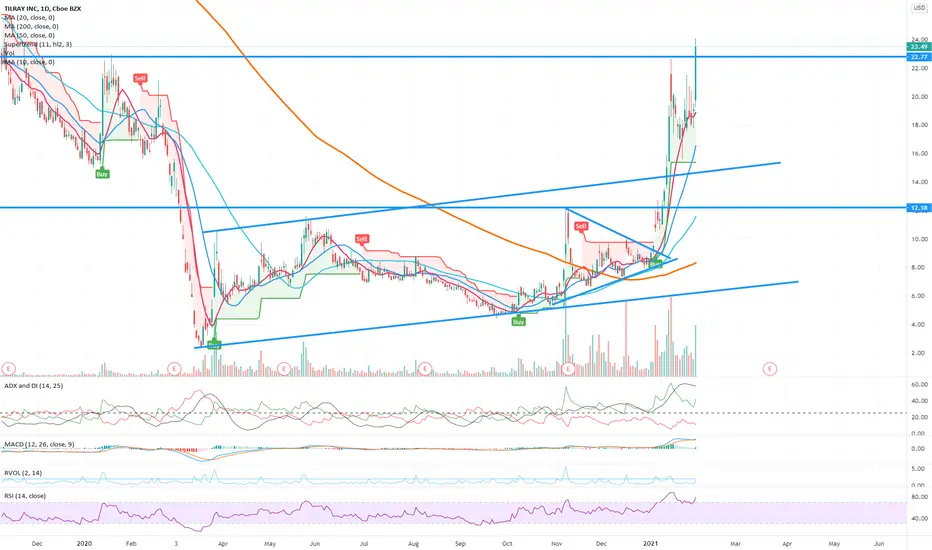
US Stock In Play: $TLRY (Tilray Inc)$TLRY further extends its 2021 vast rally with a day gain of +22.98%, closing at $23.49. $TLRY engages in the research, cultivation, processing, and distribution of medical cannabis. The total gain achieved by $TLRY for 2021 stands at +179.64%.
The first accumulation signal of $TLRY coincides with a higher opening at premarket which broken out of its 5-weeks Symmetrical Triangle chart pattern on 16th December 2020. It was noted that substantial buying pressure kicked off the run up on 6th January 2021.
At the current junction, average price volatility of $TLRY ranged within 8%/day with continuous volatility expected on TLRY bi-directionally.

TLRY till death do us partTilray is a global leader in cannabis research, cultivation, processing and distribution. On the chart, it's clearly in the process of digging itself out of the grave. There's a lot of buzz due to the recent merger with Aphria and potential legalization of marijuana under the Biden administration. I'm a buyer, and will probably hold half of my stack as a longer term investment, and actively trade the other half. Let's see what happens!


Tilray Bullish IdeaTLRY 4H - Been trading within this channel for the past week or so. I believe the real move hasn't happend yet. Within the channel there seems to be an ascending triangle. Looking at the TTM Squeeze it seems to be squeezing for the past couple days. Once it pops and it picks a direction I think it'll have a big move. Needs to hold $19.30 for continuation to $19.97 which is near the break of the channel. Also plotted some fib extensions as price targets once it breaks out.


$TLRY bounce spotHI guys looking for possible bounce spots if we get a nasty short lived pullback on the indices, doubtful but could happen.
