TCR Energy Corporation Is this the beginning of a significant leg down for TC Energy? From a technical perspective, I strongly believe this area marks a distribution phase, potentially leading to further downside. The monthly engulfing candle, combined with a head and shoulders pattern visible on the daily and weekly timeframes, supports this view. Personally, I’m swing shorting with TP1 set at the mid-support level and TP2 at the bottom of the channel, where I plan to look for buying opportunities again. Let me know your thoughts!
TRP trade ideas
TC Energy CanadaSun Storm Investment Trading Desk & NexGen Wealth Management Service Present's: SSITD & NexGen Portfolio of the Week Series
Focus: Worldwide
By Sun Storm Investment Research & NexGen Wealth Management Service
A Profit & Solutions Strategy & Research
Trading | Investment | Stocks | ETF | Mutual Funds | Crypto | Bonds | Options | Dividend | Futures |
USA | Canada | UK | Germany | France | Italy | Rest of Europe | Mexico | India
Disclaimer: Sun Storm Investment and NexGen are not registered financial advisors, so please do your own research before trading & investing anything. This is information is for only research purposes not for actual trading & investing decision.
#debadipb #profitsolutions
Dip opportunity. Zooming out from all the way back to 2000, whenever price has dipped below the 200 ema it has bounced back up, moreover it has respected this long term trendline ( closing price) . I think it's fair to say we can ignore the corona crash as that was pure panic.
Taking a look at the daily we can see it has reached oversold conditions along this trendline and it's recent price action since the march highs suggests a wedge, though I'd say its more of a channel. Right now we have a daily inside bar , but the fact that we are at the intersection of 2 important trendlines suggests the downside is limited and the risk reward for upside is much greater.
This company is less weighed on oil compared to Enbridge and has more natural gas and nuclear, which this seems like a great time to add to your portfolio if you' believe those sectors are heavily undervalued. Currently it's dividend is at an attractive 6.3 % and I believe long term gas and nuclear will have a place and even oil. We can even see some decent insider buying for about 125k worth for shares at 51.85. and 200k worth of shares at 39.09 for the US ticker, which is practically the same price as 51.85 Canadian ticker indicating some decent size buyers at this level, especially at support on the macro trendline.
TC Energy: High Dividend CAGR; Long-Term WinnerFor those that follow my ideas, one of my top performing sectors of 2020 is the Canadian Energy sector in which will be set to rebound relatively strongly after being decimated for the past while. Specifically, I believe the Canadian Energy sector will quite strongly outperform the US Energy sector from a shift in policy, increase in cap-x and more money entering the sector and people in which will look for alternatives to soaring US valuations and "good deals".
TC Energy is one of the few stocks in the entire stock market that has grown quite consistently over the past 10 years without any major "epic dips", including the compound annual dividend rate (CAGR). Unlike other stocks in the energy sector that plummeted in the recession of 2009 and the contraction of 2016, TC energy has maintained quite consistent growth over-time and bounced off lows quite quickly. Why? The answer is in their diversified portfolio.
This is a great pick to 'buy on dips' and hold for a long-time. In 2020 I am looking for continued dividend growth and a TP by 2021 around the 85-90.00 range.
- zSplit
My 2020 Top Sector Pick List
- Canadian Energy (TRP, CNQ, SU, ENB)
- US Technology (Semis/Software)
- Select Cannabis Stocks (IIPR)
- Precious Metals (Gold/Silver/Platinum)
- Utilities (Renewable Energy)
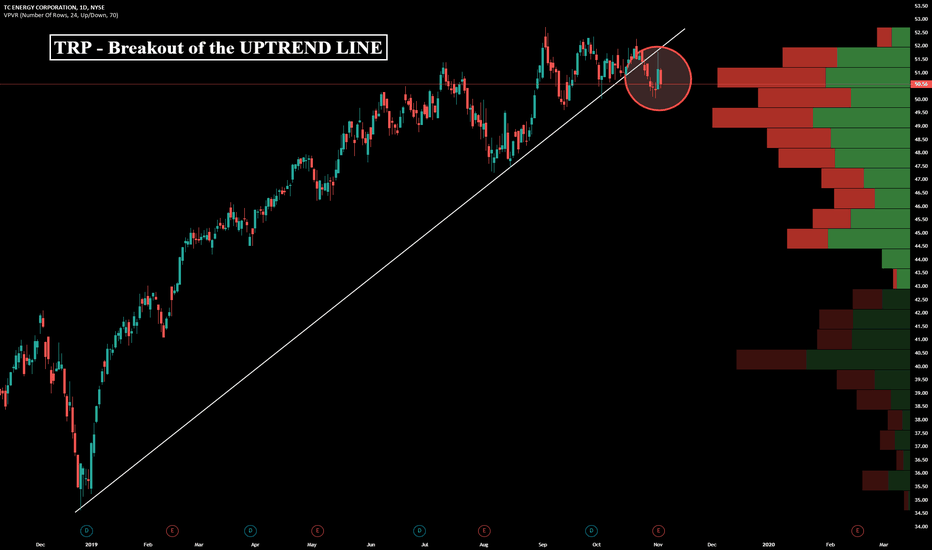
TRP - DAILY CHARTHi, today we are going to talk about TRP
We observe a D1, some important points. The details are highlighted above.
Thank you for reading and leave your comments if you like.
Join the Traders Heaven today, for more exclusive contents!
Link bellow!
Disclaimer: All content of Golden Dragon has only educational and informational purposes, and never should use it as financial advice
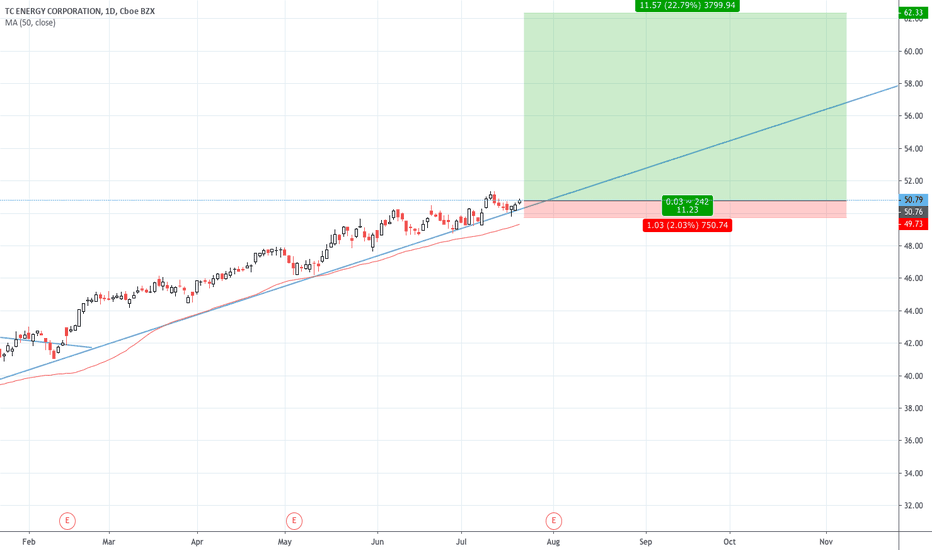
TRP Long opportunityAn intraday high potential, Back Tested Long Analysis.
A bullish butterfly pattern.
We ll try to find an entry price within the expected pull back zone 42.00 - 42.90 as previously being back tested.
DETAILS ON THE CHART
NOTE: Entry range area above the entry point, is calculated upon 80% of the recorded pullback back tested past performances
DISCLAIMER: This is a technical analysis study, not an advice or recommendation to invest money on.An intraday high potential, Back Tested Long Analysis.


