To the Moon?In the worst-case scenario, we will hit all-time high territory for Tesla. We broke the resistance already, and the price is surfing moving averages respectfully. I bought plenty.
TSLA trade ideas

TSLA Break Volume profile + Lift High Lift LowFrom the TSLA image
1.) Decided to enter last Friday. Try measuring the Volume profile from the highest price to the present to see when there is frequent trading. It turns out that, hey, it has established a base.
2.) Looking at the pattern, it looks like a Triple bottom and seems to break through the Volume profile resistance and resistance line.
3.) Like the latest graph on Friday, it will be a High and Low lift.
So I guess it's either a Shoot or a Lose, with a Stop loss at the Low that was lifted up.

TSLA: Big Cup & Handle? Over $300 Soon?Big cup and handle? I feel like NASDAQ:TSLA has so much potential here. Ready for a break out of this handle.
I have long calls for 5/16.
Looking for over 295 to possibly 300? Then big move to $324?

TSLA: Moved like a Hulk. Forming another Wedge? RoboTaxi soon?Liking how NASDAQ:TSLA has been moving. Lot of momentum and strength.
Looks like it’s forming another loaded wedge. Maybe a break upside?
Calls: Green ray at 319.77
Puts: Green ray 315.55
Data as well tomorrow. CPI!
NFA. Do your DD!

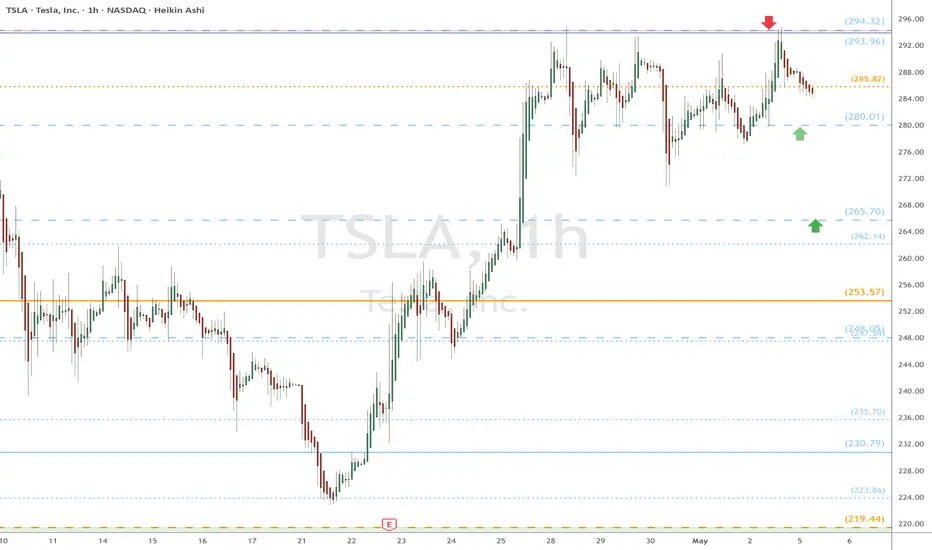
TSLA eyes on $294: Proven Resistance that bulls MUST break NOW TSLA back to a critical double fib resistance $293.96-294.32
Bulls MUST break and retest this as support and do it right now.
Any weakness could give a dip to fibs below at $280.01 or 265.70
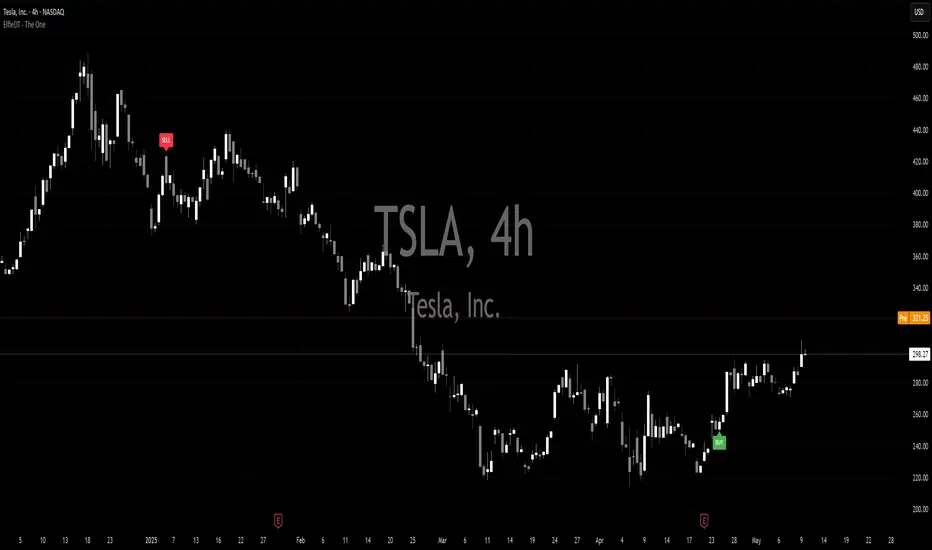
Tesla - The Next 7 Days Decide Everything!Tesla ( NASDAQ:TSLA ) is sitting at a crucial structure:
Click chart above to see the detailed analysis👆🏻
Despite the -60% correction which we have been seeing over the past couple of months, Tesla still continuously validates its overall uptrend. That's exactly the reason for my strong bullish thesis and the assumption, that after we see bullish confirmation, Tesla will reject the current support area.
Levels to watch: $250, $400
Keep your long term vision,
Philip (BasicTrading)

TSLA – Is the Rally Just Getting Started? Updated Trade Setup Tesla (TSLA) just lit up the board with a +7% breakout, smashing past key resistance.
Currently trading around $318, this move isn’t just noise, it’s backed by rising volume and a bullish macro environment favoring growth stocks and innovation plays.
🟢 Potential Entry Zones (on dip or continuation):
• $312–$318 → Pullback entry near breakout zone
• $290 → Retest of previous resistance, now support
• $260
💰 Profit Targets (Swing Outlook):
• TP1: $335 – short-term resistance from previous highs
• TP2: $355 – psychological level + extension target
• TP3: $390+ – if breakout trend accelerates into Q2 earnings
💡 Why TSLA?
• Massive volume surge confirms institutional interest
• FSD, AI & Dojo projects keep optionality wide open
• Solid balance sheet in a tightening rate environment
• Global EV growth still in early innings
• Technical breakout above multi-week range
This setup is about riding momentum, not guessing bottoms. If the market holds, TSLA could be on a new leg up — but it’s crucial to manage risk and avoid FOMO entries.
⚠️ Disclaimer: This is not financial advice. Just sharing my personal analysis and trade plan. Always do your own research and trade responsibly.
📊 Follow for more real swing setups, breakout trades, and raw trading psychology.
This isn’t hype — it’s structure. Let’s stay sharp. 🔍📈

Swing Trade Plan for TSLA (as of $285)TSLA has rallied from its previous consolidation zone and is approaching a potential resistance area between $290–$295. Momentum is solid, but RSI and volume trends may suggest we’re nearing short-term exhaustion.
✅ Strategy 1: Wait for the Pullback (Safer Play)
Entry zone:
• $240 – Ideal level near former resistance turned support
• $215 – Strong support with higher reward potential
Stop-loss:
• Below $200 (to protect against deeper trend reversal)
Profit targets:
• $265 – Conservative
• $290 – Re-test zone
• $355 – Bullish breakout continuation (if sentiment remains strong)
This setup gives room for the price to breathe and positions you after a healthy correction.
⚡️ Strategy 2: Momentum Breakout Trade (Aggressive)
Entry:
• On breakout above $295 with volume confirmation
Stop-loss:
• Below $280 (tight, breakout failure protection)
Target:
• $320, $340+, depending on follow-through
This is higher risk, higher reward — you’re betting on bulls continuing the charge without a pullback.
⚠️ Disclaimer: This is not financial advice. Trading involves risk. Always do your own analysis and trade with proper risk management.

TSLA LONG ~ All the technicals are there!TSLA will still hit $2600 ~ Says Cathie Wood
Will it? Let's take a look ~
ELON is pissing people off and investors are worried, Tarrif FUD, brand deterioration.
All of this doesn't matter
Why?
Pull up TSLA YoY earnings since 2013 and you will see that their revenue growth is outrageous, this past year is really the very first time TSLA flat lined, but holding at 25B revenue.
From a technical analysis since 2013 on the LOG chart, you can see TSLA has done a 10x rally twice, and has held strong support through it's bear cycles. The next it due by 2027.
TSLA has been uptrend for over a year, and broke it's ATH 6 months ago.
Voluming is rising in the longterm
and literally the conservatives love him,
If you think competitors are nipping at their heels think again. The infrastracture that Elon has built with his mega factories, and their positioning in the market is so insane other's don't even come close.
On the short term,
The FUD will wash away,
TSLA is finding support at the bottom of the channel,
shorterm volume is waning on the sell offs,
Shorts will get squeezed by end of June,
and Up and UP TSLA will continue.
BTFD!

TSLA Bullish Price Movement. Price has broken a long term trendline and came to retest and then advanced higher. Expecting price to continue advancing higher.

TSLA LongTSLA Long
Current demand Zone (218) confirmed,
Sell put below next two demand
Long entry 225
no Stop
Target 300
Risk management is much more important than a good entry point.
I am not a PRO trader.
In my trading plan, the Max Risk of each short term trade should be less than 1% of an account.

Trading Journal $TSLAUnfortunately a 1/2 position instead of a full position.
Selling into strength on 1/2 position
Market gapped up.. US CHINA Deal..
AMEX:SPY and NASDAQ:QQQ are way extended now above the 50day MA .. needs time for market to digest their gains
so this could pull back with it

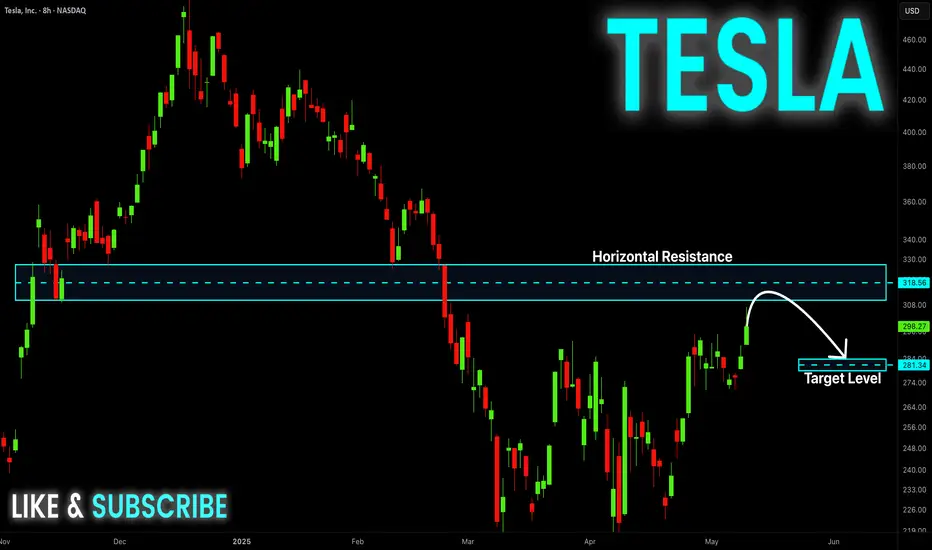
$TSLA – Base Breakout Setup with Dual Entry StrategyTesla ( NASDAQ:TSLA ) is coiling up, forming a classic base breakout setup with a dual approach for traders who want precision:
🔹 Support Zone Entry (280-285)
Shaded area = the zone between the 9 EMA (blue) and 20 EMA (yellow) — a key dynamic support area.
I'm taking a starter position here with a stop just below yesterday's low for tight risk control.
🔹 Breakout Confirmation (Above 295)
Full size only if we see a clean breakout above $295, confirming momentum.
This is where I’ll add size, looking for a strong continuation.
🔹 Execution Plan
Starter position: Shares and options at support zone ($280-$285).
Full position: Add at breakout ($295) with a mix of shares and options.
Risk: Tight stop below yesterday's low for the starter position.
⚠️ Risk Management: Always respect your stops — discipline over hope.

TSLA: Continuation of the upward trendOn TSLA we would have a continuation of the upward trend if and only if the resistance line is broken forcefully.

Tesla Breaks Key Resistance: Bullish Momentum Signals $314 Targe
Current Price: $298.26
Direction: LONG
Targets:
- T1 = $307.00
- T2 = $314.00
Stop Levels:
- S1 = $295.50
- S2 = $289.40
**Wisdom of Professional Traders:**
This analysis synthesizes insights from thousands of professional traders and market experts, leveraging collective intelligence to identify high-probability trade setups. The wisdom of crowds principle suggests that aggregated market perspectives from experienced professionals often outperform individual forecasts, reducing cognitive biases and highlighting consensus opportunities in Tesla.
**Key Insights:**
Tesla’s stock has successfully broken through significant resistance levels following strong earnings and heightened confidence in its growth strategy. The company’s continued investment in Full Self-Driving (FSD) technology offers a significant upside potential, particularly as market optimism around autonomous driving accelerates. Additionally, Tesla’s high trading volume and favorable gamma exposure suggest sustained bullish momentum for the near term. However, traders must remain cautious about valuation concerns, which persist due to the stock’s high price-to-earnings ratio and underlying market risks.
Tesla’s ambitious expansion strategies, including continued realignment of electric vehicle production and penetration in key global markets like China and Europe, make it uniquely positioned to grow further despite macroeconomic challenges. The short-term trajectory is driven by strong technical indicators and supportive market sentiment, making it a compelling candidate for long positions.
**Recent Performance:**
Tesla’s price has surged over 35% since its recent earnings report, riding the wave of high investor enthusiasm and strategic achievements. Its bullish momentum is reinforced by favorable technical setups, including MACD and RSI indicators that signal a continuation of the uptrend. The stock has outperformed other high-beta peers in the electric vehicle and technology sectors, reflecting a strong fundamental and technical foundation for further price appreciation.
**Expert Analysis:**
Market analysts highlight Tesla’s ability to consistently innovate across its product lines while maintaining high operating margins. Despite lingering valuation questions, the stock’s bullish trend remains supported by a robust narrative and growing speculative interest. Strategists are particularly optimistic about Tesla’s advancements in FSD technology and its ability to capture additional market share in ride-hailing and autonomous driving sectors. The company’s recent focus on leveraging artificial intelligence within its vehicle software and energy storage solutions has also fueled optimism among traders.
**News Impact:**
Recent developments in U.S.-China trade policies and economic stimulus measures amplify Tesla’s growth prospects in its largest international market—China. The company’s ongoing efforts to scale its FSD systems globally have garnered significant attention, further supporting long-term bullish sentiment. Additionally, increased option trading activity and Tesla’s exposure to high-volatility events contribute to its price action, offering traders opportunities to capture gains in the near term. Investors should watch closely for updates on international car deliveries and additional announcements regarding Tesla’s strategic initiatives.
**Trading Recommendation:**
Traders should consider taking a long position on Tesla as it exhibits sustained bullish momentum driven by technical breakout patterns, high investor sentiment, and strategic advancements. With Tesla poised to capitalize on macroeconomic tailwinds and sector-specific growth drivers, the stock is likely to test $314 as a near-term price target. Ensure proper risk management by placing stop levels at $295.50 and $289.40.
```

TESLA - Robotaxi will drive the price above 1000This is not a short-term trade as you know from me on FX, Crypto and Indices. This is buy and hold investment. I got already good bag of share and Im still adding without trying to time if perfectly, but now I think its time to buy bigger positions.
Tesla is my 3rd biggest position after the Bitcoin and Strategy (MicroStrategy). Many people see it only as an EV cars company, but it's not all what they do, just read bellow to see why I see a huge potential in this company.
📍Why Tesla is Considered a Top Investment
Tesla stands out as a leading player in the EV market, with a strong brand and a history of delivering innovative products. In 2024, it produced about 459,000 vehicles and delivered over 495,000 in the fourth quarter alone, showcasing its ability to meet growing demand Tesla Fourth Quarter 2024 Production, Deliveries & Deployments.
💾Financially, Tesla reported $97,690 million in total revenue for 2024, with the automotive segment contributing $87,604 million and energy solutions adding $10,086 million Tesla, Inc. Annual Report on Form 10-K for 2024. This diversification into energy, alongside investments in autonomous driving, positions Tesla for long-term growth, making it attractive for investors seeking exposure to future trends in sustainability and technology.
📍What Tesla Does Beyond EV Cars
Beyond EVs, Tesla is deeply involved in energy solutions:
📍Solar Products: Offers solar panels and solar roofs for clean energy generation.
📍Energy Storage: Provides Powerwall for homes and Megapack for large-scale projects, helping stabilize grids and manage energy costs.
📍Charging Infrastructure: Operates a network of Supercharger stations, increasingly open to other EVs.
Services: Includes vehicle maintenance through service centers and body shops.
📍Robotaxi: Plans to launch a fully autonomous ride-hailing service in June 2025 in Austin, Texas, potentially opening new revenue streams Tesla's robotaxis by June? Musk turns to Texas for hands-off regulation.
📍Tesla Optimus: Developing a general-purpose robotic humanoid for tasks like household chores or industrial work, which could lead to new markets.
This expansion into energy and services, along with unexpected ventures like Robotaxi and Tesla Optimus, enhances Tesla's role in the transition to sustainable energy and technology, offering benefits like grid stability and potential robotics applications.
The growth in the energy segment, with a 67% increase from 2023 to 2024, highlights Tesla's expanding role in sustainability, potentially attracting investors focused on long-term trends. Additionally, Tesla's commitment to innovation, particularly in autonomous driving technology, is noteworthy. The company is developing features like Full Self-Driving (FSD), which could open new revenue streams, such as robotaxi services, enhancing its investment appeal.
🤔I think Optimus and Robotaxi will exceed rapidly exceed their EV cars revenue. Elon musk is predicing over 1000% growth in 5 years. Which would be way above $2900 without stocks splits.
I m a bit conservative and I think we can go somewhere between 3 - 4 standard deviations.
Wishing you continued success on your trading journey. May this educational post inspire you to become an even better trader!
“Adapt what is useful, reject what is useless, and add what is specifically your own.”
Perfectly nailed bottom around 200 and our positions are now 50% in profit good luck
David Perk ⚔

TESLA - LONGSAs you can see - our indicator works on any and all instruments you would like to trade....
You can search for the indicator - as we made a DEMO version available.
However to get the full version - you will need to follow and contact us!
Tesla Shares (TSLA) Hit Two-Month HighTesla Shares (TSLA) Hit Two-Month High
During Friday’s trading session, Tesla shares briefly rose above the $300 mark — the first time in over two months. Although the daily candle closed below this key psychological level, TSLA still outperformed the broader stock market.
This move was supported by:
→ Investor approval of Elon Musk’s late-April pledge to spend less time on the Department of Government Efficiency (DOGE) and focus more on his role at the company.
→ A recent announcement from the Trump administration regarding a trade deal with the UK, alongside hints that more agreements may follow — potentially alluding to US-China negotiations.
Technical Analysis of TSLA Shares
In our previous analysis of TSLA’s stock price, we:
→ Highlighted the key support level around $220, which prevented deeper declines in early April even as broader indices saw more bearish trends;
→ Identified a descending channel (marked in red).
This channel remains relevant for now, but the price has already approached its upper boundary. It’s reasonable to assume that this level could act as resistance — similar to the midline of the channel (as indicated by arrows) — especially when reinforced by the psychological $300 level.
However, bulls may find strong support from any further details on a US-China trade deal (as discussed earlier today). A bullish breakout of the red channel in the coming days cannot be ruled out, potentially confirming the relative strength of TSLA stock and extending the trajectory marked by the blue lines.
This article represents the opinion of the Companies operating under the FXOpen brand only. It is not to be construed as an offer, solicitation, or recommendation with respect to products and services provided by the Companies operating under the FXOpen brand, nor is it to be considered financial advice.

OptionsMastery: Looking for an immediate buy on TSLA! 📣Make sure to watch fullscreen!📣
Thank you as always for watching my videos. I hope that you learned something very educational! Please feel free to like, share, and comment on this post. Remember only risk what you are willing to lose. Trading is very risky but it can change your life!


TESLA Set To Fall! SELL!
My dear subscribers,
This is my opinion on the TESLA next move:
The instrument tests an important psychological level 298.27
Bias - Bearish
Technical Indicators: Supper Trend gives a precise Bearish signal, while Pivot Point HL predicts price changes and potential reversals in the market.
Target - 288.52
About Used Indicators:
On the subsequent day, trading above the pivot point is thought to indicate ongoing bullish sentiment, while trading below the pivot point indicates bearish sentiment.
Disclosure: I am part of Trade Nation's Influencer program and receive a monthly fee for using their TradingView charts in my analysis.
———————————
WISH YOU ALL LUCK

TESLA Resistance Ahead! Sell!
Hello,Traders!
TESLA stock is growing
And we are bullish biased
Mid-term but the price is
About to hit a horizontal
Resistance of 322.00$
So after the retest we
Will be expecting a local
Bearish correction
Sell!
Comment and subscribe to help us grow!
Check out other forecasts below too!
Disclosure: I am part of Trade Nation's Influencer program and receive a monthly fee for using their TradingView charts in my analysis.
TESLA: Short Trade with Entry/SL/TP
TESLA
- Classic bearish formation
- Our team expects fall
SUGGESTED TRADE:
Swing Trade
Sell TESLA
Entry Level - 298.27
Sl - 310.31
Tp - 265.48
Our Risk - 1%
Start protection of your profits from lower levels
Disclosure: I am part of Trade Nation's Influencer program and receive a monthly fee for using their TradingView charts in my analysis.
❤️ Please, support our work with like & comment! ❤️
