TSLA about to rip!Closed above the 200 SMA and flipped supply into demand. 325 on deck possible next week
TSLA trade ideas

TSLA at the Crossroads: Multi-Pattern Breakout Brewing at 288
📈 TSLA 4H Chart Analysis – A Confluence of Multiple Technical Patterns
TSLA is currently forming a highly significant confluence zone around the 288 level, acting as a key neckline that's been tested and established over multiple sessions. This isn't just a single pattern at play — it's a combination of several overlapping structures across different perspectives.
🔍 Pattern perspectives observed:
Cup & Base
Cup & Handle
Inverse Head and Shoulders
Multi-VWAP Support Zones
Each pattern aligns differently, but all converge around the 288 price level, making it a critical zone of structural importance.
📊 Supporting momentum and confirmation signals:
RSI has broken above the zero line, showing clear buyer strength
Awesome Oscillator (AO) signals a strong reaccumulation phase
Price has successfully broken out above the 294.86 resistance zone, indicating a shift in trend
Multiple timeframes (2m to 4H) are in full alignment with Buy signals
💬 Conclusion:
TSLA is entering a potential breakout phase, driven by a powerful confluence of technical patterns all meeting at the 288 neckline. With momentum confirmed and buying pressure in control, the probability of TSLA rallying from 288 toward the 360 zone is notably high.
Disclaimer:
This analysis is for informational and educational purposes only and does not constitute financial advice. Trading stocks involves significant risk, and you should only trade with funds you can afford to lose. Always do your own research or consult with a licensed financial advisor before making trading decisions.

Tesla May 9th 2025 this is a follow-up on Tesla it just made a minor new high and now it's going to expand and go a lot higher.

TSLA double bottomAlthough very bad bad last quarter report regarding the Revenue, TSLA in terms of technical analysis has just made double bottom and has broken a critical price range of 270.
Calculated risk of 5-10% of the portfolio can be good for this trade imo, however looking for a strong buy signal that is supported by buying volume.

"Mastering Trend Confirmation: From Structure to RSI with ALGTP 📌 Custom RSI & Structure Sync with Quantum – How We Analyze with ALGTP
Many traders use different versions of RSI—and that’s totally fine. But with the custom-built RSI in the ALGTP system, we’ve synchronized it with our Quantum Zones and Market Structure, allowing for:
Clear identification of solid Support and Resistance zones—no more second-guessing when price is at a key level.
Accurate detection of reaction zones (R1, R2)—so you won’t jump into trades blindly.
🎯 How It Works in Practice:
✅ 1. RSI Is More Than Just RSI
The ALGTP RSI is integrated with Quantum Cloud and Price Structure.
When RSI hits R1 or R2 without a valid breakout signal → stay out of the trade.
If you're already in → always set a stop loss when you're within R1 or R2 zones.
✅ 2. Watch for "Open" on Quantum Structure
If you see a label called "Open" on Quantum, that means the structure is resetting back to the origin (zero).
At this stage, avoid making early bias calls—wait for AO and RSI to align before reacting.
✅ 3. Use AO & RSI Together to Define Zones
If AO turns flat/sideways (purple bars), and RSI moves into the neutral zone, it signals no momentum—a potential breakout or breakdown zone.
If a breakout happens, RSI will blast through R1, and the system will automatically establish new targets via Quantum.
🔁 4. Final Trend Check: Always Return to the 15-Minute Timeframe
After scanning the higher timeframes (1H, 4H, etc.), come back to the 15-minute chart for confirmation:
If price action is above the 15m Confirmation Trigger → the overall trend remains bullish.
If price closes below Confirmation → the entire multi-timeframe structure flips to bearish.
⚠️ Key Takeaways:
⚡ Seeing R1/R2 without AO + RSI confirmation? → No entry.
⚡ Seeing “Open” on Quantum? → Structure is resetting—be patient.
⚡ Always finish with a 15m check to validate or reject higher timeframe bias.

Tsla Look GoodTsla 294 first resist but I can see it pass 300. IMO. clean break and held with volume once rest

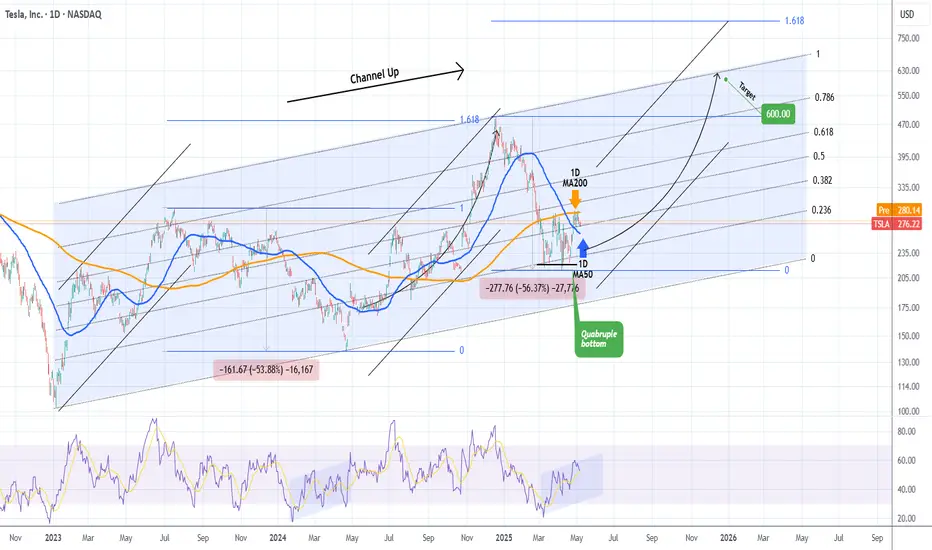
TESLA Is a $600 price tag a pipe dream?Tesla (TSLA) is seeing a steady recovery from the April 21 2025 Low, which has been a Quadruple Bottom, and has found itself consolidating the last 10 days within the 1D MA200 (orange trend-line) and the 1D MA50 (blue trend-line).
The 2.5 year pattern is a Channel Up and this Quadruple Bottom took place exactly on its 0.236 Fibonacci level, with a 1D RSI sequence that resembles the Bullish Divergence of its previous bottom on April 22 2024. The similarities don't stop there as the Bearish Legs that led to those bottoms have almost been identical (-53.88% and -56.37% respectively).
As a result we can technically assume that the current Bullish Leg that will be confirmed with a break above the 1D MA200, will be symmetrical to the previous one, which made a Higher High on the 1.618 Fibonacci extension from the bottom. That is now at $823 but falls outside of the 2.5-year Channel Up, so our long-term Target for the end of the year is $600, which is right at the top of the pattern.
-------------------------------------------------------------------------------
** Please LIKE 👍, FOLLOW ✅, SHARE 🙌 and COMMENT ✍ if you enjoy this idea! Also share your ideas and charts in the comments section below! This is best way to keep it relevant, support us, keep the content here free and allow the idea to reach as many people as possible. **
-------------------------------------------------------------------------------
💸💸💸💸💸💸
👇 👇 👇 👇 👇 👇
An Example Of How To Trade When You Live A Busy LifeIn this video, I demonstrate a swing trading approach that requires very little time in your day.
This type of trading, using limit orders, allows you to locate a strategy set-up, place your order in the market, set an alert, and then just let the market do it's thing.
I hope it's insightful!
The Meditrader


Tesla - TSLA - moving to $328 Step on up, buy your July Tesla $330 calls! Right here folks, step on up!
Tesla about to surge, what will the NPC News say is the reason? Tariff Deal?
GO Murrey
GO Elliott
GO Gann
GO Kumar

$acmr has the same price action as $tesla did a few months agoIt Wouldn't suprise me if ACMR research would break out in the coming months out of the inverted H&S pattern!

$TSLA NASDAQ:TSLA Outlook:
Tesla remains at an attractive price level. Bullish momentum may continue, driven by Elon Musk’s strategic satellite investments via Starlink. Additionally, steady Cybertruck demand and advancements in autonomous technology projects are supporting long term growth potential.
Tesla Target: $1500Tesla Mega Setup Alert
NASDAQ:TSLA is forming a rare double cup & handle on monthly chart
Accumulation phase ending
Entry zone: $270–280
Target: $1500–$2000 in 2 years
10x potential if structure plays out!
Don't blink 👀
#Tesla #TSLA #ElonMusk #StockMarket #Investing

TSLA Setting Up for a Big Move?🔎 Big Picture (1D Chart)
TSLA had a solid bounce off that $138–$140 range back in April, and we finally got the trendline break to the upside. But right now… we’re kinda pausing. Price stalled below $280, and the MACD looks like it's rolling over a bit. Also noticed Stoch RSI curling down — not great if you're expecting momentum continuation.
We’re sitting in this tight range just above prior structure — it feels like the market is waiting for something.
🕒 Zooming In (1H Chart)
1H shows a bit more chop than I’d like. There’s clearly some pressure under $278 and buyers haven’t stepped in aggressively. That trendline break we had from April is still valid, but price is walking sideways. Kinda reminds me of distribution vibes unless we reclaim that $284–$286 area quick.
MACD is flat, and Stoch RSI bounced from oversold but isn’t convincing just yet.
🧠 Options Flow + GEX Insight
This is where it gets really interesting…
* Gamma Wall / Call Resistance: $297.50–$300 is the GEX lid. Tons of calls stacked there — if TSLA starts squeezing, that’s the magnet.
* PUT walls: Strongest net negative GEX is at $270, followed by $260. That makes $270 my short-term line in the sand — if we lose it, volatility probably spikes fast.
* HVL (High Volume Level): Lined up with $275–$278 zone. That’s right where price is dancing now.
💡 So the GEX map shows we’re trapped between a wall and a floor. Could be a coil before a breakout — or a fakeout flush before a rip.
💬 My Game Plan
Honestly, I'm playing this one day by day. Here’s how I’m thinking about it:
Scenario A – Breakout
* Entry: $285+ reclaim with volume
* Target: $297.50, then $300
* Options idea: Weekly 290C or 295C lotto if IV stays tame
Scenario B – Breakdown
* Entry: Below $270 with momentum
* Target: $260 zone
* Options idea: 265P or a debit put spread targeting $260 if VIX is friendly
Neutral Trade
* I might scalp inside this range ($270–$280), but it’s tricky. If I see chop, I sit. No reason to force it.
📌 Final Thought
TSLA looks like it’s prepping for something — we’re at a balance point between option pressure and fading momentum. If you’re a scalper, be nimble. If you’re swinging, this might not be the cleanest entry just yet. But when it moves, it’ll move fast.
Trade smart. Protect your capital.
This post is just my view — not financial advice. Do your own research and stay sharp out there!

TSLA daily trading (option)1. Key Level: TSLA was at a risky spot — it hit resistance and has been moving sideways, with about a 50/50 chance of going up or down.
2. Strategy Triggered: It dropped and then retested the 50 SMA on the H1 chart.
3. Pattern Observed: An uptrend breakdown.
➡️ I think TSLA could go up in the long term (next 1–2 weeks), but we might see a red candle tomorrow or Monday

Tesla Grabbing Liquidity Market Context 🚩
1-Month Move: +7.3% (from $261.30)
1-Year Move: +45.6% (from $192.50)
Technicals
RSI: ~68.4 (nearing overbought )
Moving Averages: Above 20-day, 50-day, and 200-day MAs (uptrend, but showing signs of exhaustion )
MACD: Bearish crossover forming (momentum fading, potential pullback )
Trade Setup
Instrument: TSLA ❌
Direction: PUT
Entry Price: $280.21
Take Profit 1 (TP1): $270.00 (~3.6% gain ) 🟢
Take Profit 2 (TP2): $260.00 (~7.2% gain ) 🟢
Expected Move: ~8–10% downward
Best AI Signals on the market.

TSLA Eiffel Tower Not CompleteEiffel tower patterns are rare but very powerful TA structures when they develop.
They are very hard patterns to short since we can never know when the wave up ends. However, there is so much information we can extract from them during and after the collapse.
When they are rising and going vertical, and you happen to be in it. The benefits will be great! As the price action sucks in everyone all at once with virtually no sellers.
So, what info can we learn?
On the way up, when this is happening, you should have the ability to recognize it at some point without worrying if you got the top. Take your money and RUN!
Never try to get back in and try to chase it up!
Never try to short it, thinking it is too high, this is the top!
When it tops out, never buy the dip! Bc you know how this structure will end.
Never buy based on some silly FIB or bc it's down too much!
Never buy the base thinking it will go back to new all-time highs, and it is now safe to get back in bc it will only keep going lower, more through time, frustrating you until you puke it up.
So remember this gimmicky sound bite.
"If they don't scare you out, they will wear you out!"
Ain't nobody got time for that! Your money has a much better place to be allocated to make you money instead of being fixated on a chart like this.
The reason people get stuck is bc the move provoked emotion! Then, when they get involved thinking they will be Buffett tomorrow from this one trade, they will experience Euphoria, sadness, anger etc., further provoking even more emotions to the point they become obsessed! Guessing, waiting, hoping, doubling down on and on...
Ask me how I know! hahaha!
While I made a lot of money shorting GME, here is an example of an Eiffel tower with many, many people that have this trading disease I just spoke about.
In conclusion, anyone who believes that TSLA will hit $1,000 blah blah blah and suckered into buying it. You now know you are being honey dicked by a bunch of armatures and bots on X. Beyond TSLA there are many such charts out there tight now that have formed the beginnings of ET. As such, you should know how to recognize it quickly and avoid the pitfalls out there.FYI I called the Top on TSLA ))
Click Like, Follow, Subscribe to learn much more about real macroeconomics and technical analysis. Let me help you navigate these crazy markets.

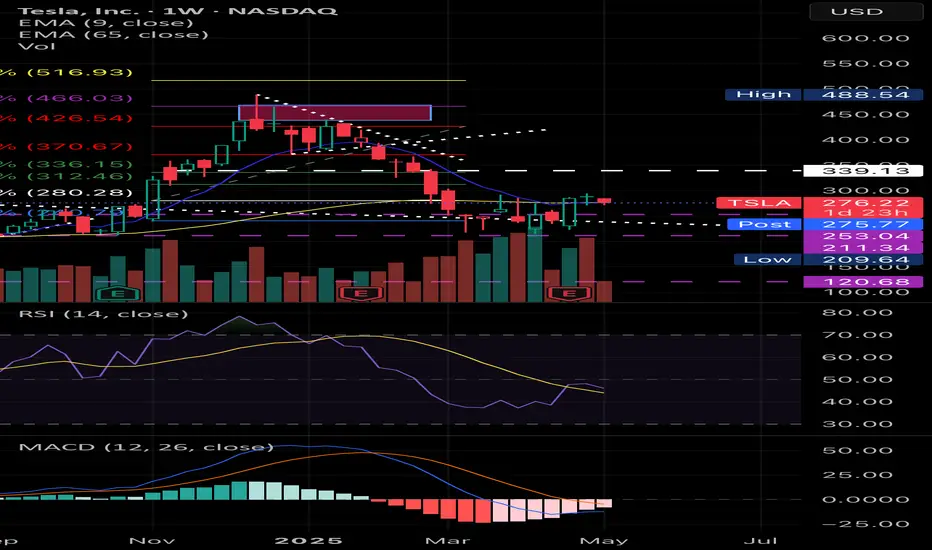
Is Tesla Running Out of Road?Tesla has been rangebound for the last two months, and some traders may think it’s running out of road.
The first pattern on today’s chart is the March high of $291.85. The EV maker peaked around the same level in late April and remains stuck there again in early May. That may suggest resistance is in place. Will traders look for a return to the recent lows under $220?
Next, the stochastic oscillator is turning down from overbought territory.
Third, the 50-day simple moving average (SMA) had a “death cross” under the 200-day SMA in mid-April. That may suggest its longer-term trend is getting more bearish.
Finally, TSLA is one of the most active underliers in the options market. (Its 2.7 million average contracts per day ranks No. 2 in the S&P 500, according to TradeStation data.) That may help traders take positions with calls and puts.
TradeStation has, for decades, advanced the trading industry, providing access to stocks, options and futures. If you're born to trade, we could be for you. See our Overview for more.
Past performance, whether actual or indicated by historical tests of strategies, is no guarantee of future performance or success. There is a possibility that you may sustain a loss equal to or greater than your entire investment regardless of which asset class you trade (equities, options or futures); therefore, you should not invest or risk money that you cannot afford to lose. Online trading is not suitable for all investors. View the document titled Characteristics and Risks of Standardized Options at www.TradeStation.com . Before trading any asset class, customers must read the relevant risk disclosure statements on www.TradeStation.com . System access and trade placement and execution may be delayed or fail due to market volatility and volume, quote delays, system and software errors, Internet traffic, outages and other factors.
Securities and futures trading is offered to self-directed customers by TradeStation Securities, Inc., a broker-dealer registered with the Securities and Exchange Commission and a futures commission merchant licensed with the Commodity Futures Trading Commission). TradeStation Securities is a member of the Financial Industry Regulatory Authority, the National Futures Association, and a number of exchanges.
Options trading is not suitable for all investors. Your TradeStation Securities’ account application to trade options will be considered and approved or disapproved based on all relevant factors, including your trading experience. See www.TradeStation.com . Visit www.TradeStation.com for full details on the costs and fees associated with options.
Margin trading involves risks, and it is important that you fully understand those risks before trading on margin. The Margin Disclosure Statement outlines many of those risks, including that you can lose more funds than you deposit in your margin account; your brokerage firm can force the sale of securities in your account; your brokerage firm can sell your securities without contacting you; and you are not entitled to an extension of time on a margin call. Review the Margin Disclosure Statement at www.TradeStation.com .
TradeStation Securities, Inc. and TradeStation Technologies, Inc. are each wholly owned subsidiaries of TradeStation Group, Inc., both operating, and providing products and services, under the TradeStation brand and trademark. When applying for, or purchasing, accounts, subscriptions, products and services, it is important that you know which company you will be dealing with. Visit www.TradeStation.com for further important information explaining what this means.

TSLA looks tired295 is seemingly the tough level. I was just praising TSLA for turning slightly bullish too. We rejected pretty hard Fri 5/2.
<285, 280, 275, 270... may even take out 265. I definitely think that TSLA is trying to hold the range and not breakdown. Stay conscious of each level if you are playing it and take profit.
FOMC Wed 5/7. I think that may determine a lot of opportunities for end of week.

Short on Tesla IncTesla has touched the 200 moving average on three separate occasions in conjunction with the nasdaq remaining below the 200 moving average therefore I placed shorts for Tesla and the Nasdaq with stop losses slightly above the 200 day moving average. The risk to reward is potentially significant. Let's see what the outcome is!

TSLA to 370?This is one scenario for the stock, I think this can play. A recovery testing the 0.618 fib level.

Why I'm not holding Tesla Tesla was dropping! I got in at around 220. However, within three weeks, I sold for a small profit.
BUT, why did I sell? This is why I'm not holding NASDAQ:TSLA
It's time to buy!
From a technical and historical point of view, buying Tesla right now makes perfect sense. The stock has a history of making significant price gains, is currently oversold, and is testing key support areas, such as the monthly 50 SMA.
A trader or investor who is 100% technical-based, this stock looks like a dream.
However, all the hype hits the floor when the fundamentals are considered...
Meh...
✔ The company has been increasing sales and cash year-on-year until recently
✔ Tesla has plenty of cash and assets. A simple acid test ratio shows liabilities vs. assets around 1:2.
❌ The issue is profit. Both gross and net profit margins have been falling year-on-year. The net profit margin is down from 15% two years ago to 7% last year.
❌ Worse, the current forecasts predict decreased sales and other key financials.
Poor and worsening financials are a clear red flag when buying stocks. Stay away. No matter how appealing the price looks.
Don't get me wrong, I don't think Tesla is doomed, and it may still yield returns. However, I would not be surprised if the stock consolidates or moves lower from here. For me, Tesla is not the significant buy it once was.

Market appears supportive of Tesla's growth prospects**Direction:** **LONG**
**LONG Targets:**
- **T1 = $287.50**
- **T2 = $295.25**
**Stop Levels:**
- **S1 = $275.00**
- **S2 = $268.75**
---
**Wisdom of Professional Traders:**
This analysis synthesizes insights from thousands of professional traders and market experts, leveraging collective intelligence to identify high-probability trade setups. The wisdom of crowds principle suggests that aggregated market perspectives from experienced professionals often outperform individual forecasts, reducing cognitive biases and highlighting consensus opportunities in Tesla.
**Key Insights:**
Tesla continues to dominate the EV sector with substantial global market share and expanding demand across multiple territories. It has consistently outperformed competitors by innovating battery technologies and ramping up production capabilities. Recent improvements in cost efficiency and scaling production have reinforced positive outlooks from traders. Key focus areas include Tesla's development of its 4680 battery production and advancements in energy generation/storage, further suggesting a long-term competitive edge.
The broader market appears supportive of Tesla's growth prospects, particularly with EV subsidies and green energy initiatives in major economic regions. Tesla's brand recognition and consistent product releases continue to draw consumer attention, while strategic efforts like the buildout of gigafactories globally are seen as favorable catalysts for sustained revenue expansion.
**Recent Performance:**
Over the last week, TSLA has displayed steady consolidation and formed a strong technical base approximately near $280. This stability follows a significant bullish rally earlier in the month, and the stock now appears poised for a continuation to test resistance levels. Technical indicators such as the Relative Strength Index (RSI) remain within neutral-to-positive territory, while moving averages support the potential for upward trajectory amidst firm buying support.
**Expert Analysis:**
Analysts broadly expect Tesla to capitalize further on its technological leadership in the automotive market. Hedge funds and institutional investors have shown significant interest in maintaining long positions on Tesla due to growth-driven profitability and aggressive expansion. Experts view Tesla's ability to scale its production and integrate advanced AI technologies into the manufacturing process as differentiating factors in the industry.
Tesla's Q3 production and delivery targets have received favorable feedback, aligning with expectations of robust growth narratives. If global macroeconomic pressures ease, Tesla could benefit further from optimistic market dynamics, broadening its appeal among investors.
**News Impact:**
Tesla's recent progress in scaling production at its factories and updates on the highly anticipated Cybertruck have sparked renewed confidence in the company's product lineup and potential market penetration. News regarding expansions into new territories coupled with strategic collaborations in energy storage solutions bodes well for long-term growth. Positive sentiment in this area tends to support the general bullish narrative among professional traders and market participants.
**Trading Recommendation:**
Tesla exhibits strong fundamentals and resilient technical qualities conducive to a long play this week. Professional trader consensus supports a bullish stance, further backed by favorable news impacts and sustained market demand for Tesla vehicles and innovations. Maintaining stops near broader support levels while aiming for gradual upward price targets is recommended to balance risk and reward. Consider this a solid long opportunity for near-term price advancements.
