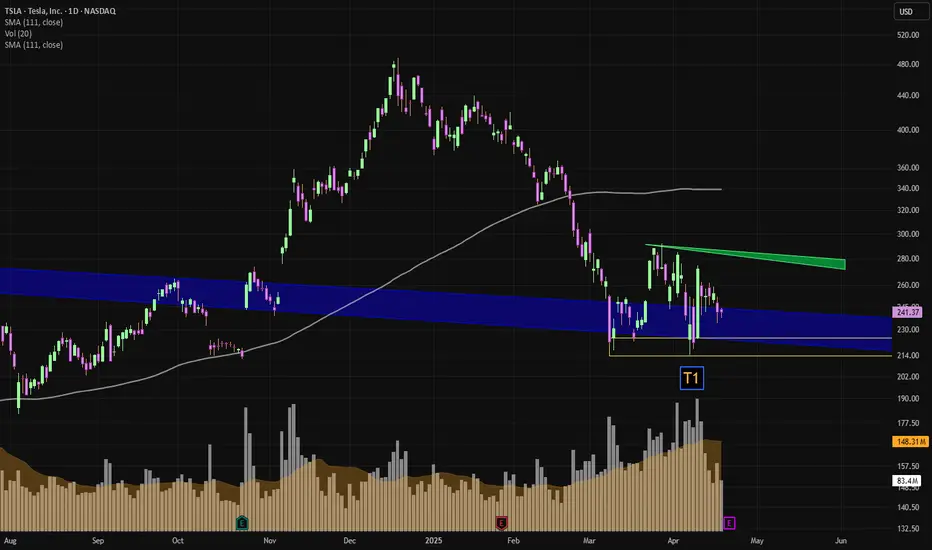
TSLA Setting Up for the Next Big Move?🚘Tesla's been cooking up some serious price action — and now it’s getting interesting. After holding above key supports, bulls might be eyeing their next shot. Here’s the plan I’m watching:
📥 Entry zones:
• 240 (aggressive)
• 215 (ideal support zone)
• 195 (deep discount territory)
🎯 Profit targets:
• 265
• 290
• 355+ (if momentum takes off)
TSLA has been showing signs of accumulation — and if buyers step in near 215–195, we could be looking at the early stages of a powerful move. Of course, nothing is guaranteed. The EV space is competitive, and macro volatility can flip the script fast.
🔍 Keep an eye on volume, trend confirmations, and news that could push sentiment one way or the other.
⚠️ Disclaimer: This is not financial advice. Just sharing my personal analysis and trade idea. Always do your own research and manage risk according to your own strategy.
TSLA trade ideas

TESLA: Expecting Bullish Continuation! Here is Why:
The analysis of the TESLA chart clearly shows us that the pair is finally about to go up due to the rising pressure from the buyers.
❤️ Please, support our work with like & comment! ❤️

TSLA Elliott wave Analysis 20/4/2025For me, I think that TSLA have already End the Cycle (count from the first day TSLA is IPO).As you can see there is a clear divergence at the wave 5 of the A wave,suggesting that A wave of the corrective wave should be end and ready for the huge B wave that might take a lot of time (Since it is the B wave of the massive wave 2).But there is a change that the wave A that is coming down might be the part of WXY pattern or others pattern so we have to keep an eye on.

We potentially about to see a HUGE move on TSLAWe broke a SUPER LONG-TERM BEARISH TRENDLINE (blue) on the weekly timeframe.
+
We have been RANGING for quite some time...
+
TSLA has a personality of explosive, crazy moves
+
TSLA builds HUMAN ROBOTS... (SUPER HIGH VALUE in my opinion, the potential for this is astronomical)
What do we actually need for this move to materialize?
We need the market in our favor.
Lets see if the market will push strongly up or bleed down.
Please also note that before explosive move previously that no one believed it would happen, the earnings reports of TSLA were RED the same as now.
ALWAYS MAKE SURE YOU MANAGE YOUR RISK.
TSLA Weekly Options Trade Plan 2025-04-17TSLA Weekly Analysis Summary (2025-04-17)
Below is an integrated analysis of the reports and market data:
──────────────────────────────
MODEL REPORTS – KEY POINTS
• Grok/xAI – Price and moving averages on both 5‑min and daily charts are below key EMAs; RSI and MACD point to current bearish momentum. – Notable technical support at about 239.75 with resistance above near 242. – The options chain shows heavy put activity at the $240 strike (premium about 0.67), and max pain is at 245, although that level is less relevant for a near‐term (0DTE) trade. – Recommendation: Trade the TSLA $240 PUT at an ask of 0.67 at the open, aiming for roughly a 100% gain and using about a 50% loss as a stop.
• Gemini/Google – Technicals on short‐term and daily timeframes are mixed: the daily chart is clearly bearish while some 5‑min indicators hint at stabilization. – Conflicting signals (including the max pain pull toward 245 and falling VIX) result in not having a high‑conviction directional bias. – Conclusion: “No trade” is recommended today because the conflicting indicators raise the risk of getting whipsawed.
• Claude/Anthropic – Technical analysis on both 5‑min and daily confirms a moderately bearish bias (price well below major EMAs, RSI below 50). – However, one suggested trade was a TSLA $237.50 PUT at an extremely low premium (0.13) which seems less attractive given the preferred premium range. – In essence, the model sees downside potential but selected a strike a bit further out from the current price.
• Llama/Meta – A moderately bearish setup is noted, with the technical picture similar to the others on very short‐term charts. – However, the model also flags the influence of max pain at 245 and concludes that a naked call (for example, at the $240 or $242.50 strike) could profit if the upward “max pain pull” works in play. – Ultimately, this view contrasts with the put trades favored by others.
• DeepSeek – Confirms the overall technical picture: price is below key averages, with bearish momentum evident on both 5‑min and daily charts. – Emphasizes the high open interest on $240 puts and the near-term support at 239.75. – Recommends buying the TSLA $240 PUT at its 0.67 ask price for this weekly (0DTE) option. ────────────────────────────── 2. AREAS OF AGREEMENT AND DISAGREEMENT
Agreements: – Most reports note that TSLA is trading in a moderately bearish state with price below the relevant moving averages and key support levels near 239.75. – There is broad recognition that options activity is concentrated around the $240 strike—especially on the put side, where volume and open interest are very high, underscoring bearish positioning. – Technical indicators (RSI, MACD, Bollinger Bands) on short‑term and daily charts lean toward bearishness despite some very short‑term signals of stabilization.
Disagreements: – Gemini/Google sees too many conflicting signals (including the upward pull implied by max pain) and hence recommends no trade, while the majority of the other analysts view the setup as tradeable. – Llama/Meta is open to trading a naked call (capitalizing on the max pain influence) whereas Grok/xAI, DeepSeek, and to a lesser degree Claude/Anthropic advocate for a bearish put trade instead. ────────────────────────────── 3. CONCLUSION & TRADE RECOMMENDATION
Overall Market Direction Consensus: Most opinions point to a moderately bearish bias for TSLA on a near-term, 0DTE weekly horizon. Even though conflicting signals (like max pain toward 245 and some stabilization on very short timeframes) introduce uncertainty, the weight of the technicals and put side open interest lean toward downside pressure.
Recommended Trade: Trade a single‑leg, naked PUT (weekly option) on TSLA.
Trade Parameters: – Instrument: TSLA – Strategy: Buy a TSLA $240 PUT – Expiration: 2025‑04‑17 (weekly, 0DTE) – Premium: Approximately $0.67 per contract (slightly above the preferred range, but justified by high liquidity and clear technical support) – Entry Timing: At the open – Profit Target: Around 100% gain from the entry premium (i.e. exit near a $1.34 premium) – Stop‑Loss: Roughly a 50% loss at about $0.33 per contract – Confidence Level: Approximately 65% – Key Risks & Considerations: • The mixed signals (especially Gemini’s caution and the max pain theory) mean price could quickly reverse if TSLA rebounds near 245. • Very short‑term trading (0DTE) carries risks related to rapid time decay and volatility spikes. • A failure to break important support (around 239.75) would warrant an early exit. ────────────────────────────── 4. TRADE_DETAILS (JSON Format)
{ "instrument": "TSLA", "direction": "put", "strike": 240.0, "expiry": "2025-04-17", "confidence": 0.65, "profit_target": 1.34, "stop_loss": 0.33, "size": 1, "entry_price": 0.67, "entry_timing": "open" }
Disclaimer: This newsletter is not trading or investment advice but for general informational purposes only. This newsletter represents my personal opinions based on proprietary research which I am sharing publicly as my personal blog. Futures, stocks, and options trading of any kind involves a lot of risk. No guarantee of any profit whatsoever is made. In fact, you may lose everything you have. So be very careful. I guarantee no profit whatsoever, You assume the entire cost and risk of any trading or investing activities you choose to undertake. You are solely responsible for making your own investment decisions. Owners/authors of this newsletter, its representatives, its principals, its moderators, and its members, are NOT registered as securities broker-dealers or investment advisors either with the U.S. Securities and Exchange Commission, CFTC, or with any other securities/regulatory authority. Consult with a registered investment advisor, broker-dealer, and/or financial advisor. By reading and using this newsletter or any of my publications, you are agreeing to these terms. Any screenshots used here are courtesy of TradingView. I am just an end user with no affiliations with them. Information and quotes shared in this blog can be 100% wrong. Markets are risky and can go to 0 at any time. Furthermore, you will not share or copy any content in this blog as it is the authors' IP. By reading this blog, you accept these terms of conditions and acknowledge I am sharing this blog as my personal trading journal, nothing more.

THE DEATH CROSSDeath Cross Triggered During Consolidation: What It Could Mean
The 50 SMA (blue) just crossed below the 200 SMA (red), signaling a Death Cross—a traditionally bearish indicator. But here’s the catch: this didn’t happen during a steep downtrend. It happened during consolidation.
That changes the narrative.
When a Death Cross forms during a period of sideways chop instead of a clear downtrend, it often reflects lagging momentum, not accelerating weakness. It can trap shorts expecting a breakdown, especially if price is coiling above strong support or forming a basing pattern.
💡 Key things I’m watching:
Does price respect the consolidation range low?
Are we forming a bullish divergence on RSI or MACD?
How does volume behave around the cross?
This may not be a "short and hold" moment—this might be a shakeout before trend resolution. Stay sharp. Don't trade the cross, trade the context.

TESLA | Monthly Analysis After NASDAQ:TSLA hitting its ATH target, 87% - 90% retracement is next target
start of 2027 = will be a buying signal for tesla unless there's some issues involving with Elon Musk, then tesla could experience under performance
Long term investors - prepare for down side inside buying channel

TESLA | Weekly HTF TargetAfter having a deep retracement ~70% tesla looks ready to reach Higher Highs...
New High target: $490+

sharktrade the big jaws recommands you to short tesla hi community viewers here my analyse before tesla earnings release , has compagny will face big challenge with china challenger BYD, i bet for a bif dump of earnings on 22/04

TSLA Diamond Penet BreakoutThe "TSLA Diamond Penet Breakout" strategy suggests monitoring two critical levels: if Tesla's stock price breaks below the "red" level, it indicates a short position opportunity; conversely, breaking above the "green" level suggests taking a long position. This strategy also forecasts a potential 3% price movement following a breakout in either direction, emphasizing the importance of these defined thresholds for trading actions .

TSLA - Double Top To Stronger Trend LineA long term trend line going to be tested as a result of a large double top forming
I expect price to rebound very strongly from this long term green trend line
Short - mid term bearish
Long term very bullish
Weekly timeframe

TSLA sideway then downTSLA sideway up a little bit then turn down.
Maximum target price this time soon $299.29. Because the volume so high.
But in frame Day, MA50 start cross down with MA200. TSLA will in correction.
At least will go back to $214.25.
IMO amateur trader.

Hold TeslaTesla's shares are no longer excessively expensive, but they are still not cheap. 😅
Hopefully, we can see the price closer to $240 amid all the negativity. 🤞📉

TESLA BULLISH 14th April 2025Do not blindly trade anything without maanging your risk.
If market supports then I am expecting a green candle in Tesla.
Again please do not blindly trade anything ever. Hope this helps and yes I am long

TSLA 4H Analysis: Technical Outlook1. Price Structure and Trend:
TSLA has been in a clear downtrend since January 2025, dropping from ~$475 to a key support at ~$258. The price is currently consolidating at this level, hinting at a potential pause or reversal.
2. Support and Resistance Levels:
• Support: $258 (current level, with multiple bounces).
• Resistance: $300 (next significant zone, based on prior consolidation).
3. Volatility and Squeeze Indicators:
The "Volatility Squeeze" indicator (on the right) shows red and blue bars. Recent red bars signal a squeeze (low volatility), often preceding sharp moves. The shift to blue bars suggests volatility may be increasing.
4. Action Signals:
• "X" markers (blue and orange) highlight potential entry/exit points. Recent orange "X" marks at the $258 support could indicate a buying opportunity if the price confirms a bounce.
• If support breaks, the next level to watch is ~$225 (previous lows).
5. Conclusion:
TSLA is at a critical juncture. A bounce from $258 could target $300, but a breakdown might lead to $225. Keep an eye on volume and volatility for confirmation. What's your take?
Here is the link to the indicator

TSLA at a Crossroad: Can 252 Hold or Will It Crack?🔍 Technical Analysis (1H Chart Overview)
TSLA has formed a symmetrical triangle, compressing between an uptrend and a downtrend line. Price is hovering right near the apex, with a key horizontal level at $249.89, where it's showing indecision.
* Support levels:
* $239.67 → Previous demand zone
* $217.11 → Major swing low and last defense for bulls
* Resistance levels:
* $257.85 → Overhead rejection zone
* $276.91 → Major gamma wall and swing high
Volume is thinning out as price coils tighter, suggesting a breakout is imminent.
The RSI is neutral around 50, slowly curving upward, signaling slight bullish momentum building, but no confirmation yet. Price is consolidating on declining volume, which is often a pre-breakout setup.
🔧 Trading Bias:
Watch for breakout above $253 for potential long play toward $258–$265.
Breakdown below $249 flips bias bearish, with a retest of $239 then $230 likely.
⚙️ GEX Option Flow Insights
GEX data shows concentrated gamma resistance at $275–$280, with the highest positive NETGEX sitting right at $275 — that's our Gamma Wall. Above that, market makers become forced buyers, creating a squeeze scenario.
On the downside, there’s a strong PUT wall around $220 and $200, with -50.27% NETGEX at $200 acting as deep support.
Notably:
* IVR: 67.2
* IVx Avg: 108.9
* Call Flow: 15.2%
* GEX Sentiment: ☘️☘️🟢 (Bullish tilt, but not maxed out)
💡 Options Strategy Suggestion:
Consider a debit call spread if price breaks $253 with volume, targeting $265–$275.
If price breaks $249, put debit spreads to $230–$220 could offer solid reward.
🧠 Final Thoughts
TSLA is a coiled spring, and both TA and GEX show we’re at a key decision point. Let price tell you the story — react to breakout or breakdown. Gamma positioning offers high reward potential in both directions.
📌 Stay nimble, plan both scenarios, and use options to your advantage.

Tesla Long Longseems like we are done with those lower prices; this week´s target is $305.
as you can see the SL and TP
GL

Quantum's TSLA Trading Guide 4/13/25Sentiment: Neutral. EV and AI optimism persists, but tariff risks and high valuation concern traders. Chatter split—bulls eye robotaxi, bears see pullback.
Outlook: Neutral, slightly bearish. Options pin $250, with $240 puts active. ICT/SMT eyes $245-$250 buys to $260 if $245 holds. Bearish below $245 risks $240.
Influential News:
Federal Reserve: Two 2025 cuts support growth stocks, positive for $TSLA.
Earnings: Q1 due late April; no update today.
Chatter: Debates tariff impact vs. AI/EV growth.
Mergers and Acquisitions: None; focus on internal projects.
Other: Tariff volatility hit NASDAQ:TSLA ; stock swung (April 3-9).
Indicators:
Weekly:
RSI: ~50 (neutral).
Stochastic: ~45 (neutral).
MFI: ~40 (neutral).
SMAs: 10-day ~$255 (below, bearish), 20-day ~$260 (below, bearish).
Interpretation: Neutral, bearish SMAs signal weakness.
Daily:
RSI: ~48 (neutral).
Stochastic: ~50 (neutral).
MFI: ~45 (neutral).
SMAs: 10-day ~$255 (below, bearish), 20-day ~$260 (below, bearish).
Interpretation: Neutral, bearish SMAs suggest pullback.
Hourly:
RSI: ~45 (neutral).
Stochastic: ~55 (neutral).
MFI: ~50 (neutral).
SMAs: 10-day ~$255 (below, bearish), 20-day ~$260 (below, bearish).
Interpretation: Neutral, stabilizing.
Price Context: $252.31, 1M: +1%, 1Y: +38%. Range $240-$270, testing $250 support.
Options Positioning (May 2025):
Volume:
Calls: $260 (15,000, 60% ask), $270 (12,000, 55% ask). Mild bullish bets.
Puts: $240 (10,000, 70% bid), $245 (8,000, 65% bid). Put selling supports $245.
Open Interest:
Calls: $260 (40,000, +7,000), $270 (30,000, +5,000). Bullish interest.
Puts: $240 (25,000, flat), $245 (28,000, +4,000). Hedging. Put-call ~1.0.
IV Skew:
Calls: $260 (40%), $270 (42%, up 3%). $270 IV rise shows upside hope.
Puts: $240 (35%, down 2%), $245 (36%). Falling $240 IV supports floor.
Probability: 60% $240-$270, 20% <$240.
Karsan’s Interpretation:
Vanna: Neutral (~300k shares/1% IV). IV drop could pressure $250.
Charm: Neutral (~150k shares/day). Pins $250.
GEX: +50,000. Stabilizes range.
DEX: +7M shares, neutral.
Karsan view: GEX holds $240-$270; tariff news key.
ICT/SMT Analysis:
Weekly: Neutral, $240 support, $270 resistance. No $TSLA/ NYSE:NIO divergence.
Daily: Bullish at $250 FVG, targets $260. Bearish < $245.
1-Hour: Bullish >$250, $260 target. MSS at $245.
10-Minute: OTE ($249-$251, $250) for buys, NY AM.
Trade Idea:
Bullish: 50%. ICT/SMT buys $245-$250 to $260. Options show $260 calls. Fed cuts aid.
Neutral: 35%. RSI (~50), SMAs (bearish), $240-$270 range.
Bearish: 15%. Below $240 possible with tariffs. $240 put volume grows.

Dageedoo Follower Request $TSLA close up #Internals You saw how this very similar W/double bottom on #61fib worked out on AAPL... This is a 50% retrace W... I prefer #61 retraces, but with TSLA im not surprised with some extra volatility. Go with the flow... 186 first level to break, 198 next stop. then if strong enough hammer on 198 200 critical level breaks 10+ and youre at 220 like AAPL hit and people profit take.
Below redline or Diamond mid point (176) idea is DEAD.
LESSON TIME; Critical level breaks can bring quick moves 10-20% in a few days. I'm always "eyeing" critical levels on "Big Name/Mega Cap" stocks... ie; FB 500+ , would you believe me if I was "eyeing" AVGO under 1500... you wouldve caught splits on that n NVDA with critical levels in mind (1000 crit level for NVDA)... 3 big stocks all breaking through with these methods is not as strong as some might think, short term yes, long term questionable. Not everything is a critical level/ price "number" and markets psychology help determine these, usually round, usually act as resistance or support prior, see AAPL W... 1 2 3strikes then through at the old stock game...
LESSON CONT; I have a very unique set of tools. Tools I have acquired over many years. Tools that make me a nightmare for women who want a man with a "normal" job. Tools like Fibonacci Retracements, Technical Patterns, RSI, Stoch, Multiple Timeframes (3Day is my fav), and Bollinger Bands with MAs. Be sure you find your own trusted tools. Because I will be here, I will find the patterns, and I will execute them.
-Good Luck - Prof

TSLATSLA still have some upside, we will see the reaction above 295.
Disclosure: We are part of Trade Nation's Influencer program and receive a monthly fee for using their TradingView charts in our analysis.

Tisk Tisk TSLAShort thoughts on a neutral area. TSLA broke out of what appears to be bear flag to me. I also see an inverse cup & handle. We may attempt to retest and/or regain the channel. If we fail, 225-220 is my target. Demand zone marked. More journal notes this week to stay focused on the trade(s).
Bear Flag:
www.bapital.com
Cup & Handle:
www.investopedia.com
Inverse Cup & Handle ( from our very own Trading View):
youtu.be

TSLA resuming downtrend target the same 155TSLA weirdo
Monday will be a good day to load up on shorts again
Still target 155

GEX Analysis & Options “Game Plan”🔶 Short- and longer-term perspective in a high IV, negative GEX environment
🔶 KEY LEVELS & RANGES
Spot: 221
Gamma Flip / Transition: around 250 (the turquoise zone on the chart)
– This zone typically marks a “power shift.” If price decisively breaks above 250 and holds, market makers’ gamma positioning could flip from neutral/negative to positive.
Put Support: 200
– A large negative gamma position has accumulated here, making 200 a strong support level. If it breaks, the downside may accelerate.
Call Resistance: 400
– A major long-term “call wall” where a significant amount of OTM calls are concentrated. It’s more relevant to LEAPS; currently far from spot, so not a realistic short-term target.
Call Resistance #2: 300
– A medium-term bullish objective, still above the 200-day MA. You’d need to be strongly bullish to aim for ~300 by May (e.g., going for a 16-delta OTM call).
Short-Term / Intermediate GEX Levels:
– There are gamma clusters around 220–230 and 250–260 . These areas often see higher volatility, possible bounces, or stalls (chop) due to hedging flows.
🔶 WHATEVER SCENARIO – SHORT TERM (0–30 DAYS)
A) Upside Continuation / Rebound
– If TSLA closes above 225–230 , the next target is 240–250 (transition / gamma flip).
– If it breaks above 250 and holds (e.g., successful retest), market makers may shift to “long gamma,” fueling a quicker move to 260–270 .
– Resistance: 250, 300, with an extreme LEAPS-level at 400.
B) Downside Move / Bearish Break
– If price dips below ~220 and sustains, the next targets are 210–200 (major put wall / negative gamma).
– If 200 fails, negative gamma may magnify the sell-off. It’s an extreme scenario but still on the table given high IV and macro/geopolitical risks.
– Support: 210, 200 — likely stronger buying interest near 200, possibly a short-term bounce.
– The options chain suggests near-term hedging via puts for this scenario.
C) Chop / Sideways
– If TSLA stays in 210–230 , market makers (short options) might benefit from high IV/time decay.
– Negative GEX, however, can trigger sudden moves in either direction; caution is advised.
🔶 LONGER-TERM FOCUS (6–12 MONTHS, LEAPS)
NET GEX = -61.97M (negative territory) suggests longer-dated positioning is also put-heavy or carries notable negative gamma.
HVL / pTrans = 250 is a key pivot; cTrans+ = 400 is distant call resistance. Between these levels, there’s a mix of put/call dominance.
If Tesla undergoes a fresh growth phase (AI, robotaxi, energy storage, etc.) and clears 250/300 , 400 could become the next significant call wall — but that’s more of a multi-month horizon.
🔶 STRATEGY IDEAS (High IV Environment)
1. Short-Term Bearish
– If you’re bearish and expecting TSLA to test 220–210, consider a bear put spread or net credit put butterfly (lower debit) to leverage high IV.
– Targeting 200, but keep in mind negative gamma may accelerate downside movement.
2. Medium-Term “Contra” Bullish (bounce to 250)
– If GEX suggests a bounce off 210–220, consider a bull call spread (e.g., 220/240) or a net debit call butterfly (220/240/250).
– Be mindful of sudden swings, as we remain in negative gamma territory.
3. Longer-Term Bullish (>3–6 months)
– A call butterfly with upper strikes around 300–350 offers capped debit and higher potential payoff if a bigger rally materializes.
– A diagonal spread (selling nearer-dated calls, buying further-out calls) exploits elevated front-end IV.
4. Neutral / Range-Bound
– If TSLA stays in 200–250 , you could use Iron Condors (e.g., 200/260) to benefit from time decay and any IV collapse.
– Exercise caution: negative gamma can generate abrupt, directional moves, making a neutral stance riskier than usual.
🔶 ADDITIONAL NOTES & “BIG PICTURE”
High IV & Negative GEX: TSLA has a track record of large swings. Negative GEX can intensify sell-offs, while forced hedging might trigger rapid rebounds.
Preferred Structures: With expensive premiums, spreads (vertical, diagonal) and butterfly configurations generally fare better than plain long options (less vulnerable to time decay).
Potential Catalysts: AI announcements, Autopilot breakthroughs, new product lines, and macro changes can swiftly alter market dynamics. Keep tracking GEX updates and news flow; TSLA tends to respond dramatically to fresh developments.
🔶 Bottom line: From 221 spot, watch 210–200 on the downside and 240–250 on the upside short term. Medium-term bullish target = 300 , while 400 remains a far LEAPS scenario. High IV + negative gamma = fast, potentially volatile moves — so risk management and spread-based approaches are crucial.
