Tesla Wave Analysis – 21 March 2025
- Tesla reversed from support level 220.00
- Likely to rise to resistance level 280.00
Tesla recently reversed up from the support zone surrounding the multi-month support level 220.00 (which has been reversing the price from September).
The upward reversal from the support level 220.00 stopped the previous impulse wave 5 of the intermediate impulse wave (C) from January.
Given the oversold daily Stochastic, Tesla can be expected to rise to the next resistance level 280.00.
TSLA trade ideas

$TSLA The Banks Stole My Stonkz..While NASDAQ:TSLA is quite good at manipulating their own shares, there are questions that need to be answered.
It has always been suspected that NASDAQ:TSLA has defrauded their investors and cooked the books. Finally there is evidence. 1.5 Billion missing from their balance sheet!?!?
Given Elon Musk's supreme affection for Hitler and his morbid stupidity, he continues to wage a psychological war against the public by executing high risk marketing ploys that finally bit him in the ass (Zieg Heil). This man should be fired.
None-the less we have technical to discuss here!
As you have seen we called the drip drop from the tippy top and pocket many dollars on this TSLA short. Right now what we are looking at a variety of targets NASDAQ:TSLA will hit one way or the other.
Not only are his own share holders against him, but Donald Trump decided to Implode the Economy and the stock market at a critical stage for his new Crony Musk. It is not a coincidence but all by design.
Last years open is 250.08 and we failed to close above that level today. While we can gap over this level it is more likely since we filled the gap and turned around that NASDAQ:TSLA in prime NASDAQ:TSLA fashion will reject and gap down right soon.
The market maker has left a wide open space to fill that ends at the trendline, thus wiping out all of the longs.
Then the banks foreclose on Musk NASDAQ:TSLA shares and Twitter below 110$ and this social media company will go back into the hands of the Deep State.
Lastly we have a quarterly gap fill and final target where NASDAQ:TSLA will find demand and resurge after Elon ahs been wiped from the face of the Earth around 20$.
With monthly momentum fiercely going negative and CCI breaking fresh into negative momentum territory it is sure to be a daaaaaaaam good show..
Get your popcorn ready boys. He fucked himself.

Tesla ready to bounce - Target 265Tesla formed a baby candle in the weekly. 252 is the previous resistance, but last 2 weeks had good lower wick and slightly bullish closing, indicating not much selling pressure. Price breaking 252 and sustaining shows a bullish reversal with short term target of 265.
The larger trend is still bearish, so I don’t expect another rally, but with Tesla, you never know

$TSLA Fibonacci is a HACK +118%MY bot doubled these CALLS today 0 DTE there is so MUCH POTENTIAL
Stop CHASING take THE PULL BACK ONLY! It will be FREE to anyone who LIKE this POST

TSLA Tesla 24hr potterbox.TSLA Tesla 24hr potterbox. Tesla is above the 50 percent line or cost basis. $229.43ish . it seems to be making small gains and it is making little accomplishments. lol this is just what I see with these potterboxes and other indicators I use to make trades. I usally go out 90 to 120 days. it just depends. I would like to see it make it to the roof $270.38 ish. the floor being 188.27ish. well lets hope it continues this little uptrend. It's $249.83 Ish. as I am writing this, and it could also go lower. This is just my opinion. Happy Trading.

How I Made $2.5 Million in One DayI will explain it all to you later. Has to do with the 2 hour candle at 12pm ET today and 3D candle as of today.
Love you all.

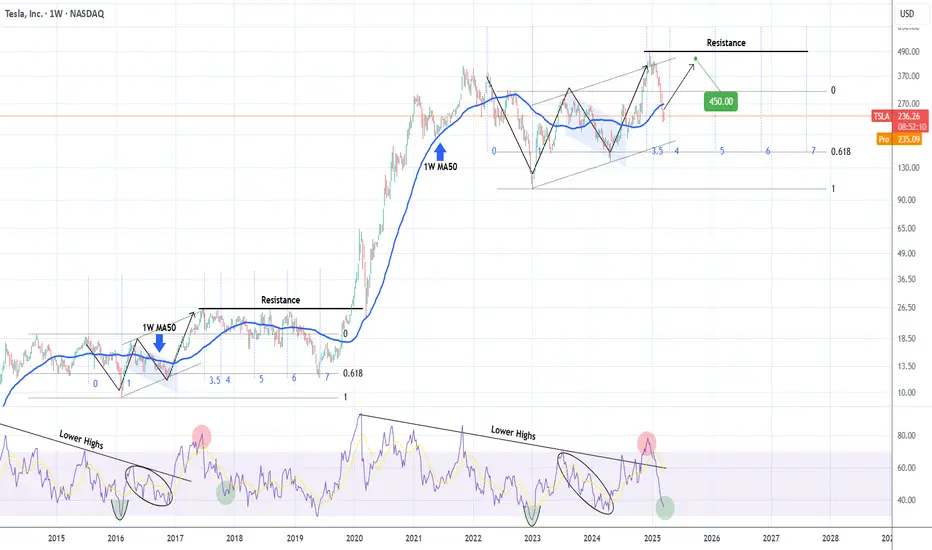
TESLA pricing its long-term bottom. $450 rebound highly likely.Nine months ago (June 26 2024, see chart below), we signaled the start of an enormous rally on Tesla (TSLA), which eventually hit our minimum Target ($400), based on a fractal from 2014 - 2016:
Since the upper 1.382 Fib Target wasn't achieved, the model is readjusted and this count makes better sense. Based on the 1W RSI we are on a bottom similar to October 30 2017 around the 4.0 Time Fib extension. That past sequence initiated a rebound towards the market Resistance before the next decline headed to the 5.0 Fib extension.
As a result, we believe Tesla will find a bottom here and target $450 just below the Resistance level.
-------------------------------------------------------------------------------
** Please LIKE 👍, FOLLOW ✅, SHARE 🙌 and COMMENT ✍ if you enjoy this idea! Also share your ideas and charts in the comments section below! This is best way to keep it relevant, support us, keep the content here free and allow the idea to reach as many people as possible. **
-------------------------------------------------------------------------------
💸💸💸💸💸💸
👇 👇 👇 👇 👇 👇
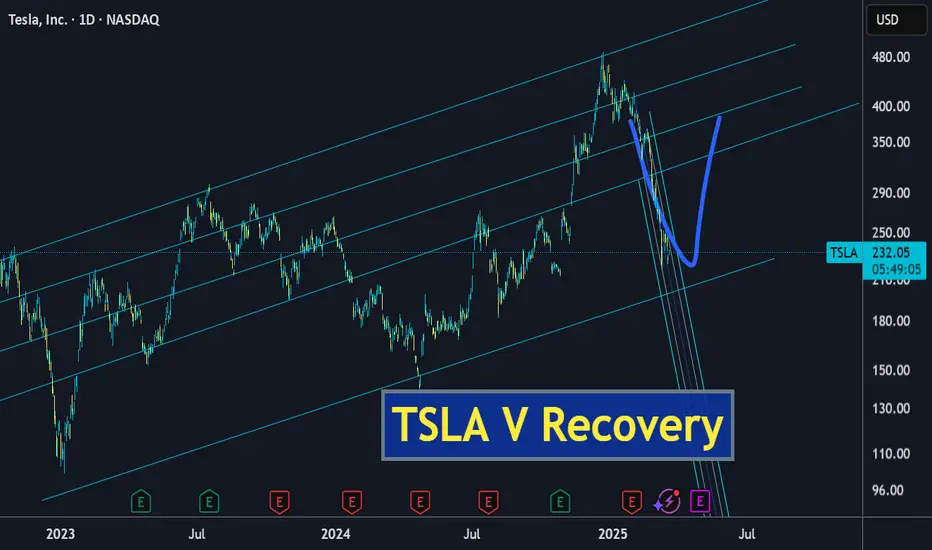
TESLA - EYES ARE LOCKED! TESLA - We are currently keeping a close eye here on Tesla, being at a key support level and seeing large Bullish Rejections. The market has been crashing for a while now and we've all heard the news regarding Trump investing into the company we can make a safe assumption TESLA will be a safe sturdy stock this year going to make new highs. For a Long Term Investment I would be investing into Tesla now. If you're looking for a swing then Im holding out until we get a break in Trend. This possible swing "could" be a potential 11,000 Point move. Could give you life change returns. EYES ARE LOCKED HERE GUYS! DO NOT MISS OUT

TSLA near-term Elliott wave projections(looks promising)If this is incorrect, i may have to restart learning from the beginning.
And if it does happen, it will happen in a matter of 2-3days time, at the same time get the stop loss ready.
Even if this wave analysis turns out to be completely wrong, we will still manage to find an entry on the uptrend.
Let's go!!

Tesla Near Term SpeculationBuilding on the flag formation from the past 3 years, its possible an rising wedge could form. Very early days and highly speculative, but if price plays out somewhat like my chart, an ascending wedge could form. Indicating that Tesla may have hit a near/mid term high and can't won't break through for a few years, with several implied price crashes going into 2026 and 2027.
Economic conditions and the apparent slow down in sales, would also support the technical analysis with macro fundamentals.
Very curious to see how things play out, again, highly speculative, just wanted to post to remind myself to keep and eye on this. The potential volatility is presenting interesting trades ahead.

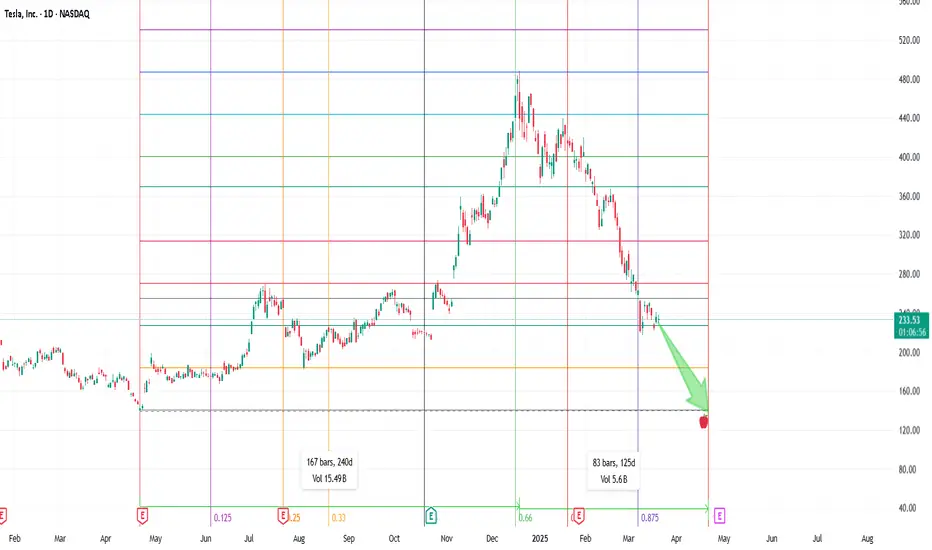
TESLA GOLDEN CHART ANALYSISI have analyzed Tesla with price & time square. I have considered Trend , chart pattern & Gann techniques. There is like chance that it will hit the low by 22-April 2025. Tesla is weak in Sales in last quarter. And in this quarter also number will be coming poor. Target is apple. This is for study purpose.
Insane R:R on Tesla BuysTesla has traded back to fill the gap that was left in October 2024 based on fundamental news and protests against the company.
Low risk opportunity at these levels.

TSLA: Buy opportunityOn TSLA, we have a great opportunity to develop a strong uptrend after the rebound off the support line, as you can see on the chart.
Furthermore, you can strengthen your long position after the breakout of the VWAP and Belkhayate Iceberg.
You should wait until all the analysis conditions are met before entering a position.

Damn, is this what TSLA trying to do? 170ish is the bottom?check this ABCDE correction there, is this for real? NASDAQ:TSLA

TSLA bound to return to its GLORY. SEED now at 230 !TSLA'S 2024 year has been a glorious one after surging 2x its valuation from 200 area on Q3 of 2024 to reach a parabolic ATH high of 485.
From there on, the stock has spiraled down -- since TRUMP inauguration.
Slashing half of its market cap from a 1.5T+ company to just 700B. Price suffered most on the market bloodbath from its ATH of 480 back to tappin its pre-surge base zone at 200 levels.
Now, things has become more or less calm. And red days has become saturated hinting of possible reversal play to the upside.
Significant net longs has been registered this past few days conveying heavy accumulation at the current price range of 200.
A double bottom has been spotted on our diagram showing a strong support of the price line.
Current price range is an ideal seeding zone for trade entries.
A rare bargain opportunity for that growth prospect -- and a retap of its glory days back at peak levels.
Spotted at 230.
Target ATH levels at 480.
TAYOR. Trade safely.

TSLA at a Pivotal Breakout! Will Bulls Take Control or Fake out?🔥Technical Analysis & Options Outlook
📌 Current Price: $239.92
📌 Trend: Bullish Breakout Attempt
📌 Timeframe: 1-Hour
🔹 Price Action & Market Structure
1. Bullish Momentum – TSLA is pressing against a descending trendline resistance, signaling a potential breakout attempt.
2. Break of Structure (BOS) Confirmed – Higher lows forming after strong demand at the $225 support.
3. Change of Character (ChoCh) Seen – Buyers are stepping in aggressively, but we need confirmation above $245 for a continuation.
4. Key Rejection Zone – $245–$252.50 CALL Resistance area could act as the first challenge.
5. MACD & Stoch RSI – Showing bullish momentum but nearing overbought levels, meaning a potential retracement before continuation.
🔹 Key Levels to Watch
📍 Immediate Resistance:
🔹 $245 – Key breakout level
🔹 $252.50 – Major CALL Resistance (likely profit-taking zone)
🔹 $260+ – Extreme CALL Wall & final bullish target
📍 Immediate Support:
🔻 $235.73 – Current breakout retest level
🔻 $225 – Strong demand zone & PUT Wall
🔻 $217 – Lower risk PUT Wall, deeper retracement zone
📊 Options Flow & GEX Sentiment
* IVR: 55.7 (Moderate Implied Volatility)
* IVx: 78.2 (-0.8%) (Volatility cooling off slightly)
* GEX (Gamma Exposure): Bullish ✅ ✅ ✅
* CALL Wall Resistance: $252.50 – $260 (Sell zones if price surges too fast)
* PUT Wall Support: $225 & $217 (High liquidity demand zones)
📌 Options Insight:
* Above $245, dealers may be forced to hedge by buying, leading to a possible gamma squeeze toward $252–$260.
* Below $235, risk increases for a pullback to $225 PUT liquidity zone before another bounce.
📢 My Thoughts & Trade Recommendation
🔥 Bullish Case: A breakout above $245 could trigger a short squeeze into the $252–$260 range.
⚠️ Bearish Case: If TSLA fails at $245 and retraces below $235, expect a dip to $225 for reloading opportunities.
🎯 Trade Idea (For Educational Purposes)
📌 Bullish Play:
🔹 Entry: Above $245 Breakout
🔹 Target: $252–$260
🔹 Stop Loss: Below $235
📌 Bearish Play (Hedge Idea):
🔻 Entry: Rejection at $245
🔻 Target: $225 PUT Wall
🔻 Stop Loss: Above $250
🚨 Disclaimer
This analysis is for educational purposes only and does not constitute financial advice. Always perform your own research and manage risk accordingly.
🔥 Final Thoughts: TSLA is at a crucial breakout zone. A strong move above $245 could send it soaring, while failure to break could trigger a rejection toward $225 before the next leg. Stay patient, trade smart! 🚀

TSLA Gap To CloseTesla has been purely on a drop lately. It looks like a base is trying to form and the squeeze is slowing. However, I do see a gap with open orders that needs to close around the $217 region. Let's see if it closes this before reversing back to a long position. Time will tell.

history doesn't repeat itself but it often rhymes! Tesla is retesting it's symetrical bull flag after breaking out, totally normal!
i think this wave 3 will be powerfull and leave some people in the dust. Especially those who sold due to some biased narrative.

TSLA- Drop to ~180, Rally to 350, Broadening WedgeTSLA- Drop to ~180, Rally to 350, Broadening Wedge.
RSI super low- think we get 1 more flush (perhaps April 4th labor data causes some market indigestion.

Tesla Has room for a little more downside-Bear Pennant forming
-Double Top that formed last week at around 250 broke below neckline and now retested it
-Multi year trendline + gap fill below 200

Tesla May fall before it revives.We are in the middle of a demand area for Tesla. What does that mean? With the heavy selling, tons of demand is being fulfulled. We are getting close to the bottom of where there is strong demand (210-212). If We do not close below this area, there is a strong case for a rebound up to the 255 area. This may happen quickly.
With this "Players" Strategy, Participants, or "players" are able to be found out through pure price action and volume. Follow for more charting and happy trading!

Tesla ShortI have analyzed Tesla based on the trend, Candle patter & Gann level. And i can see it will come down now. It was good bounce back from the low. Target is shared. It is in down trend. Stop loss 245.

TSLA 2 MoonTesla, Inc. is an American multinational automotive and clean energy company. Headquartered in Austin, Texas, it designs, manufactures and sells battery electric vehicles, stationary battery energy storage devices from home to grid-scale, solar panels and solar shingles, and related products and services.