TSLA Approaching a Critical Reversal Zone! Can $280 Hold? Feb.28Technical Analysis (TA) & Price Action
Tesla (TSLA) remains in a strong downtrend, trading within a well-defined falling wedge pattern. The stock is currently testing a major support zone around $280, which aligns with the highest negative NETGEX and significant PUT walls. A breakdown from this level could open the door for a steeper decline toward $250, while a bounce could lead to a sharp reversal rally.
Key observations:
* Trend Structure: TSLA is in a clear downtrend, but nearing exhaustion based on technical indicators.
* Support & Resistance:
* Major Resistance: $297-$300 (breakout confirmation level).
* Key Support: $280 → If this breaks, expect further downside toward $250.
* Breakout Target: $310 - $350 if momentum shifts.
* MACD Indicator: Showing a slight bullish divergence, which could signal an upcoming reversal.
* Stoch RSI: Oversold at 37.67, indicating potential upside pressure if buyers step in.
Options Flow & GEX Analysis
The GEX (Gamma Exposure) indicator suggests that TSLA is heavily weighted on the PUT side, with the highest negative gamma near $280. This implies that if $280 breaks, the next big support is around $250. However, if $280 holds, a short squeeze could push TSLA toward $300+ quickly.
* IVR (Implied Volatility Rank): 74, with IVx avg at 77.9%, showing high volatility expectations.
* Call Side Bias: 31.9% of options flow, indicating some bullish positioning.
* Key GEX Levels:
* PUT Wall & Key Support: $280 → A breakdown could bring $250 as the next stop.
* CALL Resistance & Upside Target: $300 → A move above this level could send TSLA toward $350+.
Trade Plan & Suggestions
📌 Bullish Reversal Setup (Preferred Play)
* Entry: Above $285 with strong volume confirmation.
* Target 1: $300
* Target 2: $310-$350 (Extended breakout target).
* Stop-loss: Below $278
📌 Bearish Breakdown Setup (Hedge Play)
* Entry: Below $278 with strong selling pressure.
* Target: $265 → $250
* Stop-loss: Above $285
Final Thoughts
TSLA is at a crucial inflection point, with $280 acting as the major battleground. If buyers defend this level, expect a short squeeze rally toward $300+. But if this level fails, the next leg down could accelerate toward $250. Volume confirmation is key before making a trade.
📢 Risk Management: Keep tight stop-losses, wait for confirmation, and be ready for volatility.
🔹 Disclaimer: This analysis is for educational purposes only and does not constitute financial advice. Always conduct your own research and manage risk accordingly before trading.
TSLA trade ideas

TSLA Update to price entry - $255 TSLA is giving us great info. Today's and yesterday's declines were indicative of a stock that is not yet ready to stop falling. We are not there yet, but we are getting pretty close. We may have made a small bottom that moves us to $312, and then under many scenarios makes a new low at $255 or so. That buy zone stops out near $222. Elliotwave, Murrey Math, Kumarwave.

TSLA Tesla 1week potterboxTSLA Tesla 1-week potterbox. well tesla is now sitting on the 50 percent line or cost basis $277.42 ish. Tesla should bounce here if it opens above the 50 percent line it should stay above it. It is also still above the 200 day MA. Well i geuss we will see where it goes over the next couple of weeks. Just remember folks Tesla is alot more than a car company. Happy Trading.

TSLA - Starting to DCAI think we are in a good range to start accumulating, down 41% from the top and every indicator I test out seems to be oversold. Potentially it can go lower to ~$225 - this is why I'm not throwing all my money. Definitely a company of the future.

Important Support and Resistance Zone: 252.75-268.07
Hello, traders.
If you "Follow", you can always get new information quickly.
Please click "Boost".
Have a nice day today.
-------------------------------------
(TSLA 1M chart)
The 252.75-268.07 zone is an important support and resistance zone.
If it falls below 252.75, it is likely to fall to around 173.22.
-
(1D chart)
In order to turn into an uptrend, it must rise above the M-Signal indicator on the 1D chart.
Therefore, the key is whether it can be supported and rise near the M-Signal indicator on the 1M chart.
-
Thank you for reading to the end.
I hope you have a successful trade.
--------------------------------------------------

Tesla - Elon Is Playing The Charts!Tesla ( NASDAQ:TSLA ) is perfectly respecting structure:
Click chart above to see the detailed analysis👆🏻
Two months ago Tesla perfectly retested the previous all time high resistance and closed with a massive rejection wick. This means that a correction - which is currently happening - is expected and after the bullish break and retest, we will then finally see new all time highs.
Levels to watch: $280, $400
Keep your long term vision,
Philip (BasicTrading)

Multiple charts2.28.25 a lot of the markets we talked about yesterday looked like they were going higher. this video looks at all of those markets from yesterday... and so today would have been a good day to follow yesterday's setups. Tesla went a little bit lower today but it's a setup for a long trade when you find a two-bar reversal. coffee did trade a little lower but it's at a support area that is significant so I would be looking for this to show me a two-bar reversal going higher if I wanted to go long in this trade. we took a good look at gold and silver. oil went up about $2000 or 2 points I was reluctant to tell you whether you would stay long or not.... but that's okay because we can look at the market tomorrow and see what it did and what might happen once it starts Trading later tonight after the market takes a break. just a little caveat here: in the last couple of days it's been easy to evaluate the market but generally it has not been easy to trade the markets in the past couple months in my opinion. I tell you this because markets contract and they become very difficult to make decisions regarding what direction they will move.... and you can't change that but you can avoid overtrading and recognize that there are times in the market which you can see if you teach yourself to look.... and at the very least trade less or take a break until the market becomes more clear.

TSLA Support by Trendline, 200 Day MA, and previous resistanceToday February 27th, 2025 NASDAQ:TSLA has bounced off of the 200 Day SMA, a trendline with a positive slope that had it's first touch on April 22, 2024, and a price level of significant previous resistance from September 15th, 2023. With all of these put together I anticipate that a significant reversal will occur off of this price level of around $280.

Tesla making a short term bottom near 285-290$Tesla making a short term bottom near 285-290$
Tesla is extremely oversold and showing a reversal sign as per the indicators. it may bounce once till 310$

TSLA: Don't fight itWe're officially in correction territory of upward channel.
Long term investors rejoice.

TSLA - Another trade of the year candidate!This short was almost too easy and we identified it in the last video after closing the cup and building just enough liquidity for a further dump.
It's been fun but I think I'm going to stop shorting for now and look for some buys
Happy Trading :)

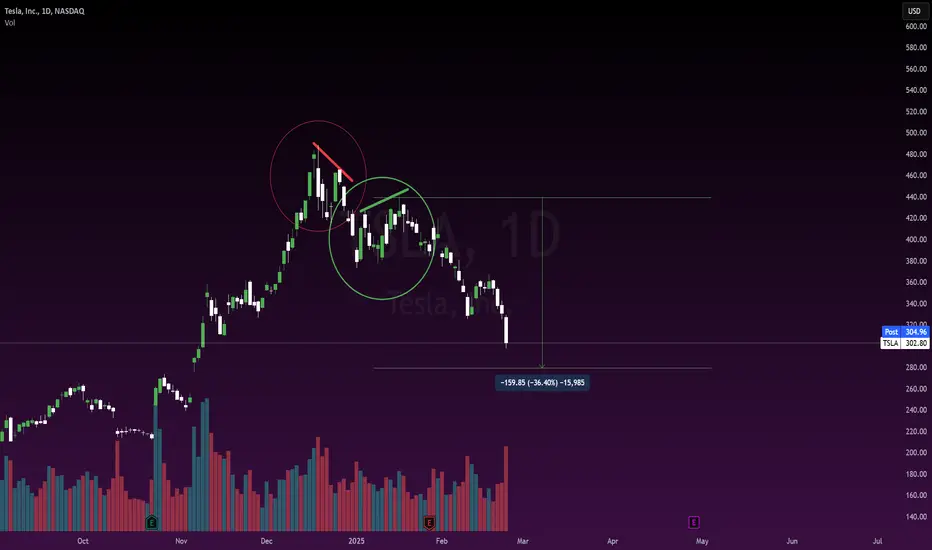
TSLA: What to expectI like this chart because in such a short period of time there are 3 really significant patterns that have formed.
The first one is an example of an Adam Adam double top (red circle). You can tell this because there are 2 very narrow peaks. This is bearish of course.
Then it transitioned to an Adam Even double top (green circle).
Which has since transitioned to a head and shoulders formation.
The expected move from the Adam Eve double top is around 36% on average, which we are fast approaching.
The expectation for tomorrow is about a -1% decline continuation.
I am mostly a math trader but I do enjoy my Bulkowski patterns xD.
Not advice, safe trades!
Tesla Approaches Key Support: What Comes Next?NASDAQ:TSLA is currently at an interesting moment on the daily chart. Until recently, the uptrend was well-defined, with strong projection legs and corrections within a healthy behavior. But now, we have a slightly different situation. The last upward leg was intense, but the current correction has already surpassed the 66% retracement level and is approaching a significant support zone that has held the price multiple times in the past.
What stands out at this moment is not just the existence of this support, but how the price reached it. There is a technical concept that suggests that the greater the speed and distance the price has traveled to reach a support, the more relevant that support tends to be. This happens because markets do not move indefinitely in a straight line. When a sharp and extended downward move occurs, sellers tend to lose momentum, and buyers may step in to try to hold the price.
On the other hand, this deep correction also highlights an important point: even if the support holds temporarily, a continuation of the uptrend does not seem to be the most likely scenario at this moment . With such an extended retracement following a strong upward move, it becomes difficult to imagine the price simply breaking the previous high and resuming a clear bullish structure. The more probable scenario is either a period of consolidation or even a transition into a reversal.
This does not mean that support cannot create short-term buying opportunities. It might, but in this case, trades within this period tend to be more challenging because if we are entering a consolidation phase, price movements could become more erratic and less predictable. A bullish leg within a consolidation is very different from a bullish leg within a strong trend – targets become shorter, price movements can lose fluidity, and predictability decreases.
So, regardless of what the market decides to do from here, what we can interpret so far is that the strength of the uptrend has faded, and NASDAQ:TSLA may be entering a more lateralized movement or even a transition into a downtrend. The support level might create a reaction, but it is unlikely to sustain a return to the uptrend without first going through a phase of rebalancing. The price will always dictate the next moves, and all we can do is interpret the signals it has left behind.

TSLA - support & resistant areas for today Feb 27, 2025Here are the key support and resistance levels for TSLA for today. These levels are crucial as they indicate areas where the price may reverse or consolidate. A bounce off these support or resistance zones can signal potential long (buy) or short (sell) positions for traders.
These levels have been calculated using mathematical models and forecasting techniques, ensuring their relevance for today's trading session. Please note that these levels apply only for today and may change in the future.
If you find this information helpful and would like to receive these insights every morning at 9:30 AM, please support me by boosting this post and following me. Your engagement helps me understand the value of this content. If this post does not receive more than 10 boosts, I will reconsider continuing with these daily updates. Thank you for your support!

TESLA is in a Flat Correction and headed to $50 to $80Tesla is in a 2nd wave Extended Flat correction heading to $50 to $84. Once this plays out, then BOOOM - $600 to $700 Tesla sometime in mid 2026

White Rabbit $TSLAChecking out these Tesla (TSLA) stock charts over the past year—both show some striking similarities! You can see the same upward surge in late 2024, peaking around the same high, followed by a noticeable decline into early 2025. The moving averages and trading volumes also align closely, reflecting similar market sentiment and volatility. Plus, the RSI bottoms hit similar low points, and both charts display a 'two forks down' pattern, indicating comparable momentum shifts. Interesting to see the consistency across these time frames! #Tesla #StockMarket #Investing

TESLA the big trade been waiting for this retracement to the broken neckline around 270 - 255 to buy since 400s

TSLA-BUY strategy 6 hourly chartIt is always a roller coaster one-way kind of a stock. We have seen $ 485 and now back $ 290. so, much about those reputable analysts :)
Let's get back to the drawing board. The share is oversold, and it's an understatement saying that. The main reasons are fundamental, and Elon his attitude does not help the stock, but the facts remain, he is an innovator, and yes sales declining, and I feel the right level for the stock is somewhere around $ 350. I think.
Strategy BUY @ $ 280-300 and take profit near $ 345 for now is what I feel makes sense right now.

TSLA Testing Key Support! Is a Rebound Coming or More Downside?Technical Analysis for February 27, 2025:
1. Current Price Action:
* TSLA has been in a sharp downtrend, currently hovering near $286 after breaking critical support levels.
* The price is consolidating at a high-volume node (POC: $290), suggesting a possible reaction.
* A falling wedge pattern is forming, which could signal a potential reversal if TSLA breaks out.
2. Key Levels to Watch:
* Support: $280, $249.89 (Major long-term support).
* Resistance: $290-$297 (POC - Major volume area), $315 (Gap fill and key resistance).
* Upside Targets: $315, $346.95, $367.30 (Potential breakout zones).
3. Indicators Analysis:
* MACD: Deep in the negative, but a possible crossover could hint at reversal momentum.
* Stoch RSI: Oversold, indicating the potential for a bounce.
* Volume Profile: Heavy resistance at $290-$297; breaking this level could push TSLA toward $315+.
GEX & Option Strategy for Tomorrow and the Week:
1. Gamma Exposure (GEX) Insights:
* Call Walls: $315, $350, $367 → Resistance areas; gamma squeeze potential above $315.
* Put Walls: $280, $249.89 → Key downside risk zones.
2. IV & Sentiment:
* IVR: 67.8 (elevated)
* IVx Avg: 74.2 (moderate) → Still favoring option sellers.
* Call Positioning: 30.1% bullish sentiment.
* GEX Sentiment: Strong negative bias; put-heavy positioning favors a controlled downside move unless $290 is reclaimed.
3. Trading Suggestions:
* Bullish Setup: If TSLA reclaims $290-$297, consider long positions targeting $315-$350, with a stop at $285.
* Bearish Setup: If TSLA fails at $290, short opportunities with targets at $280-$249, stop at $300.
* Options Play: Selling put spreads at $280 support or call spreads near $350 resistance.
📌 My Thoughts & Suggestion:
* TSLA is at a make-or-break zone at $286-$290; holding here could set up for a strong bounce.
* If downside momentum continues, $280 and $250 are key support zones.
* Wait for confirmation before jumping in aggressively, as IV remains elevated.
⚠️ Disclaimer:
This analysis is for educational purposes only and does not constitute financial advice. Always do your own research and manage your risk before trading. 🚀

Tesla bullish reversal coming soon Been making money with daily puts on Tesla.. But its getting close to reversal area.. We got 200 DMA near $274 (.699 reversal fib) where bull gap also starts down to $255. Its very good possibility it bounces off the 200 DMA above the gap...
Let's see what happens

Do or die for TeslaLooking at the monthly chart there are confluence of price support and rejection in this area. IMO 280 closing monthly price is the make or break, hold this and bullish structure intact, but break this, it will flip bearish side.

$Tesla back to $360 - explosive move expected soonSitting at the bottom of the long respected bottom support for it's current down trend channel after shedding $100 this month. Conditions are extremely oversold having reached a massive buy zone, which fills the long withstanding $280 gap from November, and also doubles as a retest of long term support (200MA).
The rebound from this area could easily take us to the top of the same channel around the $360 mark give or take, and bears would STILL be in control. Anything above that and we could see $400+ next month.
Easy swing play IMO for the next week or two - PTs are $345>$355>$365
tesla long term levels tesla long term levels , just my thoughts ! fib , trend , stops and profit levels up and down
