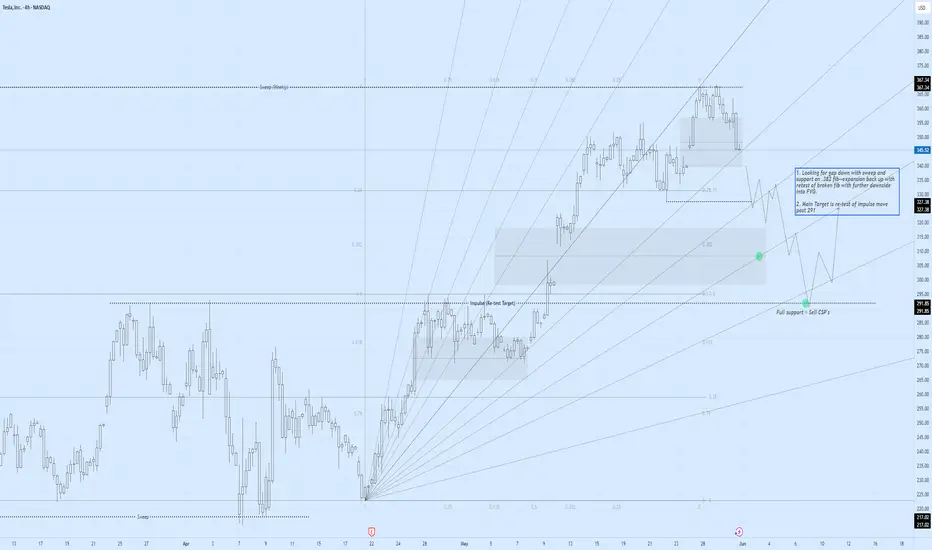
TSLA Descent 4-hr OutlookTSLA Descent!
1. Looking for gap down with sweep and support on .382 fib--expansion back up with retest of broken fib with further downside into FVG.
2. Main Target is re-test of impulse move (291 level).
-- take into consideration TSLA moves 29 points weekly (avg).
3. Full support = selling CSP's 14+ days out.
TSLA trade ideas
Support ZoneWe have reached anmimportant support zone reaching from 27th April till May 8th. I think that we shall stop here and gom for an upward retracement.

Tesla Monthly TF (Next Target —110-140)I will not bore you with too many details. I will do an analysis based on the moving averages to support my bias, bearish at this point.
April 2024 tests EMA89 as support and this support level holds. This results in a bullish impulse.
The impulse ends December 2024. On the drop, TSLA founds support at EMA55 monthly. There is bounce at this level and this bounce ends as a lower high.
» When this happens, the next moving average in line gets tested, in this case EMA89 or a minimum of 191 as the next target.
EMA55 monthly sits at 229.88 (230). This level will fail as support, why? Because the test of it in March and April led to a lower high and this lower high will be followed by a lower low.
If TSLA had moved higher than December 2024, then any drop or correction would not go below EMA55. Since the action is ending as a lower high, then the next drop which is already underway will break through this level.
The main level for the current move sits around 110-140 based on the long-term. These levels are close to the lows in January 2023 and December 2022.
Technical analysis can help you predict a move regardless of its cause. Don't believe me? See the 'related publications'.
Thanks a lot for your continued support.
Namaste.

Possible Head & Shoulders Forming Possible head and shoulders forming on the weekly chart could signal more downside ahead.
This plays into a large corrective wave that started in November 2021, which still needs to form a wave-C of comparable size.
A new high above the wave-B top would negate this count.

TSLA Backtest: A robo-taxi launchpad? TBD ... 𝗧𝗲𝘀𝗹𝗮 𝗕𝗮𝗰𝗸𝘁𝗲𝘀𝘁: A robo-taxi launchpad? 🤖🚗
After a 20%+ breakout, NASDAQ:TSLA is retesting its 200dma with $295–300 now key support. Hold that — and bulls have room to run to $400+.
𝘉𝘶𝘭𝘭𝘪𝘴𝘩 𝘴𝘦𝘵𝘶𝘱 𝘸𝘪𝘵𝘩 𝘢 𝘥𝘢𝘵𝘦: June 12 robo-taxi reveal in Austin could mark Tesla’s first real step toward autonomous ride-hailing at scale.
𝘏𝘪𝘨𝘩 𝘱𝘳𝘪𝘤𝘦, 𝘩𝘪𝘨𝘩 𝘩𝘰𝘱𝘦𝘴: Tesla's valuation has always priced in the future. This time, the future might show up in a self-driving Model Y.
$NQ_F NASDAQ:NDX NASDAQ:QQQ NASDAQ:NVDA NASDAQ:AAPL AMEX:SPY NASDAQ:SOX CBOE:ARKK #Tesla #Robotaxi #FSD #ElonMusk #Stocks


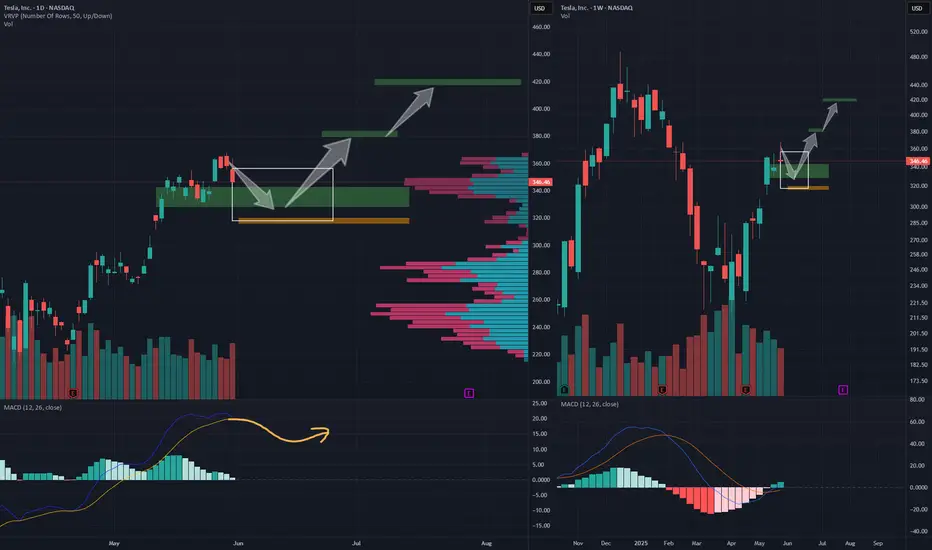
TSLA looking for a rally setupPrediction:
TSLA will likely pull back to the green range (328–342), and in extreme cases, it may dip to the 318–320 area before starting a rally toward ~380 in June or July.
Eventually, it may aim for the ~420 range as the full target, though I’m not very confident about that at this point.
On the daily chart, the overall setup is forming a bull flag pattern, with the MACD showing a potential pullback reversal in the high-range.
The gap between 307 and 311 likely won’t be filled in the near future.
Action:
I plan to accumulate long positions around ~335 and will add more if it drops to 320, or if it breaks above the 10 SMA after breaking below the 20 MA without hitting 320.
Stop loss will be at filling the gap or breaking down 60 SMA.
Potential-loss ratio is 2:1 to 3:1, which is not ideal for TSLA or TSLL. So I will be looking for calls or BCS.
Tesla Drop to the downside update In this video I recap what happened in the latest drop on Tesla and how we anticipated this move some 4 days ago .
I cover whats possibly next for tesla looking forward .
This video also covers a HTF perspective on the direction of Tesla .
Any questions ask in comments
Thanks for your support

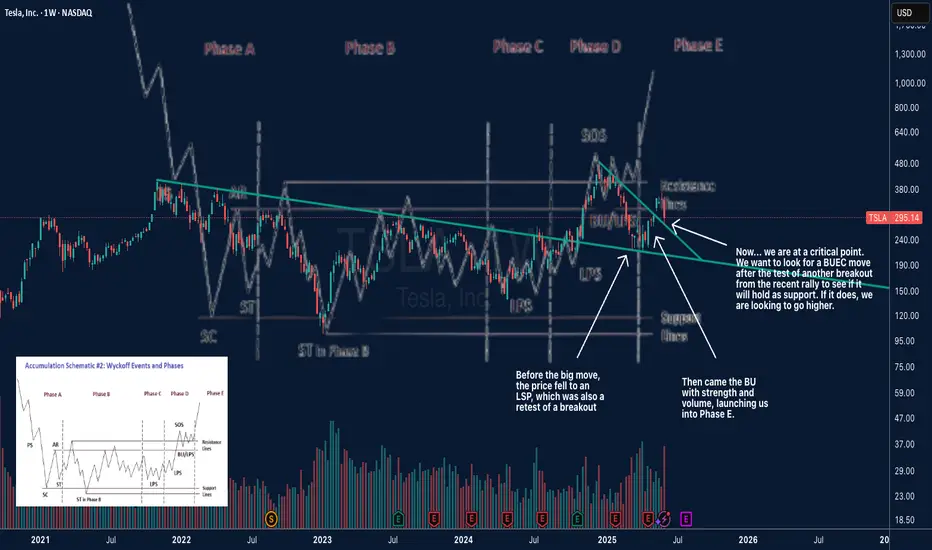
Is Tesla telling a classic story right on its chart?This looks like a textbook example of Richard Wyckoff's "Creek" analogy. For months, the stock faced a "creek" of selling pressure around the $280-$300 resistance line, turning back any attempt to move higher.
Before the big move, the price "backed up" to a Last Point of Support (LPS) to gather steam—that was the dip we saw back in Phase D. Then came the powerful "Jump Across the Creek," a breakout with strength and volume, launching us into what appears to be Phase E.
But the story isn't over. The sharp pullback we're seeing now isn't necessarily failure. It's the critical "Back-Up to the Edge of the Creek." The stock is testing if the old resistance (the far bank of the creek) will now hold as new support.
The question now is: Does the ground hold for the next launch higher, or does the price fall back into the water? This is the moment of truth.
SHORT Tesla, Bearish Chart SetupGood morning my fellow Cryptocurrency trader, I hope you are having a wonderful day. If you decide to call me a genius or whatever... The choice is yours to make.
Here, the TSLA stock (Tesla) is showing some weakness signals. Weakness that can translate into a drop.
Would you like me to point those out?
Ok, we can go through a few of them real-quick.
1) A rising wedge pattern. Always bearish.
2) Decreasing volume. Always bearish.
3) Resistance being confirmed at the 19-February peak.
4) Bearish bat.
These are just a few of the chart signals but it is not only about the signals, there is something in the air... I smell... Huh, what to call it? A flash crash? A market shakeout? A flush? A surprise? Or simply, a retrace?
I don't know... All I know is one thing, TSLA doesn't look bullish anymore.
The chart is saying down.
Let's see what kind of event shows up to match the chart.
Namaste.

TSLA BUYBUY TSLA at 272.00 to 248.00, riding it back up to 470.00 to 515.00 as Profit Targets, Stop Loss is at 213.00!
If anyone likes long mumbo jumbo garbage analysis, than this is NOT for you.
Also, if you are afraid of risk, failure, and want only a 100% sure thing, than
run as fast as you can from the markets, because it is definitely NOT for you.
WARNING: This is just my opinions of the market and its only for journaling purpose. This information and any publication here are NOT meant to be, and do NOT constitute, financial, investment, trading, or other types of advice or recommendations. Trading any market instrument is a RISKY business, so do your own due diligence, and trade at your own risk. You can loose all of your money and much more.

Tesla Daily, Update (Bearish Trend Extends)Today TSLA produced the highest bearish volume session since July 2020. This high volume and strong sellers pressure shows up to break EMA55, EMA89 and MA200 daily as support. Needless to say, this is a very strong bearish development.
The break of this long-term support comes after a major lower high. May 2025 much lower compared to December 2024.
My point is to alert you of a much stronger correction than expected on this stock. Now that MA200 has been lost as support, with the highest volume in five years after a strong lower high, we can expect the continuation of the bearish trend.
I will look at Tesla on the monthly timeframe in a separate publication.
Thank you for reading.
Namaste.

TSLATESLA following Fib Retracement (marked on Left) as well as Fib Extension (on Right) to the T.
News is incidental.
The BIG BEAUTIFUL FIGHT may even be fake.
But Fibonacci rules!

TESLA Massive Short! SELL!
My dear friends,
Please, find my technical outlook for TESLA below:
The instrument tests an important psychological level 345.78
Bias - Bearish
Technical Indicators: Supper Trend gives a precise Bearish signal, while Pivot Point HL predicts price changes and potential reversals in the market.
Target - 308.21
Recommended Stop Loss - 364.73
About Used Indicators:
Super-trend indicator is more useful in trending markets where there are clear uptrends and downtrends in price.
Disclosure: I am part of Trade Nation's Influencer program and receive a monthly fee for using their TradingView charts in my analysis.
———————————
WISH YOU ALL LUCK

TESLA: Patience Is KeyAdmittedly: The news surrounding Tesla is not particularly exciting at the moment. Nevertheless, it is unlikely that the share price of the e-mobility pioneer will plummet. Rather, it is now important to wait for an ideal entry point.
The share has currently recovered significantly from its recent lows and a long entry would offer a suboptimal RRR. Instead, we assume that the price will move sideways to negative in the coming weeks and months, in line with the rather bearish annual seasonality, which usually lasts until September or October. The entry point shown at around USD 260 would then provide an ideal RRR for a long trade that would take us to the ATH area and possibly beyond.

$TSLA - Time to BUY (F to sellers)When weak hands sell in fear, we proudly buy.
Tesla is at the perfect spot for buying right now, both from fundamental and technical sides. The recent fight between Elon & Trump granted so much needed correction to the chart. The price is resting on the $260 - $280 support now - ideal spot for buying before the massive blast off will happen.
A few technical factors: there is a HUGE ascending triangle with horizontal resistance ($415), the 3rd approach of this resistance should be final before the breakout happens! Moreover, the price is steadily forming a bullish pennant that will help in breaking the resistance up.
The overall trend is strictly bullish according to Fibo. The target of this upward movement is located in the $900 - $1000 zone which is x4 from current points. Not very often in our century you get such an opportunity.
You may have different opinions about Elon Musk, but you can't deny the fact he is brilliant businessman and entrepreneur. You can already see that "Tesla owners are scrambling to remove their anti Elon stickers from their car now that he is feuding with Trump" . Elon is a good-guy for liberals again, while republicans didn't change their positive attire regarding his company as well.
I tend to believe that all those news we witnessed yesterday (mean Elon&Trump fight) was just a part of a bigger plan , the outcome of which we will see later this year or even next year.

TESLA (TSLA) SHORTSHORT IT...
No fundamentals, no technical analysis (because it is there as a trap for new traders).
It is something else...

$BULLISH STRATEGY - SIMPLE BUT OFTEN USEFUL !This simple Strategy says when a trend has been shaped already the Second time which price hits the channel would be the most powerful wave can break even a static level !

Will Tesla keep dropping?Tesla's stock experienced a significant decline of 14% yesterday, primarily due to a public feud between CEO Elon Musk and President Donald Trump. This dispute has raised concerns about potential government actions that could adversely affect Tesla's operations.
The conflict began when Musk criticized a proposed tax and spending bill, labeling it a "disgusting abomination." In response, President Trump threatened to terminate federal contracts with Musk's companies, including Tesla and SpaceX. This escalation led to a sharp drop in Tesla's stock price, erasing over $150 billion in market value and removing the company from the $1 trillion market capitalization club.
Technical analysis indicates that Tesla's stock broke below key support levels, including its 50- and 200-day moving averages, suggesting a potential continuation of the downtrend. Analysts have identified support levels at $265, $215, and $170, with resistance around $365.
Despite the recent turmoil, some analysts remain optimistic about Tesla's long-term prospects. Dan Ives of Wedbush Securities maintains a bullish outlook, citing upcoming innovations like Tesla's robotaxi service as potential growth drivers.
However, challenges persist. Tesla faces declining sales in Europe, increased competition from companies like BYD, and potential regulatory hurdles stemming from Musk's political engagements.
-Disclaimer: This analysis is for informational and educational purposes only and does not constitute financial advice, investment recommendation, or an offer to buy or sell any securities. Stock prices, valuations, and performance metrics are subject to change and may be outdated. Always conduct your own due diligence and consult with a licensed financial advisor before making investment decisions. The information presented may contain inaccuracies and should not be solely relied upon for financial decisions. I am not personally liable for your own losses, this is not financial advise.

Tesla Update Longs and shorts At the start of the video I recap my previous video and then bring us up to date with the present price action .
In this video I cover Tesla from the higher time frame and breakdown both a long term bullish scenario as well as a local bearish scenario .
Both of these scenarios present longs and short entries for day trade opportunities and swing positions .
Tools used Fibs , TR pocket , Volume profile , Pivots , and vwap .
Any questions ask in the comments
Safe trading and Good luck

TESLA JUN 2025Tesla ( NASDAQ:TSLA ) rejected from the $305–$350 resistance zone after a strong rally.
Price is now testing the lower end of the previous breakout range, with potential for deeper retracement.
Below $305, the next key support lies in the $250–$220 accumulation zone, where $23B was previously bought.
If this level breaks, watch for possible institutional defense at $200 and $180 weekly, where large orders are sitting.
On the upside, a confirmed breakout above $350 could open the path toward the target zone at $500, although strong resistance is expected between $500–$550, where $55B was previously sold.
#TSLA #Tesla #StockMarket #Trading #VolumeProfile #TechnicalAnalysis #WallStreet
#globaltrade #investment #investing #stockmarket #wealth #realestate #markets #economy #finance #money #forex #trading #price #business #currency #blockchain #crypto #cryptocurrency #airdrop #btc #ethereum #ico #altcoin #cryptonews #Bitcoin #ipo

TSLA Oversold Bounce Setup – Targeting $300 Max Pain Zone🚗 TSLA Oversold Bounce Setup – Targeting $300 Max Pain Zone 🔥
📅 Signal Date: June 5, 2025 | ⏳ Duration: 5–10 Day Swing
🎯 Objective: Play oversold bounce into heavy open interest at $300
📊 Multi-Model Insight Summary
Model Bias Strategy Strike Entry Target Stop Confidence
Grok Mod. Bullish Buy Call 290 34.00 40.80 17.00 75%
Claude Mod. Bullish Buy Call 290 34.00 50.00–65.00 20.00 75%
DeepSeek Mod. Bullish Buy Call 300 26.65 32.00 20.00 75%
Gemini Neutral/Stand Aside No Trade — — — — 45%
Llama Mod. Bearish Buy Put 280 3.30 1.65 3.30 75%
🔎 Technical & Sentiment Snapshot
15-Min RSI: Extremely oversold → Mean-reversion potential
Daily/Weekly: Neutral, but nearing key support zones
Price Action: 5-day sharp drop into $280–$285 area
Max Pain: $300 → potential gravitational magnet for bounce
Sentiment: News uncertainty (Musk/Trump noise) but positioning supports upside
IV Rank: Elevated — options rich but supported by move potential
🎯 Trade Setup – Long TSLA Call
Instrument: TSLA
Direction: CALL (LONG)
Strike: $290.00
Expiry: 2025-06-20
Entry Price: $34.00
Profit Target: $40.80 (20% premium gain)
Stop Loss: $17.00 (50% premium loss)
Size: 1 contract
Entry Timing: Market open
Confidence Level: 70%
⚠️ Risk Management Notes
🔻 Premium decay: Watch theta decay closely, especially if no bounce by day 5
🚫 Technical breach: Close trade if $280–$285 breaks on strong volume
💣 Headline risk: Musk-related catalysts or macro shifts can swing direction rapidly
⏳ Time Exit Rule: Consider exiting by June 14 if trade hasn’t reached target
🧠 Trade Rationale
TSLA’s sharp pullback into oversold territory alongside strong call OI at $300 sets the stage for a short-term relief bounce. Multiple models support the call play, with a focus on a 5–10 day recovery swing.

Tesla Recovers After Announcement of Trump–Musk DialogueBy Ion Jauregui – Analyst at ActivTrades
After a session marked by a sharp decline, Tesla shares rebounded strongly in after-hours trading. The catalyst: a *Politico* report revealing that President Donald Trump’s advisors have scheduled a phone call with Elon Musk for today, Friday, in an effort to ease tensions following a public dispute between the two figures. On Thursday, Tesla suffered one of its worst declines of the year, plunging 14.26% and wiping out more than \$150 billion in market value within hours. This brings the quarterly loss to 25.70%. However, news of a potential reconciliation pushed the stock back into positive territory, closing at \$288.35 with a 2.31% recovery, sparking speculative after-hours trading that could extend into the week’s final session.
The clash erupted after Musk criticized a new tax cut bill championed by the White House. Trump promptly responded by threatening to reassess federal contracts awarded to Musk's companies, such as SpaceX. Tensions escalated further when Musk, via social media, hinted at alleged ties between Trump and the late financier Jeffrey Epstein.
According to *Politico*, although Trump has publicly projected an air of indifference, his advisors have been working behind the scenes to de-escalate the feud and avoid broader political and economic fallout. The scheduled call on Friday may mark the beginning of a truce.
It’s worth recalling that during his tenure at the Department of Government Efficiency (DOGE) under Trump’s administration, Elon Musk faced accusations of conflicts of interest, particularly for pushing deregulatory policies that directly benefited Tesla and SpaceX. These actions triggered public protests, the "Tesla Takedown" boycott movement, and investor concerns over Musk's divided attention—ultimately harming Tesla’s reputation and market valuation.
Tesla Under the Microscope: Between Market Rebound and Financial Pressure
The technical rebound has offered investors some relief, but Tesla’s challenges extend beyond the political arena. As of 2025, the stock is down nearly 25% amid shrinking global EV demand, intensified competition, and margin pressure. In its Q1 2025 earnings report, Tesla posted \$21.3 billion in revenue, down 5% year-on-year. Net income also fell to \$1.04 billion, dragged by an aggressive discount strategy and rising operational costs. Gross margin declined to 17.2%, while free cash flow stood at \$620 million. Despite these headwinds, the company maintains a strong financial position, with \$22 billion in cash and \$7.8 billion in total debt. Tesla currently trades at a price-to-earnings ratio of 56, well above the industry average, reflecting high—though increasingly questioned—growth expectations.
Technical Outlook: Key Support Level in Sight
From a technical perspective, Tesla has found crucial support around the \$271.22 level. This bounce aligns with the beginning of a bearish consolidation cross seen on Wednesday. If the 200-day moving average remains below the 100-day and the 50-day adjusts downward, further bearish momentum could ensue. A break below this level may lead to a decline toward \$250. Conversely, a sustained recovery could push the stock toward the previous control point at \$361.93, though not before consolidating around the \$320 resistance zone. The RSI shows clear signs of extreme overselling at 19%, potentially signaling the door to an upward move.
In the short term, everything hinges on the outcome of today’s Trump–Musk conversation, which markets will be watching very closely.
Conclusion
The clash between Musk and Trump has left visible scars on the market. While a possible rapprochement may open a window for stabilization, Tesla’s financial and technical fundamentals reveal ongoing challenges. Any recovery could prove as volatile as the leadership surrounding it.
*******************************************************************************************
The information provided does not constitute investment research. The material has not been prepared in accordance with the legal requirements designed to promote the independence of investment research and such should be considered a marketing communication.
All information has been prepared by ActivTrades ("AT"). The information does not contain a record of AT's prices, or an offer of or solicitation for a transaction in any financial instrument. No representation or warranty is given as to the accuracy or completeness of this information.
Any material provided does not have regard to the specific investment objective and financial situation of any person who may receive it. Past performance is not reliable indicator of future performance. AT provides an execution-only service. Consequently, any person acting on the information provided does so at their own risk.
