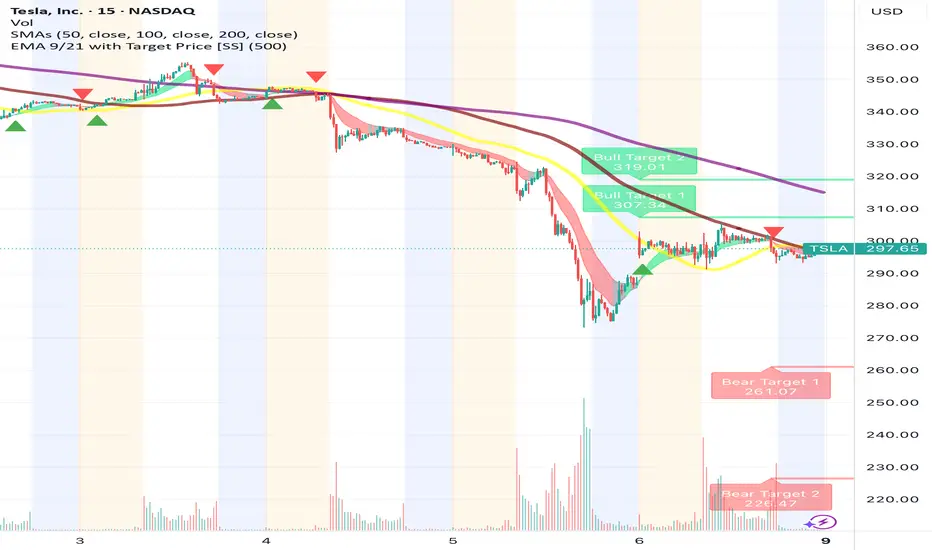
Tesla - Short Term Chart, Bullish BreakoutTesla is surging after a significant pullback. Could this be a turning point? I'm optimistic about Tesla's long-term potential and have been holding for the long haul, anticipating new highs in the future.
TSLA trade ideas

Todays Entry @ $288.45 @ 09:35am | Exit @ $293.03Pre Trade Prep:
EMOTIONAL STATE = 8
TIREDNESS = 7
Execute your edge with robot like consistency, let me the math win for you over the long term.
A surgeon doesn't not operate because his last patient died.
The battle is won before the opening bell rings.
Visualise winning and losing scenarios.
--------
1) Am i physically and mentally ready to trade?
2) Do I have clear plans for todays trades.
3) Am i prepared to walk away if there is no set up?
-------
Today, I will only trade what the system confirms.
Today, I will accept losses with composure.
Today, I will protect my emotional capital.

Important support and resistance sections: 267.07-311.48
Hello, traders.
If you "Follow", you can always get new information quickly.
Have a nice day today.
-------------------------------------
(TSLA 1D chart)
If you see support within the important support and resistance sections, it is a time to buy.
However, if a strong decline occurs, strong buying is expected around 172.6-234.59.
It is expected to be an important buying period for long-term investment.
-
Thank you for reading to the end.
I hope you have a successful transaction.
--------------------------------------------------

Nothing to Be Afraif Of!- Tesla has historically traded at high valuation multiples—and still does. But since its investor base is driven by excitement for the future and a love for innovation, it's unclear how much those valuation metrics really matter.
- After the first higher low structure following a corrective price wave, Tesla surged as much as 227.60%, before facing selling pressure. We're now tracking the second impulsive wave's retracement, particularly the 61.8% and 78.6% Fibonacci levels.
- Trying to catch the bottom at these levels is pointless. It's better to wait for 2–3 green Heikin Ashi candles and confirmation that these levels are holding.
- Current positions can be held. If you want to sell, go ahead—but remember this: No one has stayed optimistic about Tesla for more than two months. So, there's no need to panic.

Elon vs. Trump Drama, But the Chart Speaks LouderTesla closed at 300.63 with a strong 5.42% jump, but the rebound looks more technical than solid. RSI is at 43.90, still in bearish territory, and the stock hasn’t recovered from the recent drop from 360. The 305–310 zone is key — if it fails to break above that with volume, it might drop back to 280 or even 260.
On top of that, the growing tension between Trump and Elon Musk could weigh on market sentiment, especially with the upcoming election and possible regulatory concerns.
Bottom line: the move up doesn’t look convincing yet. Watch price action and volume closely in the next few days.
#TSLA #Tesla #TechnicalAnalysis #StockMarket #WallStreet
TSLA cup and handle INVALIDATEDThe TSLA cup and handle breakout case has been invalidated as of Thursday June 5th of this past week. The start of the week showed lack of conviction in the follow through to and over the 360 price level, where sellers stepped up. This indicated a slowdown in bullish momentum and a weakening trend early in the week. The ultimate catalyst that caused the breakdown for TSLA was, of course, the public breakup of Musk and DJT over social media platforms. This caused a "waterfall effect" of intense selling pressure through low volume zones from ~330 to the high volume node and put wall at the 280 level. Price ended up overshooting 280 but ended up reclaiming that level by the end of the session and bounced higher the following day. At this point, the weekly and daily charts are showing a short term wedge formation that may take some weeks to play out. There has not been signs of big institutional buying at the these levels as of now, and as such I suspect that there may be a bit more downside these coming weeks. My current idea is a short/put position under 293.5 to about 273, with a maximum target of 250. If price ends up at or near 250 levels, I would look to start a long position for a play back up to the 300 level.

Key levels for TeslaNASDAQ:TSLA Tesla has reached a support zone "274" and bounced back. Given the close above the first support"294.80", it is expected to rise toward the key resistance area "331"

Tesla rejects bull flagTesla rejected the bull flag and immediately dropped back to the weekly demand zone. I am glad I only sold one TSLL put around the base of the flag rejection retest. I have taken this opportunity to buy 1000 shares for a big swing trade here. There was a very strong bounce on my rejection target of 275.
I believe we see 330 again in no time.
My plan: 1000 shares of TSLL
Old 13$ CSP sold
new 9$ CSP solds
13$ Covered calls sold for next week x10

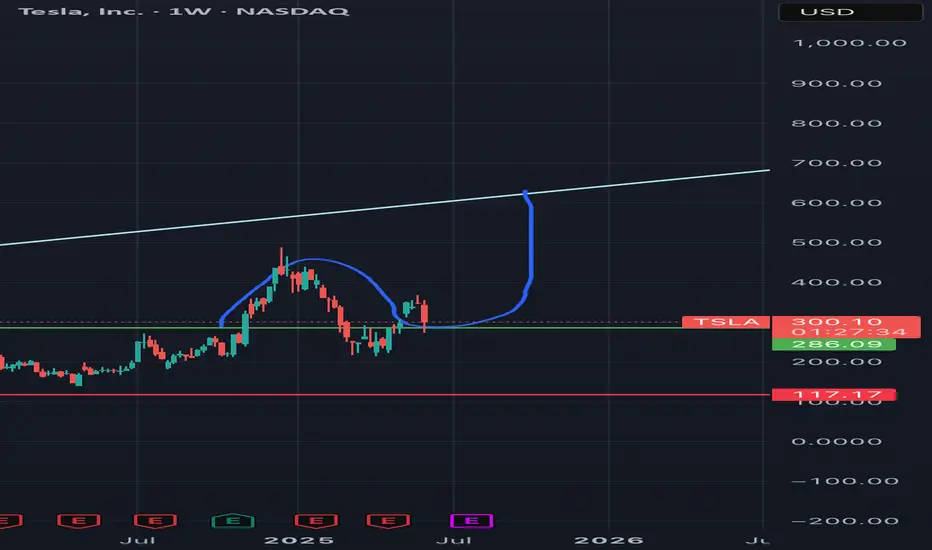
$NASDAQ:TSLA is Going to SkyRocket is Inevitable.NASDAQ:TSLA
Hi
Its the Moment for Collecting and Accumulating Stocks.
From Today on wards and upto 2 to 3 Years, its goin Sky Rocket.
Dnt Miss The Rallly ......
Thanks

Start of double bottom or bullish reversalPrice is nearing the trendline. If it crosses trendline, it will have to come back to test it before going further bullish. If it gets rejected at trendline, it could form a double bottom before testing the trendline again.

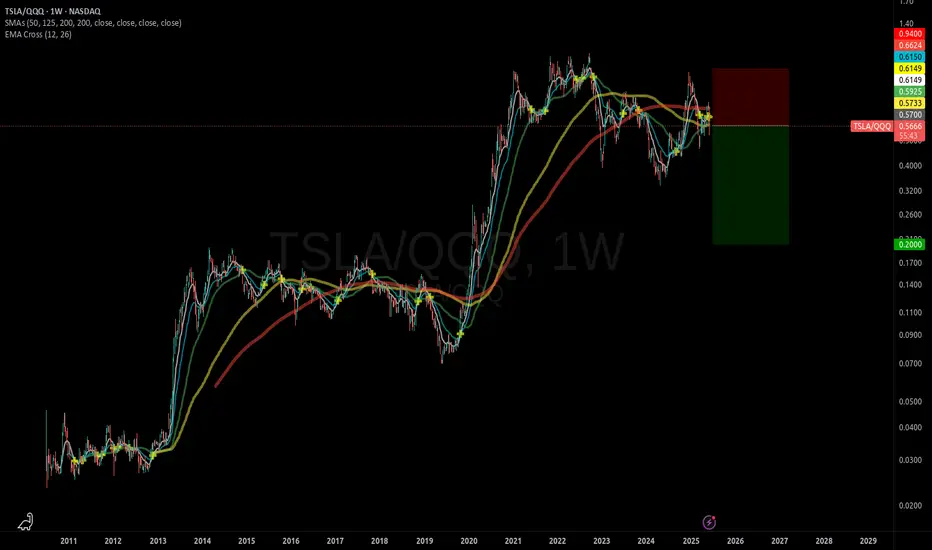
Short TSLA, Long QQQTSLA is expected to under-perform the QQQ ETF.
Whether it goes up or down in price, this trade will make money as long as the Nasdaq-100 index is stronger than TSLA.
VERY WIDE stop-loss is required.

TSLA at an inflection pointNASDAQ:TSLA weekly chart shown wirh Mcginley indicator (a trend following indicator) and cycle oscillator. Whilst price currently shows a negative bias, I believe price has reached an inflection point as the market seeks direction. Those waiting to buy the dip should wait patiently for entry opportunities upon confirmation of momentum and volume.

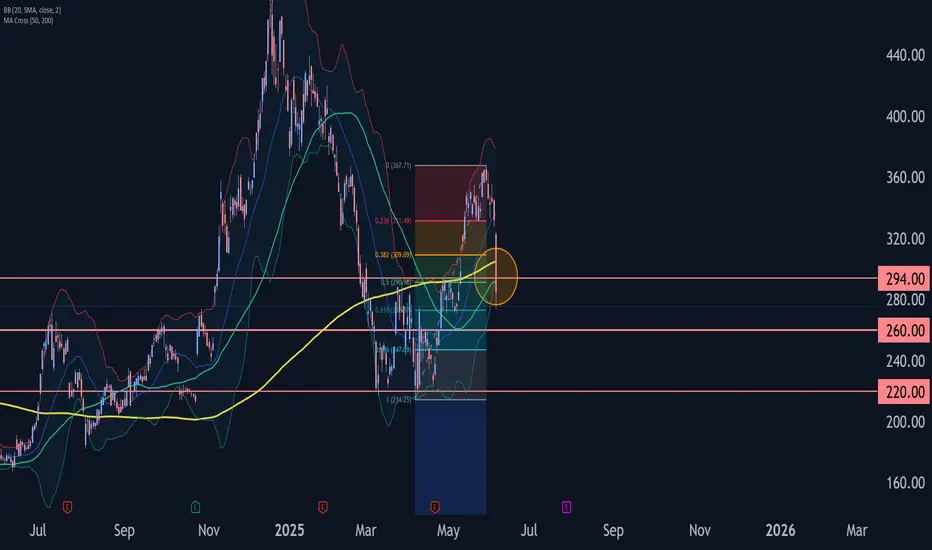
Tesla Wave Analysis – 5 June 2025
- Tesla broke the support zone
- Likely to fall to support level 260.00
Tesla recently broke the support zone located between the support level 294.00 (former resistance from April and March) and the 50% Fibonacci correction of the upward impulse from April.
The breakout of this support zone accelerated the active minor ABC correction 2 from the end of May.
Tesla can be expected to fall to the next support level 260.00, which is the former resistance from the start of April.
$TSLA That’s why you never mix politics with entrepreneurship
It clouds judgment, delays action, and places key info out of order.
Business needs clarity, not chaos.
Stick to the strategy, not the drama. 💼🚫🎭
#Entrepreneurship #Focus #Discipline #GamePlan

TSLA wait for buying signal at 250s or 210sTesla (TSLA) has been a hot topic among investors. Analysts at TD Cowen recently maintained a "Buy" rating with a price target of $330, citing Tesla's advancements in autonomous vehicle technology as a key factor. Elon Musk has also stated that Tesla has already "turned around," with the stock price climbing back toward last year's highs2. However, Tesla's recent earnings report showed a 71% drop in net profit year-over-year, and vehicle sales fell 13% in the first quarter.
The stock is currently trading above $360, which is 184 times trailing earnings, making it significantly more expensive than legacy automakers. Some investors remain bullish due to Tesla's focus on robotaxis and AI-driven innovations, while others are cautious about its valuation and declining automotive profits.
If you're considering investing, it might be worth reviewing Tesla's latest earnings, growth strategy, and broader market conditions. You can check out more details here and here. Let me know if you want a deeper dive into any specific aspect!

TSLA: Continues to form a Cup and Handle reversal patternHey folks,
Just a quick analysis of NASDAQ:TSLA on the daily chart. Compared to my last analysis, price has fallen a bit since, as a new flag (handle) continues to form following a cup pattern.
- Cup and Handle pattern forming. The handle would also count as a bull flag. This is known as
a cup and handle reversal pattern, after a downtrend. So yes, it is possible for a stock to
reverse its trend through the formation of a cup and handle reversal pattern (as you can see
in the chart).
- Major resistance at $366 which marks the peak of the flag (handle) pattern. This would have
to be broken in order for the cup and handle to be valid.
- Volume has also been decreasing during the formation of this pattern: this is typical amongst
Cup and Handle patterns, and generally a positive sign.
Note: Not financial advice.

Tesla vs. BYD: The Market’s Greatest IllusionIntroduction: The Tale of Two Companies
You don’t need to be an economist to see it. Just compare Tesla and BYD.
BYD: Founded in 1995, Chinese, over $107 billion in revenue.
Tesla: Founded in 2003, American, with less revenue—but a market cap six times bigger.
The reason? Because one sells cars, and the other sells dreams. And Wall Street loves a good dream.
The Illusion Economy: When Hype Outweighs Reality
Tesla’s valuation isn’t tied to assets, production, or profits. It’s a ritual of collective belief—a performance act where branding replaces substance, and expectation outweighs reality.
It’s the same logic behind a $1,000 jacket that costs $100 to make. Put a fancy logo on it, and suddenly, it’s not overpriced—it’s "premium." You're not just buying a product; you're investing in a lifestyle. Sure. Keep telling yourself that.
Tesla is the $1,000 jacket. BYD is the actual tailor shop.
Tesla vs. BYD: The Numbers Tell the Story
Tesla’s market cap is over $1 trillion, while BYD’s is under $200 billion. Yet, BYD outsells Tesla globally, especially in China, where it dominates the EV market. Tesla’s valuation is built on brand perception, future promises, and speculative optimism, while BYD’s is grounded in actual production and revenue.
Financial Storytelling Over Business Reality
Tesla isn’t just a car company—it’s a financial illusion. Markets rise not on performance, but on promise. Stock prices reflect not what a company is, but what a hedge fund feels it might become. It’s not a business model—it’s mood swings with decimal points.
BYD’s Competitive Edge
Production Power: BYD manufactures more EVs than Tesla annually.
Battery Innovation: BYD’s Blade Battery is safer, lasts longer, and is cheaper than Tesla’s.
Affordability: BYD’s EVs are significantly cheaper, making them more accessible to global consumers.
Market Reach: BYD dominates China, the world’s largest EV market, while Tesla struggles with pricing and competition.
The Consequences of Buying the Dream
Tesla’s valuation isn’t creating better cars. It’s just creating dumber investors.
Investors who think they’re visionaries because they bought into the hype.
Consumers who think they’re elite because they bought the label.
Boards who think they’re gods because someone inflated their stock ticker.
But every illusion has an expiration date. Every bubble has its needle. And when dreams are sold on credit, reality always comes to collect.
Reality Always Comes to Collect
This isn’t growth. It’s speculative theater funded by your retirement account.
Real value doesn’t need hype. It appears in supply chains, production lines, tangible goods, and on profit sheets that make sense even without a TED Talk.
So next time you see Tesla’s trillion-dollar valuation, ask yourself: Are you investing in a business? Or are you just buying the dream—before it bursts?

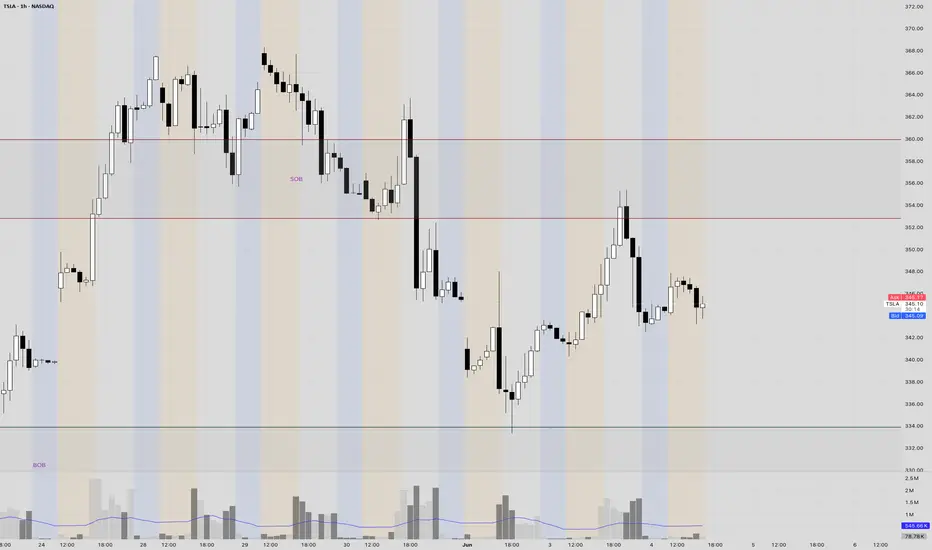
INTRADAY TSLA. SHORT @ 352. LONG @ 333. Overview -
TSLA is showing declining sales and low vehicle registration in the many countries. Although, that hasn't deterred the stock holder into panic selling, we aren't bullish on TSLA but we aren't necessarily bearish either. The market trend is going to determine the immediate direction today. We will go with a slightly bearish approach on TSLA, mainly because it was rejected from the 365 area despite trying to hold it.
The important levels in the premarket are 343 and 348.
INTRADAY TRADE PLAN -
1. If the stock opens at 345 and plummets to 343, where it confirms strength. We LONG till 348. Take a partial out at 343 and put a trailing stop.
2. If the stock opens at 345 and rallies to 348, where it confirms weakness. We SHORT till 343. Take a partial out at 343 and put a trailing stop.
3. If the stock goes till 343 and consolidates. We observe the volume footprint and side with the sellers if they are dominant. If the buyers show strength instead, then we do nothing and wait for the price to drop lower.
4. If the stock goes till 348 and consolidates. We observe the volume footprint and side with the sellers if they are dominant. We stay back if buyers are showing strength. We wait for the price to drop a little and verify if the buyer strength hold even stronger at the lower levels. Once we confirm it, we go LONG at 345 or 343.
5. If the stock goes straight to 352-355 area. We wait for even the slightest sellers aggression and we go SHORT until 345 area (or any other area where we see buying presence).
6. If the stock goes straight to 333-336 area. We wait for the buyers to step up with a little aggression and we go LONG until 348 area (or any other area where we see selling presence).
TSLA ready to go down if you want to sell your sharesBased on My geometry trading strategy
I believe tesla will drop down to break the low in Feb.
so lets see id this will be true

TSLA Weekly Options Outlook — June 3, 2025📉 TSLA Weekly Options Outlook — June 3, 2025
🚨 AI Model Consensus: Moderately Bearish into June 6 Expiry
🧠 Model Breakdown
🔹 Grok (xAI)
Bias: Bullish (Contrarian)
Setup: 5-min RSI oversold (~23.5); daily momentum weakening.
Trade: Buy $372.50C @ $0.88 → Bounce play
Confidence: 65%
🔹 Claude (Anthropic)
Bias: Bearish
Setup: Daily/M5 MACD bearish; RSI oversold; max pain magnet at $340
Trade: Buy $340P @ ~$5.55
Confidence: 75%
🔹 Llama (Meta)
Bias: Bearish
Setup: Below EMAs; RSI oversold; mixed longer-term read
Trade: Buy $342.50P @ $6.65
Confidence: 70%
🔹 Gemini (Google)
Bias: Bearish
Setup: Daily MACD bearish crossover; oversold short-term
Trade: Buy $320P @ $1.06
Confidence: 65%
🔹 DeepSeek
Bias: Bearish
Setup: MACD and EMAs confirm bearish setup; near max pain
Trade: Buy $340P @ $5.60
Confidence: 75%
✅ Consensus Summary
📉 4 of 5 models favor puts on TSLA
🧲 Max Pain at $340 is the dominant magnet
📉 Bearish MACD across timeframes; under EMAs
🔄 Short-term RSI is oversold — bounce risk acknowledged
📰 Mixed Tesla headlines & falling VIX offer minor support
🎯 Recommended Trade
💡 Strategy: Bearish Naked Weekly Put
🔘 Ticker: TSLA
📉 Direction: PUT
🎯 Strike: $340
💵 Entry: $5.60
🎯 Profit Target: $8.40 (+50%)
🛑 Stop Loss: $4.48 (−20%)
📏 Size: 1 contract
📅 Expiry: 2025-06-06
⏰ Entry Timing: Market Open
📈 Confidence: 73%
⚠️ Key Risks to Watch
🔄 Bounce Risk: RSI oversold — snapback could occur
📰 Tesla news (Powerwall, China) could surprise to upside
🧲 Max pain at $340 may anchor price near entry
⌛ Weekly theta decay means early move is essential

TSLA long term game!See I think TSLA is a long term stock. With the innovation it is doing in energy, automobile, robotaxi(FSD), robotics... I believe it is in the front of technology for human kind.
TSLA will inevitably impact each and every aspect of our day to day life.
There is recent pullback potential to the Fib 0.5 of price $290, and that price is the resistance turned support. I believe it will retrace and people who were thinking to buy TSLA, might be a nice chance, just my simple opinion.
A few bullish candle stick pattern in $282-$290 will support the long movement, I believe.
