Technical Analysis (TA) for $TURBOFuture Prediction:
MYX:TURBO 's ability to maintain its current upward trajectory will depend on sustained volume and broader market sentiment. With increased accessibility on Coinbase, the coin could attract institutional interest, potentially driving the price toward $0.20 - $0.60 or higher in the medium term. However, traders should be mindful of macroeconomic factors affecting the crypto market as a whole, such as regulatory news or Bitcoin's price movements.
Strategy:
Short-term traders:
Monitor price action around $0.13 for a potential breakout.
Long-term investors:
Consider dollar-cost averaging at support levels ($0.12 and below).
Keep an eye on updates related to MYX:TURBO ’s ecosystem and adoption.
Conclusion:
Breaking the $0.13 barrier is a pivotal moment for MYX:TURBO , signaling strong interest and potential for continued growth. While the outlook is positive, traders and investors should remain vigilant for market corrections. By combining technical analysis with careful risk management, participants can capitalize on the opportunities MYX:TURBO presents in this new phase of its journey.
TURBOUSDT trade ideas

TURBO | Feels Like TurboTURBO forming inverse head and shoulder pattern, a break above neckline will trigger a positive stance. Expected 84% - 185% bullish wave in upcoming days!

turboSupport and press the rocket to cheer me up
Observe the ten percent loss limit
Stay away from Bitcoins
Feel free to buy and sell and post your comments

tourboSupport and press the rocket to cheer me up
Observe the ten percent loss limit
Stay away from Bitcoins
Feel free to buy and sell and post your comments

TURBO/USDT 200% from here onTurbo/USDT has shown beautiful percentage now getting fuel for the rocket with 200% in the bag.

TURBOUSDTLong on turbo golden cross 50/200 EMA
100X, 0.69 cent i am targetting this bull rununtill jan 10
recenrtly listed on coin base,
AI meme coin -with fund 69 doller created most memable meme coin in the history
strong holding whale
TA- showing HH and HL , retested multiple time
recommended
X to 10X
if you are experience trader other wise buy on spot , DYOR
dont be FOMO wait for daily LOW
or LOWER LOW for good entry

TURBOUSDT 1DTURBO ~ 1D
#TURBO If you still have Conviction on this coin. Buy gradually within this support Block,. With a short term target of at least 15%++

TURBO - Bullish Chart - Breakout & ATHHello Traders
Today I share my opinion about the TURBO coin.
The chart looks very bullish and is preparing to breakout soon. Once this breaks out I think we will get a new all time high shortly after.
Support area: 0.007$ area
Resistance: 0.01$ area & 0.012$ area
If we breakout the triangle and flip the 0.01$ resistance I believe this will pump a lot. Another important thing is that this coin is still not listed on coinbase so this would be a potential reason for a massive price increase.

Giving $TURBO a Second Chance: Positioned for Outperformance
OKX:TURBOUSDT is a bit behind $NEIRO by a 2x. If CRYPTOCAP:ETH starts moving in Q1 (which I expect), I see MYX:TURBO outperforming, along with related #memes under ETH.
Buying anything close to or below 0.0069.
Targeting a 4x move from there.

SAME PATTERN May24 -----> 0,118 15x End of December 24The same pattern, if it repeats itself then it will be 15x higher than now. It can go higher or lower. As I said, these are just assumptions from the past. This is not a recommendation to buy.
Guys i am not an chart Expert -- ok.. There are many other opportunities in Crypto, please make your own research.

#TURBO Primed for a 200%+ Rally! RR 1:18MYX:TURBO looks primed for action! It's bouncing off the support level, and with a stop loss at $0.6223, this trade has strong potential.
Remember, When TURBO moves, it moves fast, probably triple-digit gains in just a few daily candles are not uncommon.
Don’t miss out if this fits your strategy. I am holding!
dyor, nfa.
Do hit that like button if you want me to post more.
Thank you
#PEACE

Turbo/USDT - 4h - Trade plan. Turbo is in demand zone.
Trade Plan Mentioned.
NFA, DYOR. this is my personal trade plan.

Turbo - bullishI think this is great opportunity to enter long here. We have nice retracement of the price to the lower bound. Im expecting that from here ALT SEASON STARTS and it will grow. How much? I dont know. It can be even x10 from here.

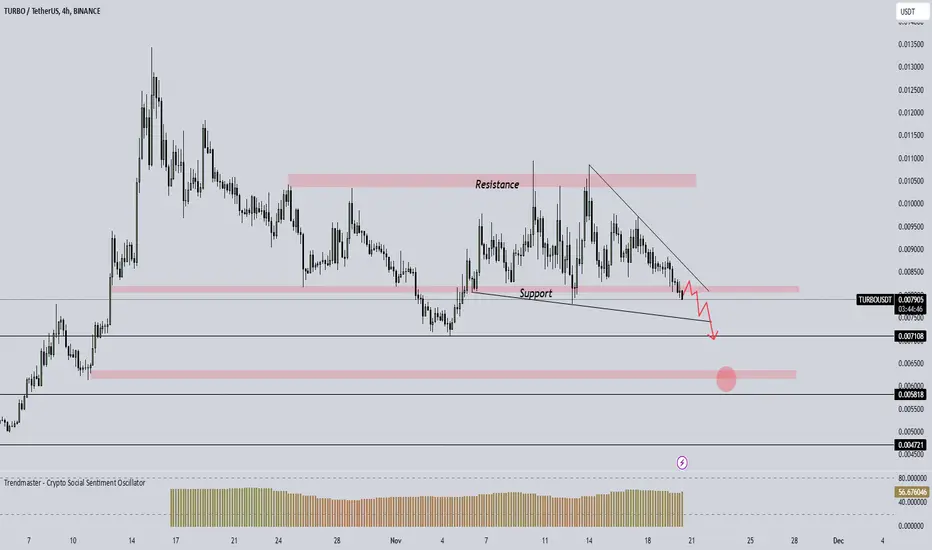
Sell TURBO/USDT Triangle Breakout in H4The TURBO/USDT pair on the H4 timeframe presents a Potential Selling Opportunity due to a recent breakout from a Triangle Pattern. This suggests a shift in momentum towards the downside in the coming Days. BINANCE:TURBOUSDT
Possible Short Trade:
Entry: Consider Entering A Short Position Below the Broken Trendline Of The Triangle After Confirmation. Ideally, This Would Be Around 0.0081
Target Levels:
1st Support – 0.0047
2nd Support – 0.0023
Your likes and comments are incredibly motivating and will encourage me to share more analysis with you.
Best Regards, KABHI FOREX TRADING
Thank you.

Now we did touch the below Line of the tunnel.. You can see what did happen by touching the below line of the tunnel in the past.
It´s pump exponential.. let´s look if this happen again or we crashed..

Turbo / Usdt BINANCE:TURBOUSDT
---
**I See a Bearish Breakout & Retest 📉**:
Based on the current market structure, I’m anticipating a **bearish breakout** 🔻. The price has broken through key support levels, and now we're waiting to see if we get a **retest** of those levels. If the price tests and fails to break back above, it could confirm further downside ahead. This type of move often signals a **continuation of the downtrend**, so it’s crucial to be cautious when considering long positions.
**I Don't Trust Long Positions Yet 🚫**:
At this point, I don't have confidence in **long positions** 💼. The market sentiment is showing signs of a bearish trend, and there's a strong possibility that prices could continue to decline before they reverse. It’s important to stay cautious and wait for confirmation before entering new positions. **Patience is key** during times of uncertainty. ⏳
**Bearish Correction Could Be Seen on the Crypto Market Soon ⚠️**:
The **crypto market** has been on a bullish run for a while, but after such a significant move, a **correction** is expected. **Corrections** 🛑 are **normal** in a bull market, and they often happen after a period of strong upward momentum. This is a healthy part of the market cycle, allowing for a **retest** of key support areas before potentially pushing higher again. However, during a correction, prices typically move lower, and volatility can increase 📉.
This correction could offer **buying opportunities** 📊 once the market finds new support and shows signs of stabilization, but until then, we may need to be cautious with any new **long positions**. **Bearish corrections** often lead to more favorable entry points later on, but it’s important to wait for a solid confirmation of a bottom before acting. 🧐
**Key Takeaways**:
- The market may be undergoing a **bearish breakout**, and a **retest** could follow 📉.
- **Long positions** are not recommended at this point. 🚫
- A **bearish correction** is a healthy and normal part of the market cycle, especially after strong bull runs ⚠️.
- Stay patient and wait for clear signs of **stabilization** before entering the market 📈.
*Disclaimer*: This is **not financial advice** ⚠️. Always conduct your own research and analysis before making any investment decisions. 💡📊
---
Past Pattern shows by touching Turbo goes parabolic..In the past Turbo did touch the below line of the tunnel and it goes parabolic.. ok one time not.
But now we are touching this below Tunne line again.. what will happen.. this is only for entertainment..


TURBO at 1 US Dollar next Year in June to November !!If this tunnel holds than it can go higher.. good luck.. this is not an financial advice. Only my ideas..

Next year TURBO can hit 0,70 and more !!This Chart show how high can Turbo go next year until June 25.

Turbo = A small drop and really good rallyHello Everyone. My name is Omid and I'm a newbie trainer in crypto market.
I use nds strategy for my predictions
For Turbo my prediction is that as you can see at the moment we might have a slight correction down to 0.0086 and after that with proper volume we definitely gonna have a rally to drawn targets
NOTE: I'm gonna wait till drop happen then will buy . The long position is for showing boundaries only .
wish everyone great luck

TURBO BREAKOUT ALERT: READY FOR A 150-160% SURGE!Hey everyone!
If you’re finding value in this analysis, don’t forget to hit that 👍 and follow for more updates!
TURBO is showing strong momentum! It’s breaking out of a bull flag formation on the 4-hour chart and has successfully retested the pattern, signaling readiness for a potential 150-160% rally. Accumulate some now and consider adding on any dips.
Entry Range: $0.0092 - $0.0099
Target: 150-160% gain
Stop Loss: $0.0084
This setup shows a powerful bullish trend for TURBO Coin! What are your thoughts on its potential? Share your analysis and insights in the comments below!

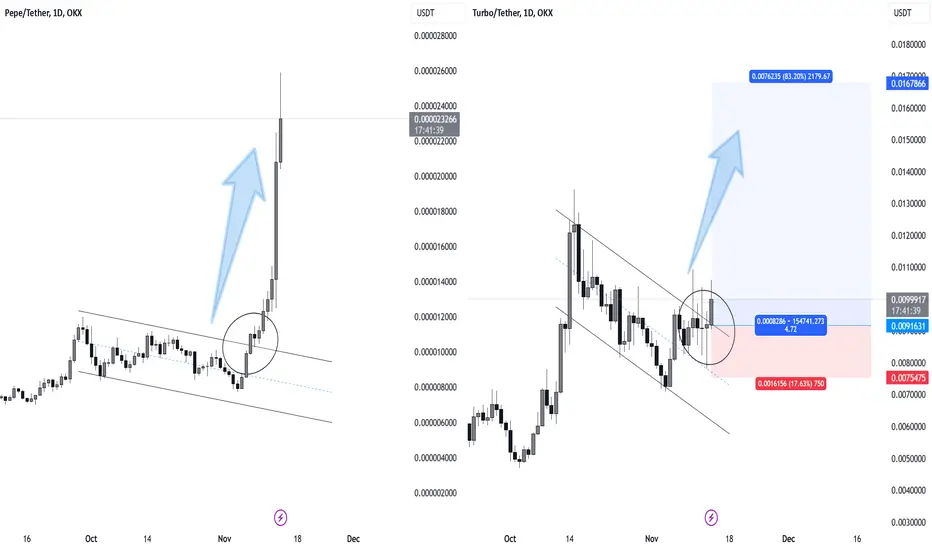
TURBO/USDT Analysis$TURBO/USDT Analysis :
Following the strong rally of $PEPE/USDT, which broke out of a descending channel and surged upwards, there are signs that $TURBO/USDT could follow a similar bullish trajectory.
Entry Level : The current price around 0.0091631
Target Levels : The next target is set at 0.0167866
MYX:TURBO is expected to follow a similar bullish pattern to CRYPTOCAP:PEPE after its breakout from the descending channel. This presents a strong upside opportunity if the buying interest continues with similar momentum.