BXY Against Resistance ZoneHi,
BXY on the 1-hour chart remains bullish, supported by the 133.96 low, which is attributed to the bullish pin from Thursday, May 22, 2025. This is a thin area, consolidating bullishly against the 134.30 level, driven more by price volatility than by price momentum.
There is strong bullish pressure to test 134.69, so a potential break of that resistance could lead to a rise up to 135.02.
If the price falls and breaks below 133.75, then the setup will be invalid.
Happy trading,
K.
Not trading advice.
BXY trade ideas

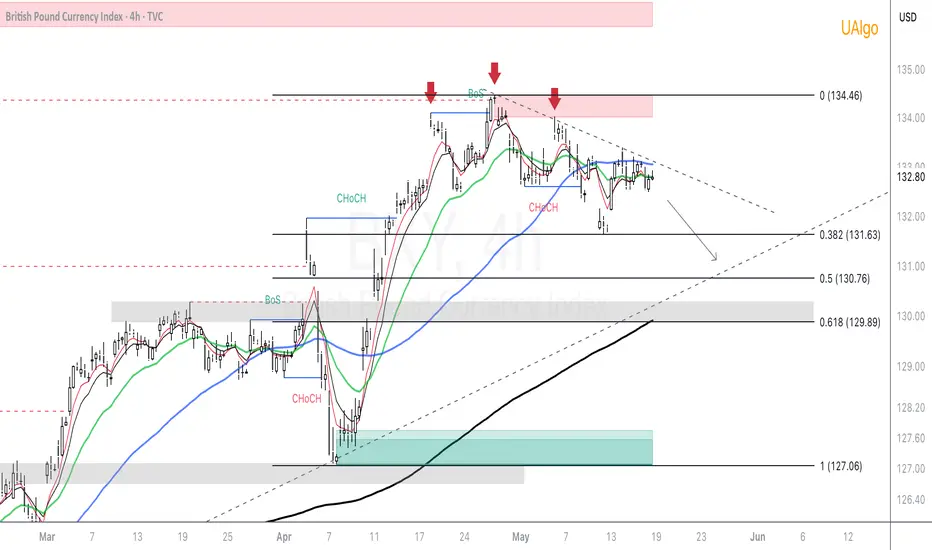
BXY Trade Plan (BXY 18/05)TVC:BXY
Price is in long term bull trend but with medium term flag pattern forming which is confirmed by the head and shoulder pattern we have recently seen.
I would like to see price move a little lower into Fib level range and then push higher so the plan here is to wait before heading north.
1hr price is confirming down trend so plan is to target crosses on the lower time frames.
BXY Bearish Crab Pattern BXY Bearish Crab Pattern spotted on the GBP Index.
🦀📉 Potential reversal zone in sight.
Time to reassess positions and manage risk carefully.
Always trade with a plan!

BXY Bullish OptimismHello there,
BXY has moved above the RSI 25 and crossed the RSI moving average (MA), indicating an attempt by the bulls to push the market higher from the oversold region.
If the price holds above the RSI MA, there is a greater likelihood of moving higher. The desired price target is 129.10.
More pips to you! All the best and Happy Trading,
K.
Not trading advice

BXY 11/11/2024 EXPECTING UP Pound looking good in a potential area for longing on the 4H chart so lets see what happens thanks for watching!

Trend of British Pound Currency Indexthe detail is shown in the above Idea.
I made this Idea based on Candlestick Analysis and Harmonic pattern.
bear market turning into bull Market with GBP Crab.
Bullish crab pattern
It begins at point X and extends to point A. Point X may be anywhere on the price chart, but looking for a bull pattern under oversold circumstances is a smart practice.
Wave AB must retrace downward to the XA wave's Fibonacci levels of 0.382 - 0.618.
Wave BC must retrace the AB wave's 0.382 - 0.886 Fibonacci levels.
The final wave CD is the longest and must reach the BC wave's 2.24 - 3.61 Fibonacci levels.

British Pound Currency Index, heading where next?British pound currently is having a strong headwind to reduce the pound strengthen coming to the market in play. It just started and the strong headwind is the potential pause of the BOE rate hike coming in 2024 as the inflation CPI of 11% previously in 2022 by the UK CPI is currently only at 4.60%. Drop more than half.
The pound strength will reduce and not increase due to 2 strong headwind reason here.
1) the UK GDP for the past few quarters is hovering slightly below 0% and slightly higher than 0% also. No a very good economic condition and the pound will not be strengthen by economic factors.
2) The BOE funds rate interest is coming to a peak and will most likely not be raise higher base on the CPI and core PCE reading for UK. Euro central bank will be cutting rate soon due to very fast inflation drop but this reason does not come into play for UK core PCE reading.
There is only 24 days left in 2023 and if there is a drop in the pound strength then the next medium support level of 4 hours charts is at 120.17. The current reading for the pound index is 125.74.
We might reach this reading this year end or early next year in January 2024.
If the pound strengthen the max will go is at the 1-day resistance at 130.57. This is most likely not happening soon. Unless there is a very bad CPI and core PCE data for the next 3 months for UK. Still think this is high unlikely to happen due to the restrictive rate of the BOE funds rate at 5.25%.
If BOE cut rates next year in 2024 the pound strength index will most likely head to 1 day support level at 106.10 if no strong tailwind that will cause the Pound to strengthen.
When the pound in the near term reach 120.17, trader need to give time of 2 to 3 weeks to reassess the situation before deciding to sell or buy or hold.
make sure confirm news of the 4 following is there before deciding.
1) jobs report not sure if it is JOLTS like the USA.
2) UK monthly CPI
3) UK monthly PCE
4) BOE monthly meeting outcome.

"Analyzing BXY's Descending Triangle: Waiting for a Breakout DirDescending Triangle Pattern: You've identified a descending triangle pattern on BXY's chart. This pattern typically consists of a horizontal support line and a series of lower highs, forming a triangle shape. It's considered a bearish pattern and often leads to a breakout in a downward direction.
Daily Support Zone: BXY is currently trading near a daily support zone. This means there's a level where the price has previously found support, suggesting that it might be a critical point for the asset.
Weekly Support Zone: Additionally, you've mentioned that the daily support zone is above a weekly support zone. This is significant because weekly support zones are generally stronger than daily ones and can act as significant price barriers.
Breakout Anticipation: You're patiently waiting for a breakout of the descending triangle, and your intuition is suggesting that the breakout might be to the downside. Your hunch is that the price will test the weekly support or demand zone before making its next significant move.
Your analysis is quite thorough, but remember to consider a few more points:
Confirmation: Wait for a clear breakout before making any trading decisions. Confirm the direction of the breakout and look for volume support to validate the move.
Stop-Loss and Take-Profit: Consider placing stop-loss orders to manage your risk and take-profit orders to secure your gains when trading the breakout.
Market Sentiment: Keep an eye on broader market sentiment and external factors that might affect BXY's price movement.
Risk Management: Ensure you have a clear risk management plan in place to protect your capital, especially in the event of an unexpected breakout.
In summary, your analysis of BXY's descending triangle pattern and the support zones is comprehensive. However, always exercise caution and have a well-defined strategy when making trading decisions. Market conditions can change, so it's important to adapt your approach accordingly.
#BXYAnalysis
#DescendingTriangle
#TechnicalAnalysis
#SupportZones
#BreakoutStrategy
#TradingSignals
#PricePatterns
#WeeklySupport
#MarketAnalysis
#PricePrediction
#RiskManagement
#MarketSentiment
#TradingStrategy
#CryptoTrading
#PriceBreakout

BXY Analysis 10/10/2023As you can see with the current state of the BXY market, it is currently in and upwards trend creating higher lows consistently marked by the circles on the closes of the wicks. The red rectangle marks out the area where price was operating below my entry price on GBP/USD and as you can see the arrows show the date range that buyers and sellers were actually successfully transacting below this price as seen by the open and closed candles in this range. The total time spent with buyers and sellers transacting below this range was 8 days and 8 hours and this is the lowest it has transacted in the last 7 months. This is why I have set my stop loss around this area as I do not believe that price will transact much lower than this due to the large wicks you see which represent buyers and sellers not able to find fair value and price bouncing away instead of solid closes due to buyers and sellers being unable to find a price they are both happy to transact at.

Gbp index I expect gbp index to pull back to the oderblock/ discounted area
The price have been on the down trend since I expect a massive drop on gbp pairs for the next few years

BXY, Important, Crucial BEAR-Fractals, Setup of a Next Wave!Hello There!
Welcome to my new analysis of the BXY. Within recent times there are major factors moving the BXY as the inflationary pressures within the BXY are still increasing paired with a historically high interest rate of 5.25% that was seen the last time during the financial crisis of 2008 this is already indicating a high bearish sentiment dynamic that should not be underestimated in any cases.
Also, a major stagnation within the BXY is ongoing with YoY productivity stagnating and not forming any new highs. These factors are determining an increased private sector debt demand that is near an all-time high. These high levels of private sector debt demand have been seen the last time in the financial crisis of 2008 similarly to the high interest rates. The high private sector debt demand is accelerating the bearish momentum for the BXY.
Considering the underlying chart dynamics the BXY is still trading within this enormous gigantic descending channel formation in which it has a major supply distribution channel within the upper boundaries. This supply distribution channel has been already the origin of the major bearish wave A accelerating towards the bearish direction. Exactly the same bearish fractal is setting up now once again as the BXY is pulling back off the upper resistance boundaries.
Furthermore, the BXY has already completed the massive ascending triangle formation with a substantial breakout below the lower boundary completing the whole ascending triangle formation and accelerating the bearish confirmation and continuation dynamics. Now, the BXY already activated the target zone of 115 with the completion of this gigantic ascending triangle formation once this target zone has been reached there is a high potential for further continuation.
Taking these factors into perspective, the BXY is completing two major bearish formations here, and especially with the bearish distribution channel breakout to emerge in the next times this is going to activate the next targets within the lower boundary regions of the gigantic descending channel formation to form a paramount new lower low within this whole chart. An increased interest rate together with an accelerated private sector debt demand moving to all-time highs lastly seen in the financial crisis of 2008 are going to increase the bearish dynamics.
In this manner, thank you everybody for watching my analysis of BXY. Support from your side is greatly appreciated.
VP

British Pound Plunges as Bank of England Holds Interest RatesI bring today is far from uplifting. As you may already be aware, the British Pound (GBP) has taken a significant hit in the wake of the recent decision by the Bank of England (BoE) to hold interest rates steady. This unforeseen turn of events has left many traders like yourself feeling disheartened and uncertain about the future of GBP.
The BoE's decision to maintain interest rates has sent shockwaves throughout the financial markets, triggering a substantial decline in the value of the British Pound. This unfortunate turn of events has left the currency vulnerable and exposed to further downside risks. While it is indeed disheartening to witness such a decline, it is crucial for us to adapt and seize opportunities even in the face of adversity.
Given the current state of affairs, I would like to encourage you to consider taking advantage of the situation by exploring short positions on GBP. The downward trajectory of the British Pound may present an opportunity for you to potentially profit from this unfortunate turn of events. However, please remember that trading involves risks, and it is essential to conduct thorough analysis and consider your risk tolerance before making any investment decisions.
In times like these, it is crucial for traders like yourself to stay informed and adapt to the ever-changing market conditions. Monitoring economic indicators, central bank decisions, and geopolitical developments will be key in navigating the turbulent waters of the foreign exchange market.
If you require any further information or assistance regarding shorting GBP or any other trading-related queries, please don't hesitate to comment below. We are here to support you and provide you with the necessary guidance to make informed trading decisions during these challenging times.
Remember, even in the face of adversity, the trading world remains full of opportunities. By staying informed, adapting your strategies, and seeking professional advice, you can navigate these uncertain waters and potentially turn this unfortunate situation to your advantage.

BXY Forecast| LL for PullbackBXY looks bearish on the daily chart. It has the potential to fall into the 124.30–123.34 range area for a WXY sequence and potentially retrace for a significant pullback.
The 123.34 level needs to be watched for any bearish continuation in that area.

Brit Bulls seems to relax after a small rally.....GBP Index seems to continue its journey after a small retracement to previous Resistance Flip Support Now....... Price seems to retrace from 1.382 ibo Level and RSI Bearish Divergence on 1 Hour TF.

GBP May goes down for quite some monthsBut Possibly after daily or h4 retracements- watchout for smaller tf. Anyway, more to downmove in major movements.

THE BRITS ARE NOT OVER !Before talking about what direction NASDAQ:GBP pairs should take, just check its #INDEX before decide.
It seems to be clear that #UK won't throw the towel and give up.
They have conquered nearly 70% of the planet; English is the most spoken language.
The small British island could still hold a few surprises!
130 seems to be claimed...
Don Pablo

GBP so buuulish!!Brace urselves guys for a very bullish pounds week.. i am looking to go long Gbp usd
(not a financial advice)!

BXY Weekly Analysisbear market turning into bull Market macd bullish above 50/50 but signal still below ma rsi bullish above 50/50 signal below ma market may see stagflation with bearsish attitude for a bit. but expected to incline
TP will be 70% incline unless economic sentiment confirms extra sentiment to execute 80% TP during weekly trading.
Climbage:
INCLINE: 2.62%
DECLINE 1.47%

BXY Weekly analysisBear market (N): macd (N) right on 50/50 signal under ma RSI bull above 50/50 signal above ma suggesting decline to come.
climbage projectile:
P1:
INCLINE: 2.65%
DECLINE: 2.72%

BXY ANALYSIS mar 27-3 SELLMarket hinting at to come depreciation. market forming head & shoulders expressing significant decline macd is bullish above 50/50 but signal under ma hinting at minor up movement switching focus to decline in the very near future. RSI on 50/50 area crossed just above sitting on top of ma waiting for decline era. expect market to take on significant drop
Weekly Climbage Forecast:
INCLINE: 1.87%
DECLINE: -4.28%

BXY ANALYSISmarket currently (N) may look like a decline but can expect to break with BULL momentum unless economic sentiment has investors worried this soley based off market sentiment
WEEKLY TP@124.51
MACD shows N market signal on but below ma both sitting on 50/50 area i anticipte bullish momentum but economic sentiment may affect because speaking sentiment wise i am tracking a mediocre decline middle of the week so trend may continue this bearish energy by middle of week so in all market can be said to have a (N) bullish attitude that will turn bearish.
RSI peak reach crossed over ma above 50/50
WEEKLY TP for if bearish momentum takes primary role @119.26
weekly climbage
INCLINE- 1.68%
DECLINE- (-1.18)

BXY NAMFX H1 Renko next week 12-03-2023 trend analysisBXY NAMFX H4 Renko next week 12-03-2023 trend analysis, in the uptrend wave we can see a sideway Price Channel between C'D'

BXY NAMFX H4 Renko next week 12-03-2023 trend analysisBXY NAMFX H4 Renko next week 12-03-2023 trend analysis, in the uptrend wave we can see a Bullish Price Channel
