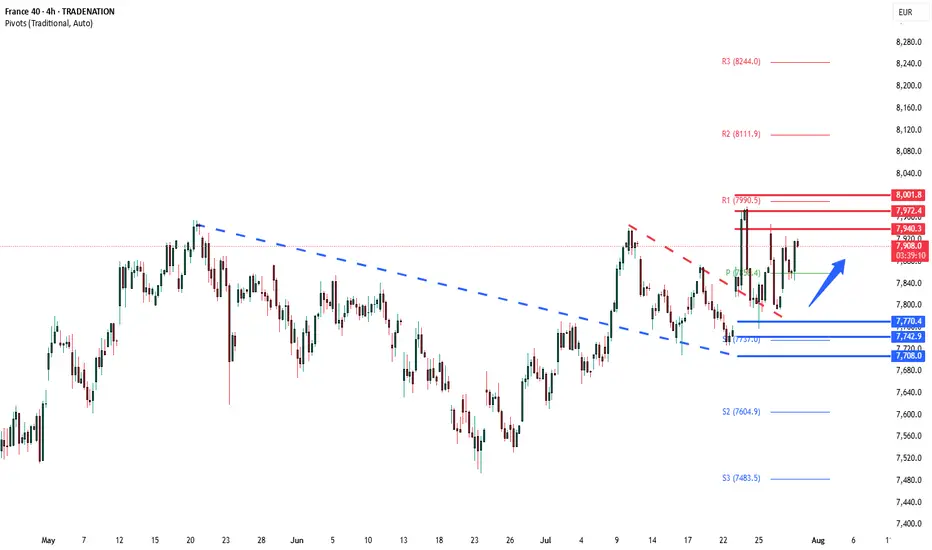
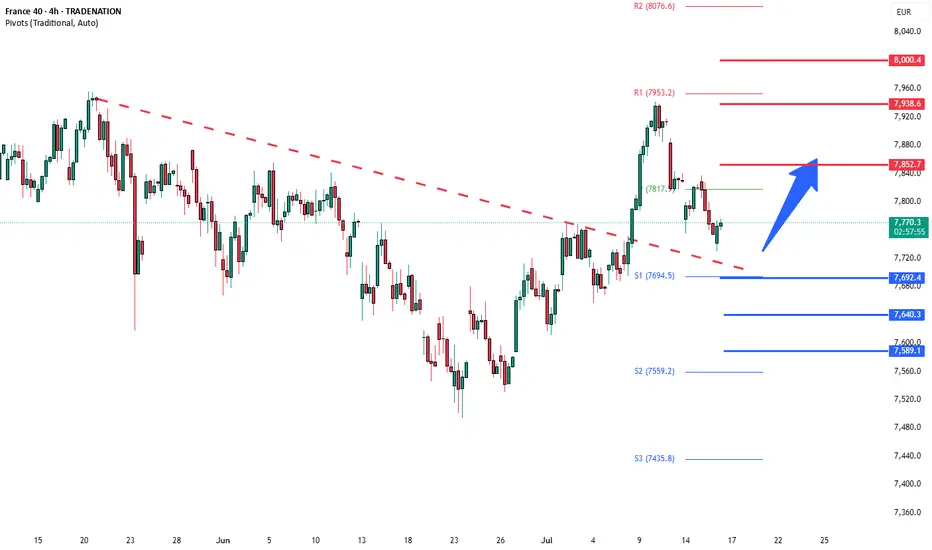
CAC40 Bullish breakout retestThe CAC 40 index continues to display a bullish bias, underpinned by a well-established rising trend. Recent intraday price action indicates a breakout from consolidation, suggesting renewed upward momentum.
Key Technical Levels:
Support:
7770 – This level marks the prior consolidation zone and n
About CAC 40 Index
The CAC 40 is a capitalization-weighted index serving as a benchmark for funds investing in the French stock market. CAC 40 index was launched in 1987 with a base value of 1,000 and it tracks top 40 companies traded on the Euronext Paris exchange. It is similar to the Dow Jones Industrial Average in that it is the most commonly used index that represents the overall level and direction of the market in France and the French economy in general. Most of the weight of the index is represented in sectors such as Pharmaceuticals, Banking, and Oil equipment.
Related indices
"FRA40/CAC40 HEIST! Bullish Loot Before Bear Trap – Act Fast!"💰 FRA40/CAC40 "FRANCE40" INDEX HEIST – THIEF TRADING STYLE MASTER PLAN 🏴☠️🚀
🔥 Steal the Market Like a Pro – Bullish Loot & Escape Before the Trap! 🔥
🤑 GREETINGS, FELLOW MONEY MAKERS & MARKET ROBBERS!
🌟 Hi! Hola! Ola! Bonjour! Hallo! Marhaba! 🌟
This is your VIP invite to the ultimate FRA40/CAC40 he

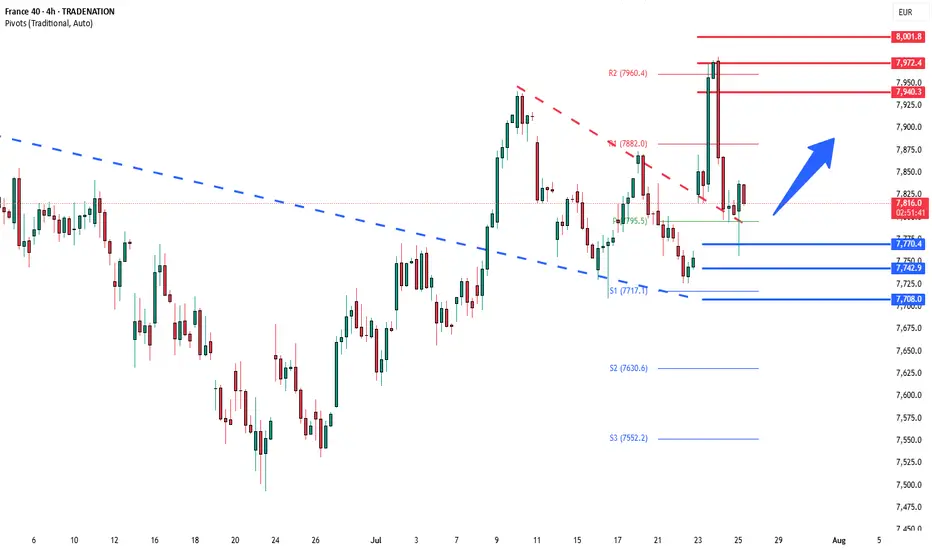
CAC breakout retest support at 7770The CAC 40 index continues to display a bullish bias, underpinned by a well-established rising trend. Recent intraday price action indicates a breakout from consolidation, suggesting renewed upward momentum.
Key Technical Levels:
Support:
7770 – This level marks the prior consolidation zone and n
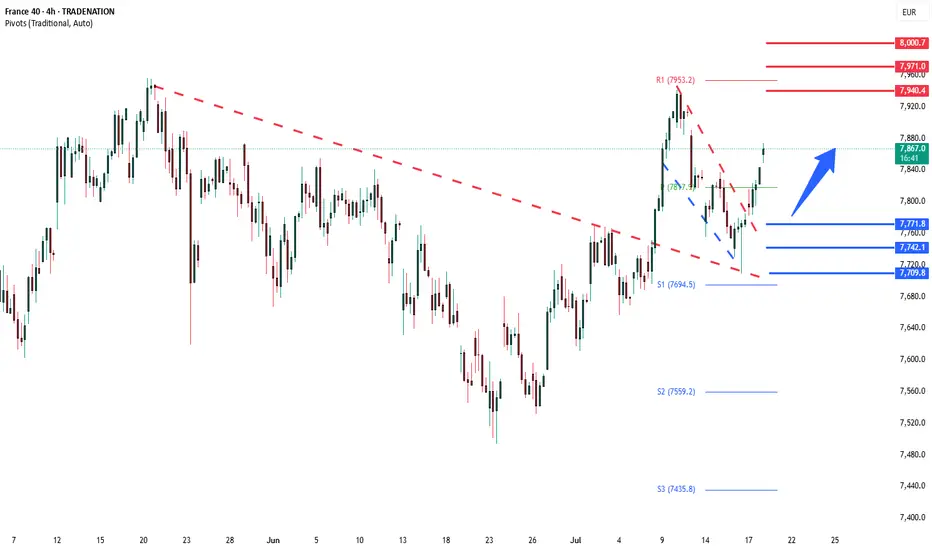
CAC40 Bullish consolidation breakout The CAC40 price action sentiment appears Bullish, supported by the current rising trend. The recent intraday price action appears to be a consolidation breakout.
The key trading level is at the 7770 level, the previous consolidation price range. A corrective pullback from current levels and a bulli
CAC40 Bullish breakout retest support at 7770The CAC40 price action sentiment appears Bullish, supported by the current rising trend. The recent intraday price action appears to be a consolidation breakout.
The key trading level is at the 7770 level, the previous consolidation price range. A corrective pullback from current levels and a bul
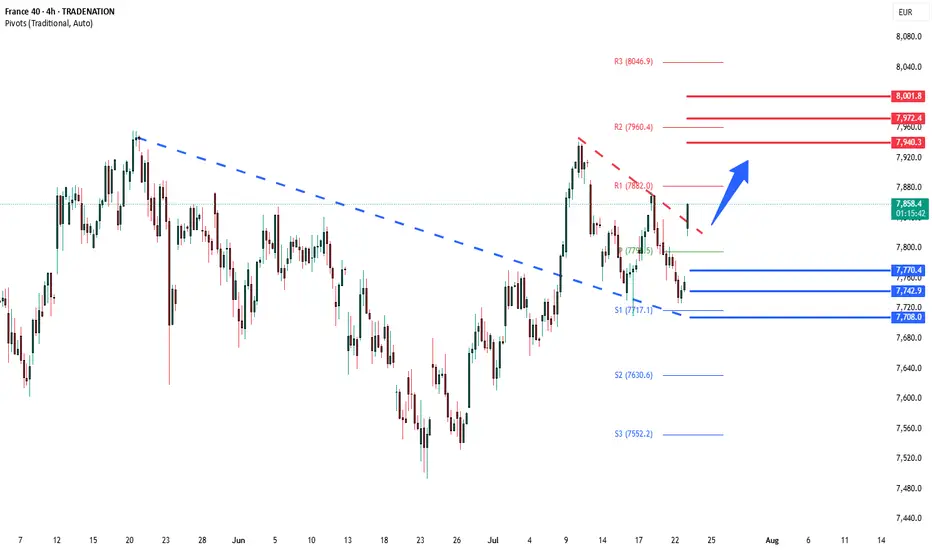
CAC40 Bullish breakout retest support at 7690The CAC40 remains in a bullish trend, with recent price action showing signs of a corrective pullback within the broader uptrend.
Support Zone: 7960 – a key level from previous consolidation. Price is currently testing or approaching this level.
A bullish rebound from 7690 would confirm ongoing up
FRANCE 40 Heist in Progress | Bullish Reversal Zone Spotted.💼 CAC40 Market Heist: Thief Trading Blueprint for Smart Traders (Swing/Day Trade Edition) 💼
🌍 Bonjour, Hola, Hallo, Marhaba, Ola, Hello! 🌍
Welcome to all Market Hustlers, Silent Snipers, and Profit Seekers! 🤑💸🎯
We're back with a precision-built Thief Trading Plan — this time targeting the FRANCE40

France 40 is priming up for strong upside to 8,673France is definitely setting itself for upside to come.
We have positive data from the love country including:
📈 Oversold Conditions
The CAC 40 was heavily sold off — now it’s ripe for a bounce.
🏦 ECB Rate Cuts
Lower interest rates fuel investor appetite for European equities.
💼 Strong Cor

CAC40 Bullish breakout supported at 7560Key Support and Resistance Levels
Resistance Level 1: 7850
Resistance Level 2: 7930
Resistance Level 3: 7995
Support Level 1: 7560
Support Level 2: 7490
Support Level 3: 7410
This communication is for informational purposes only and should not be viewed as any form of recommendation as to a p

France 40: A short/medium term buyHello,
The France 40 Index is currently forming a compelling bullish setup, characterized by a contracting triangle pattern—typically a continuation structure that signals the potential for further upward movement. Price action is consolidating within this triangle, indicating that a breakout could

See all ideas
Summarizing what the indicators are suggesting.
Oscillators
Neutral
SellBuy
Strong sellStrong buy
Strong sellSellNeutralBuyStrong buy
Oscillators
Neutral
SellBuy
Strong sellStrong buy
Strong sellSellNeutralBuyStrong buy
Summary
Neutral
SellBuy
Strong sellStrong buy
Strong sellSellNeutralBuyStrong buy
Summary
Neutral
SellBuy
Strong sellStrong buy
Strong sellSellNeutralBuyStrong buy
Summary
Neutral
SellBuy
Strong sellStrong buy
Strong sellSellNeutralBuyStrong buy
Moving Averages
Neutral
SellBuy
Strong sellStrong buy
Strong sellSellNeutralBuyStrong buy
Moving Averages
Neutral
SellBuy
Strong sellStrong buy
Strong sellSellNeutralBuyStrong buy
Displays a symbol's price movements over previous years to identify recurring trends.
Frequently Asked Questions
The current value of CAC 40 Index is 7,546.17 EUR — it has fallen by −2.91% in the past 24 hours. Track the index more closely on the CAC 40 Index chart.
CAC 40 Index reached its highest quote on May 10, 2024 — 8,259.19 EUR. See more data on the CAC 40 Index chart.
The lowest ever quote of CAC 40 Index is 893.82 EUR. It was reached on Jan 29, 1988. See more data on the CAC 40 Index chart.
CAC 40 Index value has decreased by −3.04% in the past week, since last month it has shown a −2.13% decrease, and over the year it's increased by 0.91%. Keep track of all changes on the CAC 40 Index chart.
CAC 40 Index is just a number that lets you track performance of the instruments comprising the index, so you can't invest in it directly. But you can buy CAC 40 Index futures or funds or invest in its components.