US30; Heikin Ashi Trade Idea📈 Hey Traders!
Here’s a fresh outlook from my trading desk. If you’ve been following me for a while, you already know my approach:
🧩 I trade Supply & Demand zones using Heikin Ashi chart on the 4H timeframe.
🧠 I keep it mechanical and clean — no messy charts, no guessing games.
❌ No trendlines, no fixed sessions, no patterns, no indicator overload.
❌ No overanalyzing market structure or imbalances.
❌ No scalping, and no need to be glued to the screen.
✅ I trade exclusively with limit orders, so it’s more of a set-and-forget style.
✅ This means more freedom, less screen time, and a focus on quality setups.
✅ Just a simplified, structured plan and a calm mindset.
💬 Let’s Talk:
💡Do you trade supply & demand too ?
💡What’s your go-to timeframe ?
💡Ever tried Heikin Ashi ?
📩 Got questions about my strategy or setup? Drop them below — ask me anything, I’m here to share.
Let’s grow together and keep it simple. 👊
DJI trade ideas

Us30S30 is currently respecting a key support zone, showing strong buyer interest. As long as this level holds, the bias remains bullish, with potential for price to push higher toward the next resistance levels.
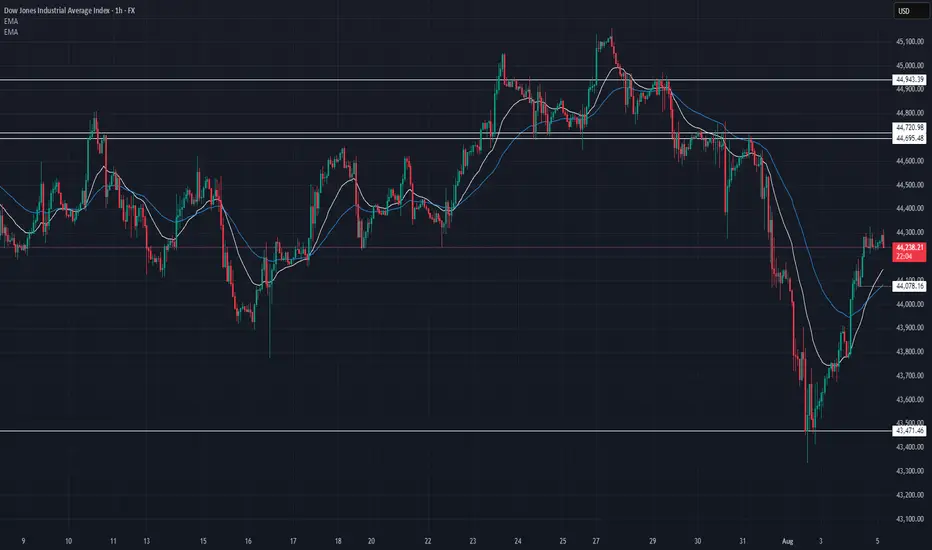
08/05/2025📍 US30 Technical Breakdown – 08/05/2025
US30 bounced hard from the 43,500 lows and is now trading near 44,250, reclaiming key short-term moving averages. The index is approaching a major resistance zone around 44,600–44,720, where sellers previously stepped in.
Momentum is shifting in favor of bulls, but this move could stall unless we see a clean break above the previous breakdown levels.
📊 Current Market Behavior:
📈 Strong bounce off 43,500
📊 Trading above EMAs — short-term momentum bullish
🧱 Resistance overhead at 44,600+
⚠️ Potential lower high if bulls fail to reclaim 44,720+
📌 Key Levels:
🔹 Resistance Zones:
44,300 → Intraday resistance (current level)
44,600–44,720 → Key breakout test zone
44,943 → Major rejection point
🔹 Support Zones:
44,078 → EMA confluence support
43,600–43,500 → Bounce zone
43,471 → Prior low
🧠 Bias:
📈 Neutral to Bullish Intraday
Buyers in control short term, but critical resistance ahead. A failure at 44,600–44,720 would favor reversion. Breakout = bullish continuation.
Will The Soft NFP Data Resume the Strength of Dow Jones?Macro approach:
- The Dow Jones Industrial Average advanced this week, rebounding strongly as risk appetite improved following last week’s pullback, supported by a soft jobs report and easing global tariff concerns.
- Sentiment was aided by the Fed’s increased hopes of a near-term rate cut after Non-farm Payrolls missed expectations, prompting a 1.3% surge on Monday. Broader market sectors responded favorably to resilient earnings and softer economic prints.
- The index may remain sensitive to upcoming US inflation data, US service sector data and Fed communications, with labor market softness and further trade headlines poised to influence direction this and next week.
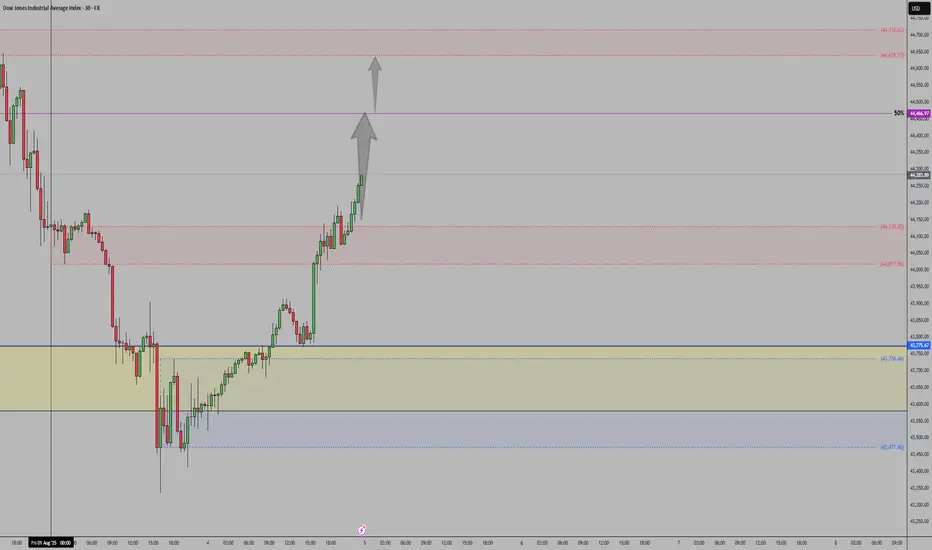
Technical approach:
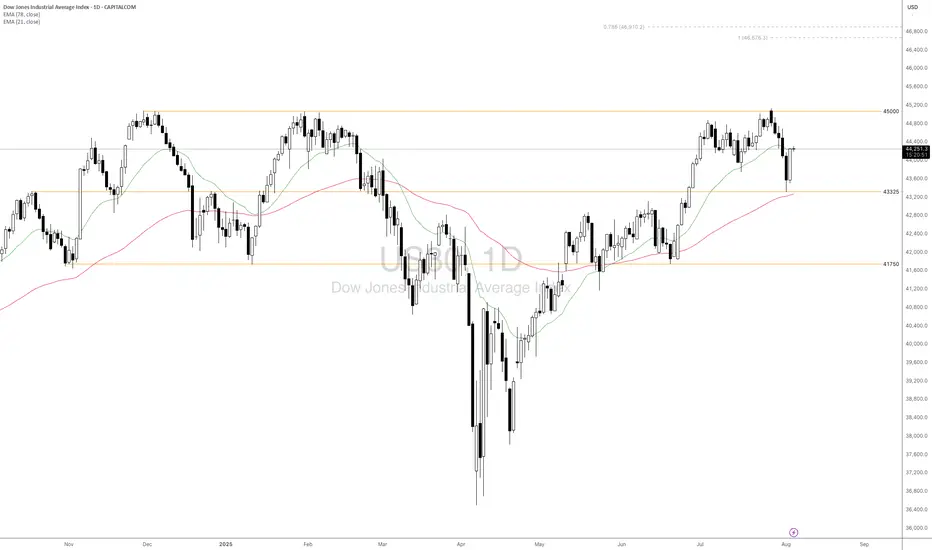
- US30 significantly rebounded yesterday, erasing half of the losses from the last 5-losing streak last week. The price is hovering around EMA21, indicating a short-term sideways momentum and await for an apparent breakout to determine the trend.
- If US30 breaks above key resistance at 45000, the price may surge further to test the Fibo Extension confluencing area around 46800.
- On the contrary, failing to hold above the support at 43325, confluence with EMA78, may prompt a deeper correction to the following support at 41750.
Analysis by: Dat Tong, Senior Financial Markets Strategist at Exness
Dow Jones Index (US30) Technical Analysis:The Dow Jones Index has bounced from the 43,350 support after a sharp decline, currently trading near 44,000, testing nearby resistance.
🔹 Bearish Scenario:
If the price fails to break above 44,200 and selling pressure resumes, a drop below 43,800 could push the index back toward the 43,350 support area.
🔹 Bullish Scenario:
If the index breaks and holds above 44,200, the bullish move may continue toward 44,700, with further potential toward the 45,150 resistance zone.
⚠️ Disclaimer:
This analysis is not financial advice. It is recommended to monitor the markets and carefully analyze the data before making any investment decisions.
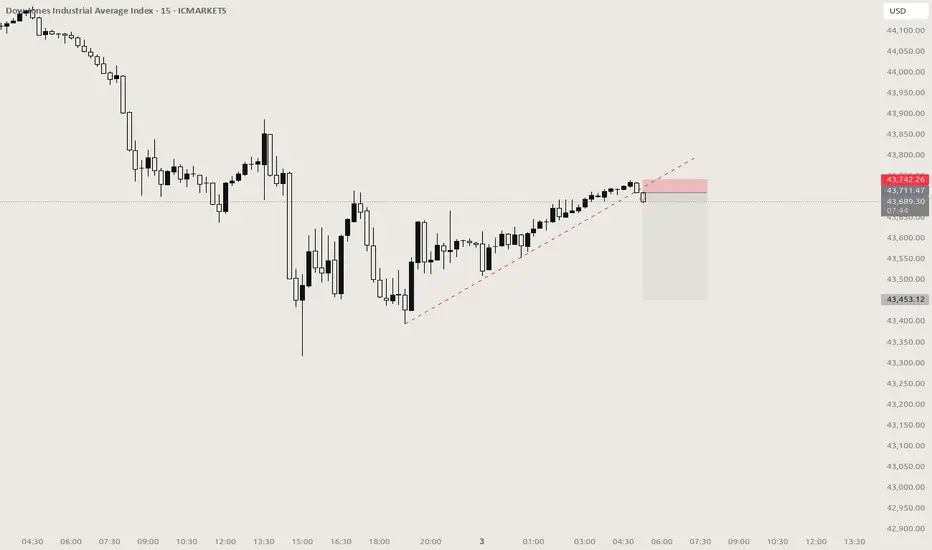
Sell US30US30 Sell Idea
Bearish Flag Pattern at NY open. Price should rapidly decline in the next few hours

US30 ShortUS30 Short Setup – Bearish Retest Play
Idea: Looking for a short opportunity after a clean break of structure and trendline.
Breakdown:
Trendline Break: The rising trendline (yellow) has been decisively broken, signaling a shift in market structure.
Structure Shift: We saw a strong impulsive move to the downside, breaking previous higher lows and confirming bearish intent.
Key Resistance Zones: Price is now pulling back toward a key supply zone between 44,100 – 44,300, which aligns with previous support-turned-resistance.
Plan: I’m anticipating a potential lower high formation around this zone, followed by rejection and continuation to the downside.
Target Zone: My short target is the demand area around 42,900 – 42,600 where price last consolidated before the previous rally.
Invalidation: If price reclaims and holds above 44,400, the short idea becomes invalid.

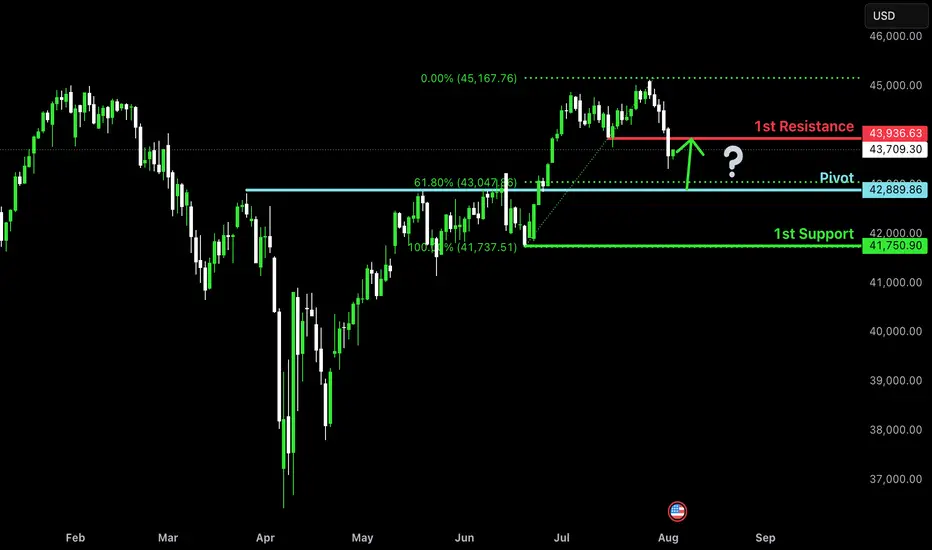
Falling towards pullback support?Dow Jones (US30) is falling towards the pivot and could bounce to the 1st resistance.
Pivot: 42,889.86
1st Support: 41,750.90
1st Resistance: 43,936.63
Risk Warning:
Trading Forex and CFDs carries a high level of risk to your capital and you should only trade with money you can afford to lose. Trading Forex and CFDs may not be suitable for all investors, so please ensure that you fully understand the risks involved and seek independent advice if necessary.
Disclaimer:
The above opinions given constitute general market commentary, and do not constitute the opinion or advice of IC Markets or any form of personal or investment advice.
Any opinions, news, research, analyses, prices, other information, or links to third-party sites contained on this website are provided on an "as-is" basis, are intended only to be informative, is not an advice nor a recommendation, nor research, or a record of our trading prices, or an offer of, or solicitation for a transaction in any financial instrument and thus should not be treated as such. The information provided does not involve any specific investment objectives, financial situation and needs of any specific person who may receive it. Please be aware, that past performance is not a reliable indicator of future performance and/or results. Past Performance or Forward-looking scenarios based upon the reasonable beliefs of the third-party provider are not a guarantee of future performance. Actual results may differ materially from those anticipated in forward-looking or past performance statements. IC Markets makes no representation or warranty and assumes no liability as to the accuracy or completeness of the information provided, nor any loss arising from any investment based on a recommendation, forecast or any information supplied by any third-party.


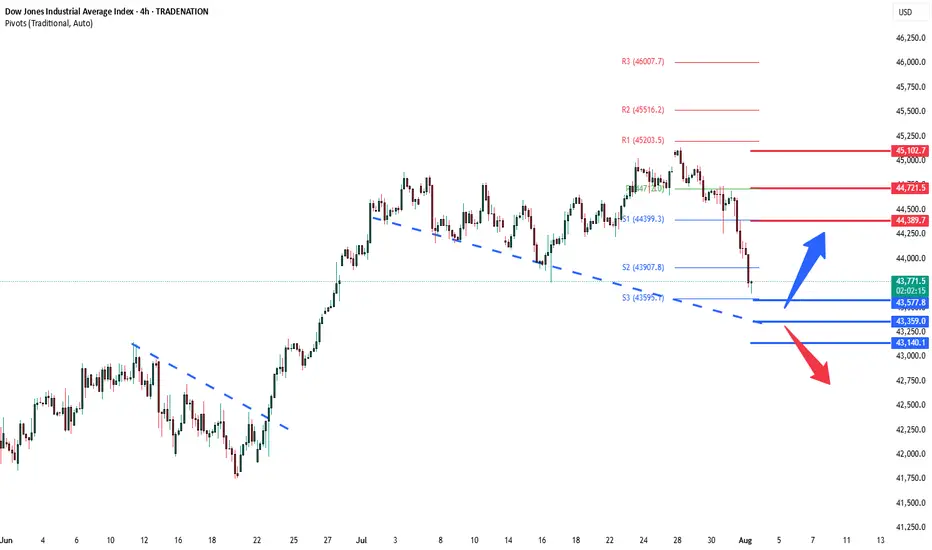
DowJones ahead of US Employment dataKey Support and Resistance Levels
Resistance Level 1: 44390
Resistance Level 2: 44720
Resistance Level 3: 45100
Support Level 1: 43580
Support Level 2: 43360
Support Level 3: 43140
This communication is for informational purposes only and should not be viewed as any form of recommendation as to a particular course of action or as investment advice. It is not intended as an offer or solicitation for the purchase or sale of any financial instrument or as an official confirmation of any transaction. Opinions, estimates and assumptions expressed herein are made as of the date of this communication and are subject to change without notice. This communication has been prepared based upon information, including market prices, data and other information, believed to be reliable; however, Trade Nation does not warrant its completeness or accuracy. All market prices and market data contained in or attached to this communication are indicative and subject to change without notice.
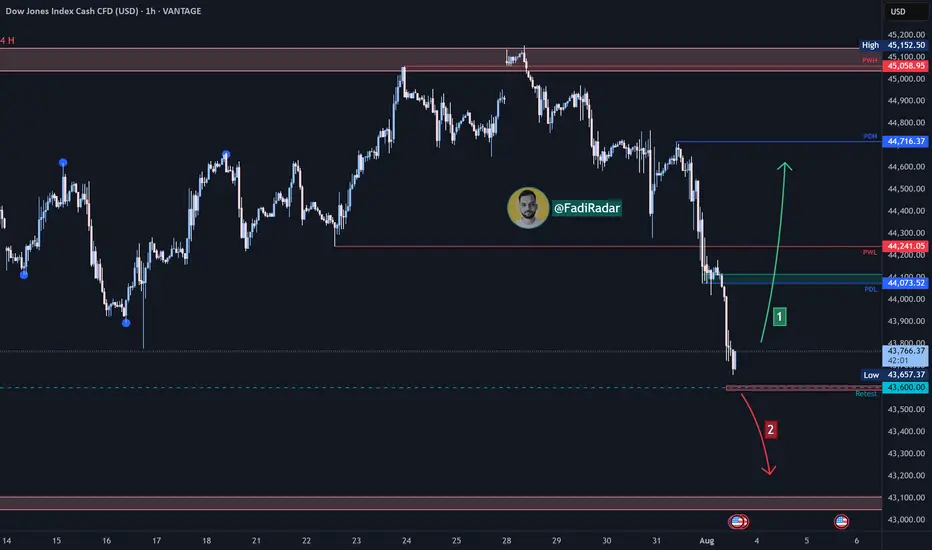
Dow Jones Index Analysis (US30 / Dow Jones):🔹 The Dow Jones index has seen a sharp decline over the past two days, approaching the 43,590 USD support zone.
1️⃣ If the price rebounds from this level and bullish momentum leads to a break and close above 44,100 USD, the index may retest the 44,700 USD area.
2️⃣ However, if the price breaks below 43,600 USD and holds, further downside is likely, with a potential move toward 43,100 USD.
⚠️ Disclaimer:
This analysis is not financial advice. It is recommended to monitor the markets and carefully analyze the data before making any investment decisions.
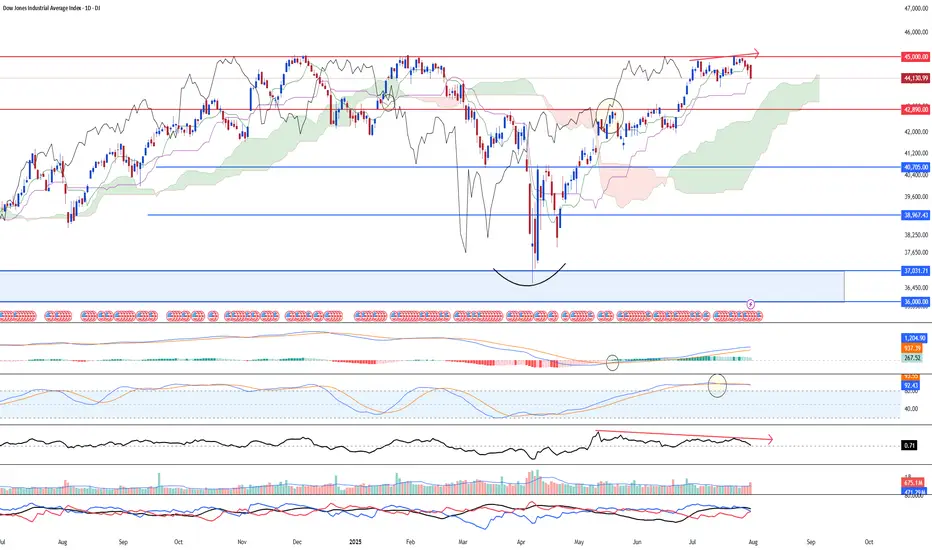
Correction ahead for DJIA, attributed to weak momentumDJ:DJI saw strong potential of a larger degree correction targeting 42,890 or lower support at 41,935. Reason being that there's a bearish divergence between the price chart and 23-period ROC. Furthermore, mid-term stochastic has shown bearish overbought signal. Another worthy price action signal showing weakness is that the index has fail to break above the high at 45,000 psychological level.
Despite the weak outlook, we are looking at a long-term upside targeting 46,200 (6 months and beyond)
DOW?
Hi
Decision timee
If you're buyers
WAIT
If you're sellers
WAIT
This week would give a clearer direction
I will have patience.
I am incline to be bullish
All the best
Not a guru

Dow Jones Industrial Average (DJI) – 1H Chart Analysis 1. Structure: Broad Range Consolidation
Price remains within a wide horizontal range between 45,137 resistance and 43,792 support. This shows indecision and distribution at highs.
2. Key Rejection Zone
The yellow zone around 45,001–45,137 acted as a strong supply area. Multiple rejections indicate heavy selling interest here.
3. Mid-Zone Compression
Current price is hovering just below 44,765 resistance — acting as a decision point. Break above it may retest the supply zone; rejection could send price lower.
4. Demand Holding at 44,280
The strong bounce from 44,280.25 shows buyers defending this demand zone. It's the key support to watch for bulls.
5. Next Play
Bullish: Break and hold above 44,765 targets 45,001–45,137.
Bearish: Failure leads to 44,280, then 43,973 → 43,792.
Neutral bias unless a clean breakout confirms direction.

US30 DOWN FOR WHILEWe have seen dramatic gain in most of the indices and US30 being one of them, and i have been tracking it for so long and i have come with this idea from my approach. As you can see on my screen i have labeled those levels and reset to mark up the the half cycle with the aid of the TDI divergence, the last push there is the level 3 moving exactly with the divergence which indicates that the bulls are getting weak and bears are about take over and push price to the downside, so am looking to join the bears 🐻to price down for a while.

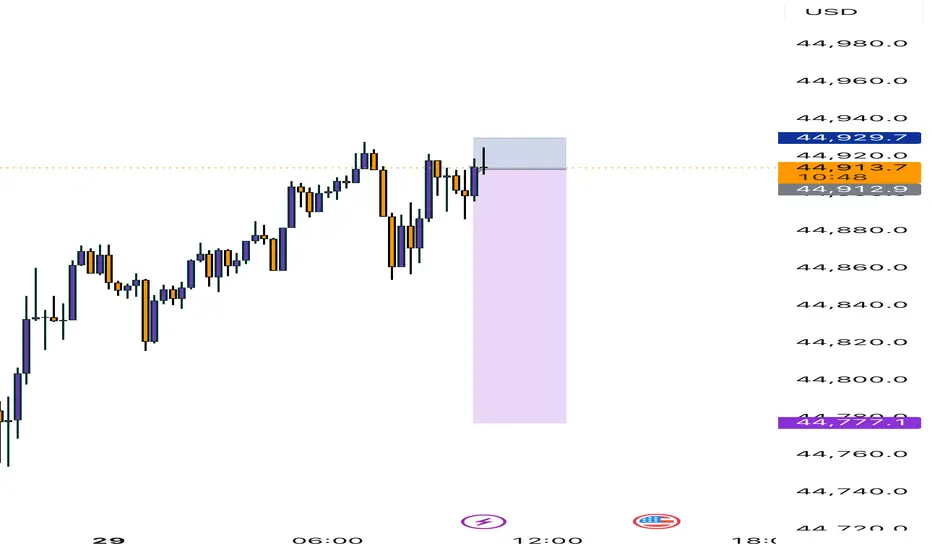
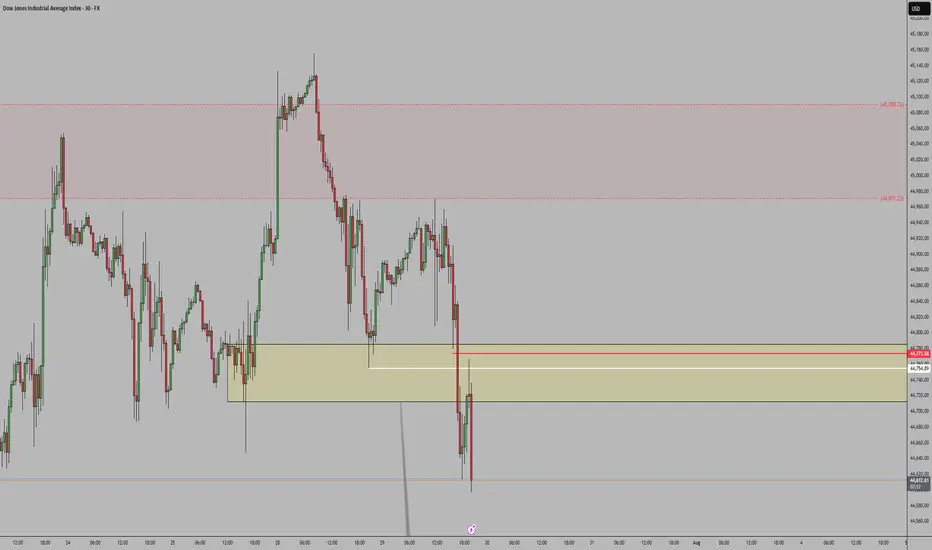
Dow Jones Index (DJI) – July 30, 2025 | 30-Min Chart Analysis
1. Current Market Structure
DJI is consolidating just below the intraday resistance at 44,777. Price is attempting to recover after a sharp drop from the 45,154 high.
2. Supply Zone Rejection
Price faced strong rejection near 45,154 and again at 44,968 — confirming this area as an active seller zone.
3. Support Zone Defense
Buyers stepped in at 44,587 and 44,403, creating a short-term demand base. These levels have provided stability for now.
4. Trend Outlook
The lower high formation and recent sharp sell-off hint at bearish pressure. Price is currently in a retracement — unless 44,968 breaks cleanly, sellers remain in control.
5. Key Levels to Watch
Resistance 44,777 → 44,968 → 45,154
Support 44,587 → 44,403 → 44,239
🔁 Bias: Short-term bearish unless price breaks above 44,968 and holds.

US30The latest COT report shows increased Non-Commercial short positions, indicating bearish sentiment among speculators. Commercial traders are also holding or adding to their short positions, reinforcing the negative outlook. Rising open interest further confirms market expectations of a decline in the US30.
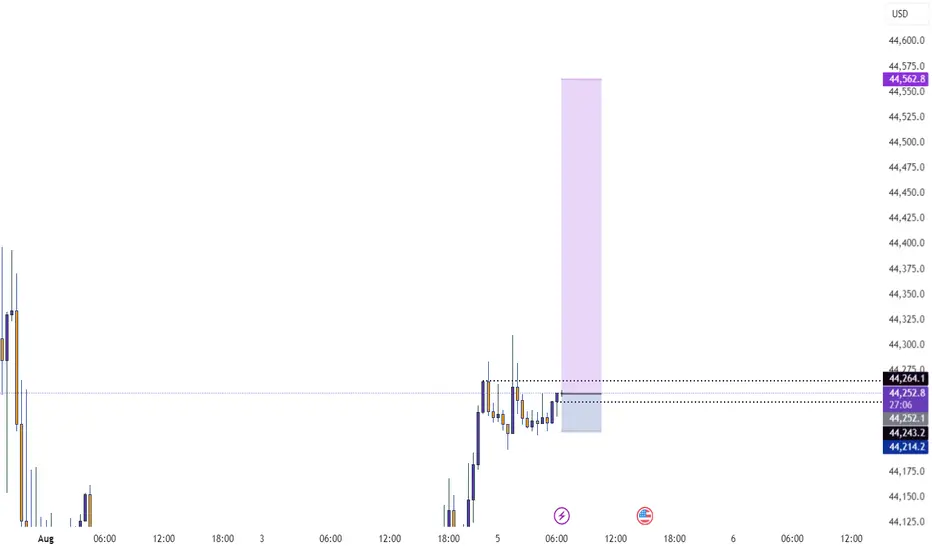
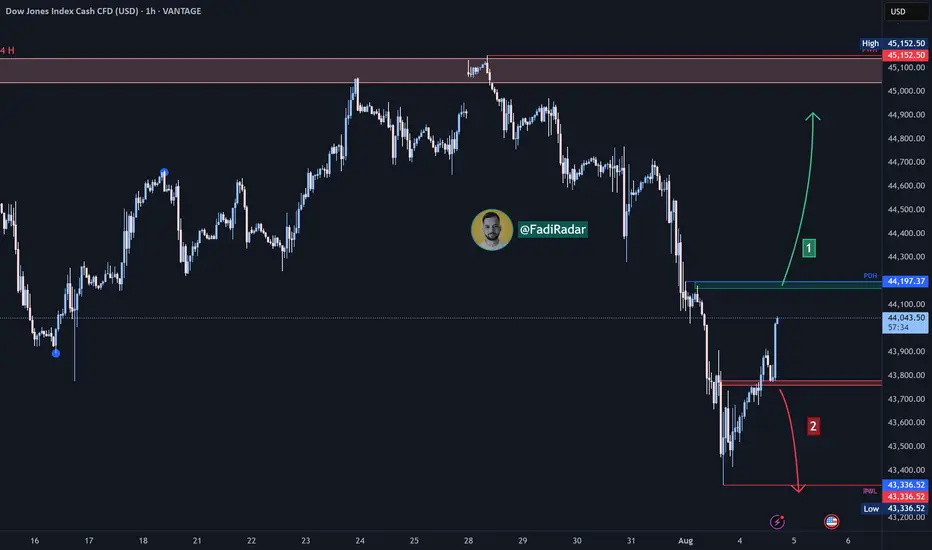
Dow Jones Index Analysis (US30 / Dow Jones):🔹 The index completed the expected correction and successfully retested the PDH level at 44,750 USD.
1️⃣ If bullish momentum leads to a break and close above 44,970 USD, the price is likely to form a new high or retest the previous peak.
2️⃣ However, a break and close below the 44,760 USD support could trigger a decline toward 44,660 USD.
🔻 A confirmed break below that level may resume the bearish trend and open the way toward 44,250 USD.
⚠️ Disclaimer:
This analysis is not financial advice. It is recommended to monitor the markets and carefully analyze the data before making any investment decisions.