Dollar I Daily CLS I Model 1 I KL OB I Target TRCandleYo Market Warriors ⚔️
It's risky, re-entry, but scared money makes no money.
if you’ve been riding with me, you already know:
🎯My system is 100% mechanical. No emotions. No trend lines. No subjective guessing. Just precision, structure, and sniper entries.
🧠 What’s CLS?
It’s the real smart mon
About U.S. Dollar Index
The U.S. Dollar Index tracks the strength of the dollar against a basket of major currencies. DXY was originally developed by the U.S. Federal Reserve in 1973 to provide an external bilateral trade-weighted average value of the U.S. dollar against global currencies. U.S. Dollar Index goes up when the U.S. dollar gains "strength" (value), compared to other currencies. The following six currencies are used to calculate the index:
Euro (EUR) 57.6% weight
Japanese yen (JPY) 13.6% weight
Pound sterling (GBP) 11.9% weight
Canadian dollar (CAD) 9.1% weight
Swedish krona (SEK) 4.2% weight
Swiss franc (CHF) 3.6% weight
Euro (EUR) 57.6% weight
Japanese yen (JPY) 13.6% weight
Pound sterling (GBP) 11.9% weight
Canadian dollar (CAD) 9.1% weight
Swedish krona (SEK) 4.2% weight
Swiss franc (CHF) 3.6% weight
Related indices

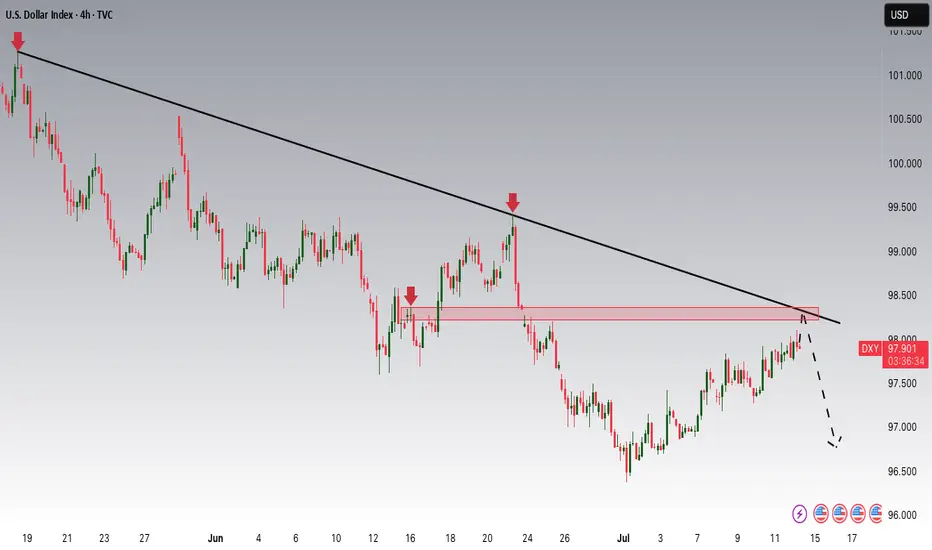
DXY Potential DownsidesHey Traders, in today's trading session we are monitoring DXY for a selling opportunity around 98.300 zone, DXY is trading in a downtrend and currently is in a correction phase in which it is approaching the trend at 98.300 support and resistance area.
Trade safe, Joe.
Dollar I Daily CLS I KL - OB I Model 1Yo Market Warriors ⚔️
Fresh outlook drop — if you’ve been riding with me, you already know:
🎯My system is 100% mechanical. No emotions. No trend lines. No subjective guessing. Just precision, structure, and sniper entries.
🧠 What’s CLS?
It’s the real smart money. The invisible hand behind $7T/d

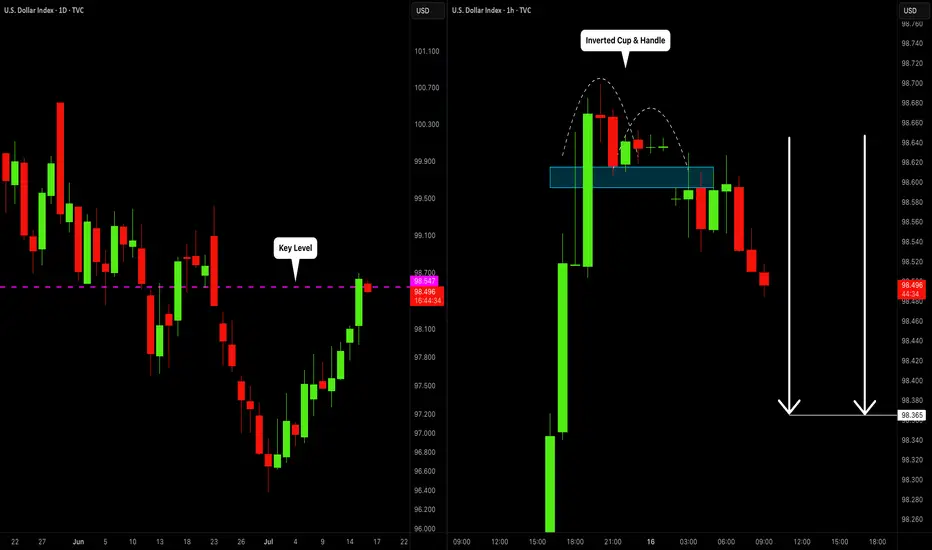
DOLLAR INDEX (DXY): Bearish Move From Key Level
I think that Dollar Index may drop from a key daily horizontal resistance level.
As a confirmation, I spotted an inverted cup & handle pattern on an hourly time frame
and a bearish violation of its neckline.
The market will most likely continue falling at least to 98.36
❤️Please, support my w
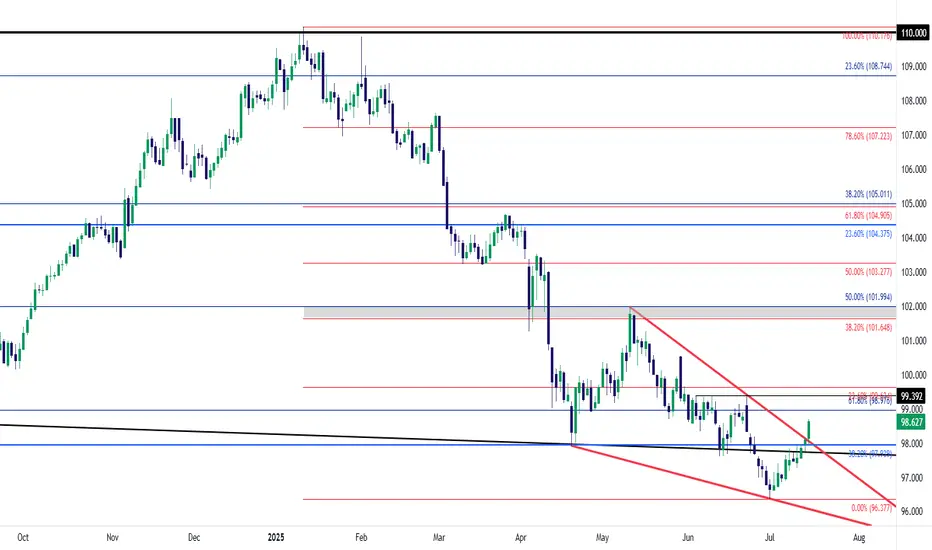
USD Falling Wedge Breakout - Bulls Continue to Turn the TideThe USD showed oversold conditions via RSI on both the daily and weekly chart as we began Q3. But, so far, the new quarter has shown a change-of-pace, as the currency has continued to rally with another topside breakout today around CPI data.
The breakout today happened at a big spot - as the long
DOLLAR PUSHING HIGHERPrevious week high has taken by a bullish move. Market printed a nice 4H imbalance which shows the potential of the market to go further higher.

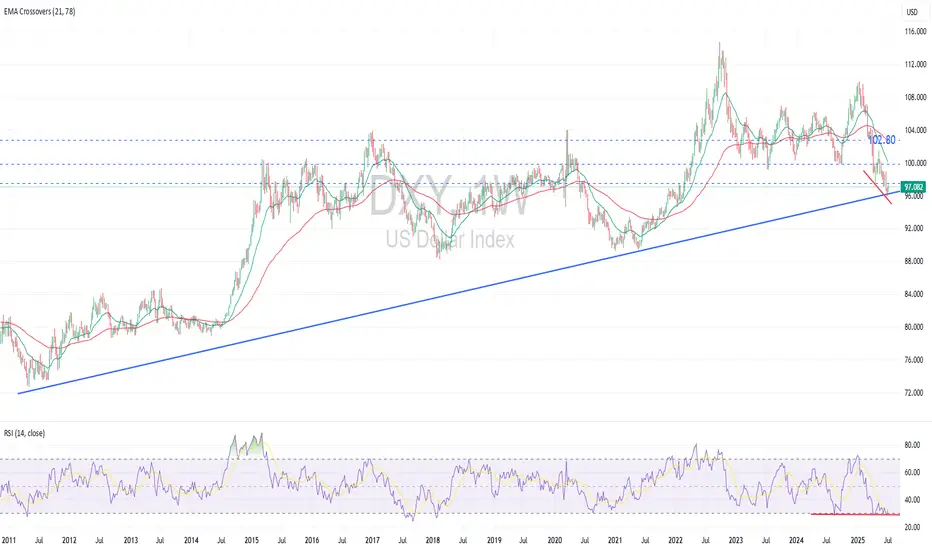
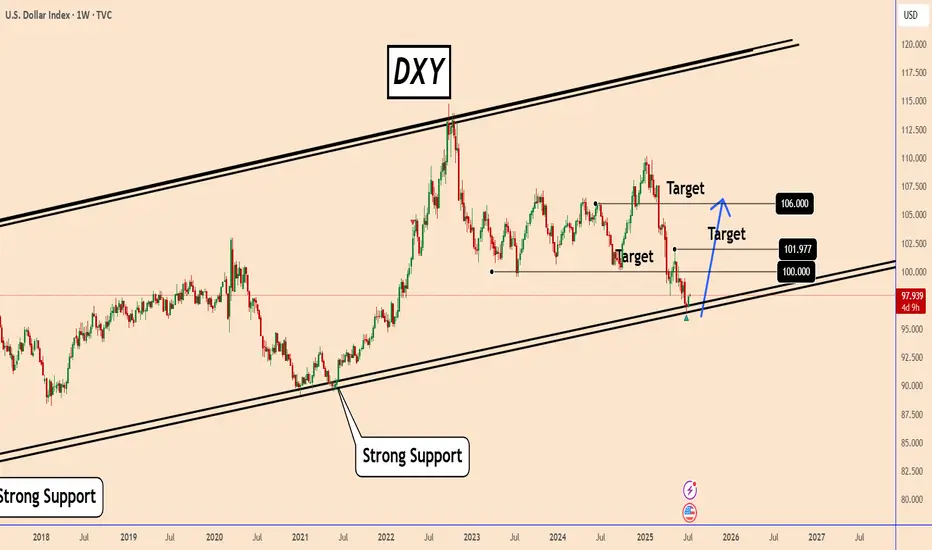
DXY may rebound significantly soonDXY Likely to Rebound Significantly Soon
Technical Perspective:
DXY recently broke below its previous low, forming a lower low, with both EMAs signaling a downtrend. However, the price has now reached a 14-year-old long-term ascending trendline support , which reflects the strength and effe
Weekly DXY OutlookWeekly DXY Outlook - Updated
DXY is still bullish and is rising slowly
On the weekly chart, the US Dollar Index (DXY) has reached a critical zone that was last tested in February 2022.
While a rebound is not guaranteed, the fact that the DXY has declined nearly 12% over just six months—despite a
A Closer Look at the Role and Recent Volatility of the (DXY)A Closer Look at the Role and Recent Volatility of the US Dollar Index (DXY)
We don’t even need to say that the US Dollar Index (DXY) is one of the most influential benchmarks in global currency markets. The index, which measures the value of the US dollar against a basket of six major currencies,
DXY (USD Basket) - 3 Month - Short Squeeze In Play?Technicals:
The last 3-month candle closed above the major resistance that tends to hold according to historic levels going back to the year 1967.
Golden Cross is almost complete (50 MA crossing the 200 MA).
Fundamentals:
The dollar has only been more shorted once in history (2018), setting t

See all ideas
Summarizing what the indicators are suggesting.
Oscillators
Neutral
SellBuy
Strong sellStrong buy
Strong sellSellNeutralBuyStrong buy
Oscillators
Neutral
SellBuy
Strong sellStrong buy
Strong sellSellNeutralBuyStrong buy
Summary
Neutral
SellBuy
Strong sellStrong buy
Strong sellSellNeutralBuyStrong buy
Summary
Neutral
SellBuy
Strong sellStrong buy
Strong sellSellNeutralBuyStrong buy
Summary
Neutral
SellBuy
Strong sellStrong buy
Strong sellSellNeutralBuyStrong buy
Moving Averages
Neutral
SellBuy
Strong sellStrong buy
Strong sellSellNeutralBuyStrong buy
Moving Averages
Neutral
SellBuy
Strong sellStrong buy
Strong sellSellNeutralBuyStrong buy
Displays a symbol's price movements over previous years to identify recurring trends.
Frequently Asked Questions
The current value of U.S. Dollar Index is 98.688 USD — it has risen by 0.51% in the past 24 hours. Track the index more closely on the U.S. Dollar Index chart.
U.S. Dollar Index reached its highest quote on Feb 25, 1985 — 164.720 USD. See more data on the U.S. Dollar Index chart.
The lowest ever quote of U.S. Dollar Index is 70.698 USD. It was reached on Mar 17, 2008. See more data on the U.S. Dollar Index chart.
U.S. Dollar Index value has increased by 1.37% in the past week, since last month it has shown a 0.60% increase, and over the year it's decreased by −5.31%. Keep track of all changes on the U.S. Dollar Index chart.
U.S. Dollar Index is just a number that lets you track performance of the instruments comprising the index, so you can't invest in it directly. But you can buy U.S. Dollar Index futures or funds or invest in its components.