US DOLLAR: Sell opportunity following channel breakPrice on DXY recently broke above a sharp descending channel, but the move lacked presence. There was no real follow-through and certainly no conviction behind the candles. It felt hesitant, as this is a great indication for us to use.
Instead of accelerating upward, price now hovers just above the breakout, this kind of behavior suggests rather a random push than a shift in sentiment. Without the strength to sustain above structure, I think we will see the price come back to the channel's lower border.
And when breakouts fail, they often trap early longs, preparing for a more committed move in the opposite direction.
A rejection from this level could send price into the 0.85800 level.
DXY trade ideas

DXY Bullish Reversal Setup Toward 98.20 Target Entry Point
Marked at: ~97.200
The price has already reacted multiple times around this level, suggesting it's a key support zone.
🛑 Stop Loss
Placed at: ~96.930
Just below the support zone, protecting against a breakdown below recent lows.
This implies a risk of about 27 pips from the entry.
🎯 Target Point (TP)
Marked at: ~98.201
Strong resistance zone from previous price action.
Target implies a potential reward of 100+ pips, offering a risk-reward ratio (RRR) of ~3.7:1, which is favorable.
📊 Resistance Area
Around 97.419–97.465
This is the first obstacle the price must break through to confirm bullish continuation.
The 200 EMA (blue curve) is currently acting as dynamic resistance, aligning near this zone.
📉 Indicators
Moving Averages:
Red: Likely 50 EMA
Blue: Likely 200 EMA
Price is currently below both EMAs — so trend is still bearish, but trying to shift.
📌 Strategy Insight
The setup anticipates a bullish reversal from 97.200, aiming for a breakout above the 200 EMA and resistance to reach the 98.201 zone.
For confirmation, watch for a strong bullish candle close above 97.465, which would validate upside continuation.
⚠️ Risks
Price is still under both moving averages → downward momentum may persist.
If support at 97.00 breaks, downside acceleration could occur.
✅ Conclusion:
This is a bullish breakout setup on DXY with:
Defined entry and stop-loss.
Clear target.
High RRR.
But it’s crucial to wait for confirmation above resistance (97.465) before full conviction on the long trade.

Dollar I Daily CLS I Model 1 I Time for pullbackHey, Market Warriors, here is another outlook on this instrument
If you’ve been following me, you already know every setup you see is built around a CLS Footprint, a Key Level, Liquidity and a specific execution model.
If you haven't followed me yet, start now.
My trading system is completely mechanical — designed to remove emotions, opinions, and impulsive decisions. No messy diagonal lines. No random drawings. Just clarity, structure, and execution.
🧩 What is CLS?
CLS is real smart money — the combined power of major investment banks and central banks moving over 6.5 trillion dollars a day. Understanding their operations is key to markets.
✅ Understanding the behavior of CLS allows you to position yourself with the giants during the market manipulations — leading to buying lows and selling highs - cleaner entries, clearer exits, and consistent profits.
📍 Model 1
is right after the manipulation of the CLS candle when CIOD occurs, and we are targeting 50% of the CLS range. H4 CLS ranges supported by HTF go straight to the opposing range.
"Adapt what is useful, reject what is useless, and add what is specifically your own."
— David Perk aka Dave FX Hunter ⚔️
👍 Hit like if you find this analysis helpful, and don't hesitate to comment with your opinions, charts or any questions.

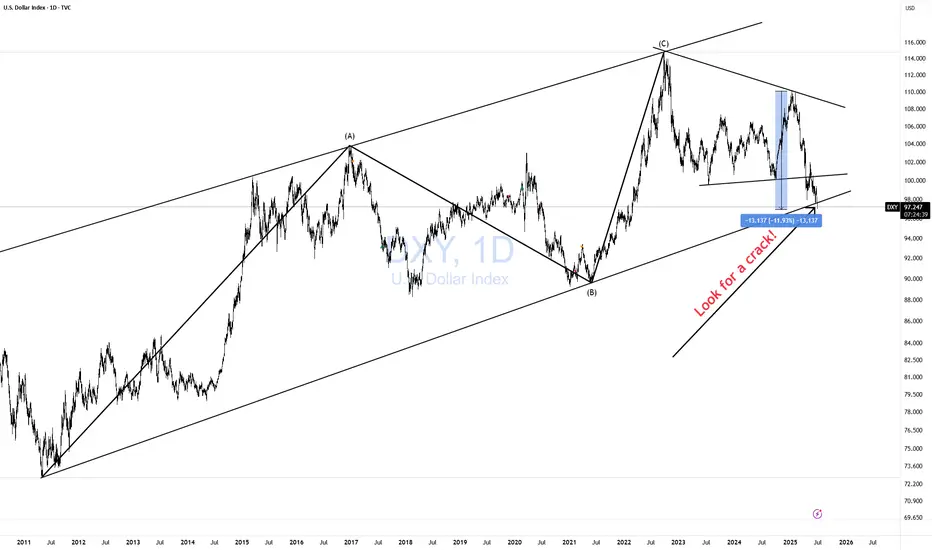
DXY CRACK! BAD JUJU!After Trump unilaterally imposed Tariffs (Taxes) on its citizens to buy imported goods from the rest of the world, promising 90 deals in 90 days, "in two weeks", the demand for the dollar payment system has collapsed by -12% reducing purchasing power for all $ holders'.
Imports of goods mean exporting $s to the rest of the world. As a world reserve currency (WRC), the US gets the benefit of seeing those $s invested back into the US. That creates demand for the $ payment system, and raises $ holders' purchasing power, reducing inflation.
What else happens? A bit complicated but I will try to explain. High demand for $ means the US indirectly exports inflation. Meaning, more $ for the same amount of goods and services. However, as a WRC, the US is not really exporting inflation. That is a bit inaccurate bc the US payment system as a WRC is actually includes a lot more goods and services from the entire planet. This makes sense if you think about it. However only going one way, meaning as long as the demand from the world for our payment system, more $ required by the world reflect more goods and services. As such not inflationary.
Now let's reverse it so you can see why it is not entirely accurate. Should the Global Economy (which is worth today about $100 trillion,) demand ever drop off. The $ value will collapse as people sell their $ holdings in exchange for other currencies. What you are seeing right now in this chart with a CRACK in it.
The US GDP is currently about $30 trillion. There is no way! A $ payment system designed for a $100T economy can suddenly absorb all those $ in a $30T economy. Inflation would skyrocket as more and more $ chase the same amount of goods and services ($30T). This is not rocket science. This is basic 3rd-grade arithmetic!
This CRACK! could be very bad JUJU!
CAUTION is in order. Don't let normality bias fool you. No matter how you feel about Trump. It is irrelevant to basic arithmetic.
DXY: Weekly OutlookWeekly DXY Outlook
On the weekly chart, the US Dollar Index (DXY) has reached a critical zone that was last tested in February 2022.
While a rebound is not guaranteed, the fact that the DXY has declined nearly 12% over just six months—despite a resilient U.S. economy—suggests the potential for renewed strength in the dollar.
I think the index could begin a recovery toward key levels at 100.00, 101.97, and possibly 106.00/
It’s worth noting that the broader bearish trend began with the trade tensions initiated during the Trump administration, which strained relations with several major trading partners.
Given that this is a weekly chart, it should be used more as a reference point rather than a trading signal.
You may find more details in the chart!
Thank you and Good Luck!

DXY 1D – Tipping Point: News or Price Action?Hey Guys,
The DXY index is currently moving within a downtrend. This trend is unlikely to reverse unless it breaks above the 98.950 level.
Sure, key fundamental data could shift the trend, but without those news catalysts, a reversal at this point doesn’t seem realistic.
Don’t forget—98.950 is a critical threshold for the DXY.
I meticulously prepare these analyses for you, and I sincerely appreciate your support through likes. Every like from you is my biggest motivation to continue sharing my analyses.
I’m truly grateful for each of you—love to all my followers💙💙💙

DXY I AM MOVING TO 100 % LONG DXY WAVE 4 lowThe chart posted is my view of the DXY I am as bullish now as I was at 71 .Best of TRADES WAVETIMER 96.70 to 97.6

DXY Technicals Add Pressure on FED Data〽️Weekly RSI Divergence Spotted in the US Dollar Index (DXY)
A bearish divergence has emerged on the weekly RSI chart of the US Dollar Index (DXY), signaling a potential loss of upward momentum. Historically, such divergences often precede price corrections or reversals.
✅Market Implications:
USD pairs, gold, and crypto assets may see retracement as dollar strength wanes in response to technical exhaustion.
Traders should watch for signs of consolidation or reversal in assets inversely correlated with the dollar, such as gold (XAU/USD) and Bitcoin (BTC/USD).
📈Macro Outlook:
All eyes on the Federal Reserve: The divergence adds weight to market speculation that the Fed might pivot toward a rate cut at its July 15 meeting.
If confirmed, rate cuts could further pressure the dollar, accelerating moves in risk-on assets and emerging market currencies.
#XAUUSD
#DXY
#BTCUSD
#tgifx

DOLLAR INDEX (DXY): Bearish Move After BreakoutThe Dollar Index has surpassed and closed below a key daily/intraday support level.
After retesting this level, the price rebounded and breached a resistance line of a rising wedge pattern, suggesting a strong likelihood of a continued bearish trend.
It is highly probable that the price will soon reach the 96.43 level.

There is a possible down push on xauusdIf the trend can break through the resistance there's possibly a little long down push on xauusd

I would be looking for reversal patterns on the ES and the Russe7 1 25 I made a few mistakes naming some of the markets but if you can deal with that then I explain what my concerns are regarding some of the patterns. most of the trades that I posted as trading opportunities have moved higher and did not require large stops. I spent time on a certain pattern that I don't really talk about but it influenced my Trading and gives me caution not to stay in a market to Long.... and I tried to use the the gold and the silver because I really am tied into those markets and I'm concerned about a pattern on the gold that is actually giving a signal to be long but I'm still concerned about it and I tried to articulate that in the video.... it's about the concept of what that pattern represents to me..... and incorrect or the market trades differently it's not a big deal..... the irony in the video is that I tried to show that pattern thinking that I was in a certain Market and I had the wrong Market..... the only thing I would say is there's a certain pattern and they think Gold's a very good example and will give me a chance to talk about it in a couple of days and I want to see if it actually can make a new high which I am concerned about because I want that new high to sell some of my goal but I want a good price and it's a large amount.... and I'm not doing this to be egotistical or trying to prove a point.... I'm willing to show something that's actually going on and I'm willing to talk about it. a number of people are entering in my trades which is perfectly fine and they try to make statements in my videos that require that you go back and reevaluate those videos to see what happened and that's the best way to learn. I stopped looking at other people's charting mostly because I'm happy with what I do but also when people chart something and project a Target but never do anything else to help you determine if that projection was correct that's not of any value. if you can find somebody who finds an entry and tells you what it is or that it's about to happen and that person does a video on it which he cannot change so that even though you don't see the actual trade the market trades in the direction and has reversals that are outlined before they happen that's the best way to trade it completes the cycle of trading.... and the beautiful thing is if you post it you can't erase it.... that's how you can learn effectively if you go back and create the patterns that were shown to you previously.

DOLLAR INDEX (DXY): Critical Moment
With an unprecedented pace of weakness of US Dollar,
DXY Index is now testing a historic weekly support cluster.
If the market breaks it today and closes below that, it will
open a potential for much more depreciation.
Next historic support will be 95.5 and a downtrend will continue.
Today's US fundamentals can be a trigger.
Please, support my work with like, thank you!

DXY TURNS BULLISH, SELL EURUSD, GBPUSDDxy is now bullish, I said it last week and I'm saying it again. Nothing has changed, this means we sell EURUSD, GBPUSD etc.
I publish DXY chart because it shows what im expecting in other dollar pairs without having to publish them.
Follow me as my trades are market order, so you will see it on time and enter on time


US Missiles Flyin'! Buy USD vs EUR GBP AUD NZD CAD CHF JPY!This is the FOREX futures outlook for the week of Jun 22-28th.
In this video, we will analyze the following FX markets:
USD Index, EUR, GBP, AUD, NZD, CAD, CHF, and JPY.
The USD is the world's reserve currency. When there are geo-political hot spots in the world, the USD sees inflows from investors. In light of US strikes against Iranians nuke sites last night, buying the USD versus other currencies is prudent and wise.
The USD should see more gains as long as the current tensions are high. If Iran comes back to the negotiations table, then the environment switches back to a risk on scenario, where the outflows from the USD go back into riskier assets like the stock market.
Enjoy!
May profits be upon you.
Leave any questions or comments in the comment section.
I appreciate any feedback from my viewers!
Like and/or subscribe if you want more accurate analysis.
Thank you so much!
Disclaimer:
I do not provide personal investment advice and I am not a qualified licensed investment advisor.
All information found here, including any ideas, opinions, views, predictions, forecasts, commentaries, suggestions, expressed or implied herein, are for informational, entertainment or educational purposes only and should not be construed as personal investment advice. While the information provided is believed to be accurate, it may include errors or inaccuracies.
I will not and cannot be held liable for any actions you take as a result of anything you read here.
Conduct your own due diligence, or consult a licensed financial advisor or broker before making any and all investment decisions. Any investments, trades, speculations, or decisions made on the basis of any information found on this channel, expressed or implied herein, are committed at your own risk, financial or otherwise.

Dollar Bullish Correction To $103 - $105While we expected to see some Dollar upside in Q2, the economy was in such a bad state that the Dollar could not hold its value. Since the start of 2025 the Dollar is down 12% and this is only the beginning.
I believe we will see more downside in the future. But for the coming quarter there is a chance for the Dollar to get some breathing space & recover in the short term. Overall, the trend of the Dollar remains bearish, so what we want to keep an eye on is small pumps (short term recovery) into price zones which will allow us to short the Dollar back down.
I want to see a dip lower towards $96 - $94 before sellers lose bearish momentum. If this move takes place, then we can slowly see buyers step back into the market & start pushing back to the upside. Once price hits our ‘Supply Zone’ of $103 again, it’ll give us a more clear indication of what the Dollar will do next; whether that’s a longer term uptrend or a continuation to the downside.

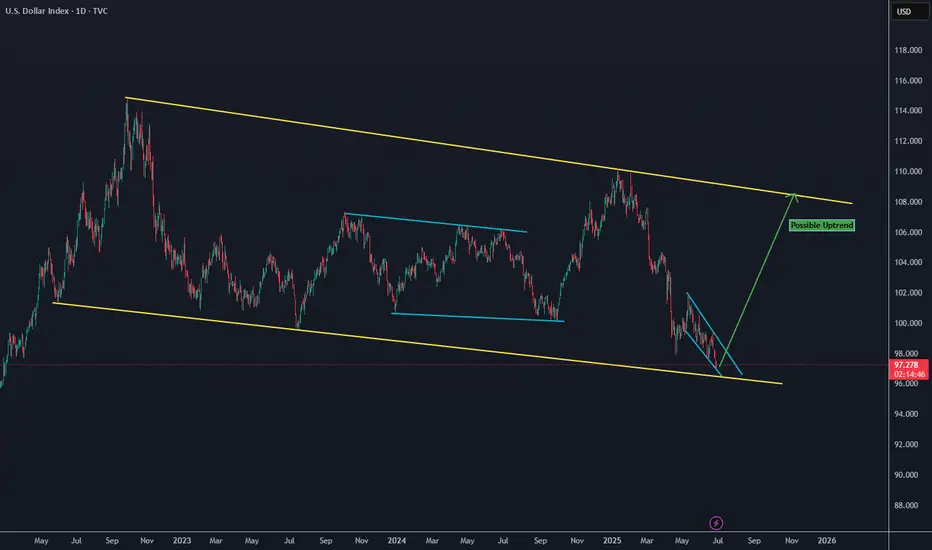
USD Roadmap: Bullish Recovery or Structural Breakdown?TVC:DXY CAPITALCOM:DXY
🟢 Scenario A – Bullish Rebound (Red Arrow Up):
Price bounces from the lower channel and breaks toward:
107.348, 110.176, or even 111.901 resistance area.
If the dollar is supported by China buying USD, hawkish Fed, or geopolitical tensions, this scenario gains weight.
🔸 Resistance: Blue downward-sloping line (possible trendline resistance or lower high area)
🔸 Risk: Price could form a lower high and then reverse.
🔴 Scenario B – Bearish Breakdown (Red Arrow Down):
If the USD fails to break above resistance (around 107–112) and gets rejected…
Then we see a move back down, possibly breaking the long-term channel, aiming for the lower diagonal support zone or even sub-92.
🔸 This would signal a major shift in USD strength, possibly driven by:
Fed rate cuts
Global de-dollarization
China not supporting USD
Stronger EUR or CNY


DXY ANNALSIS OUTLOOK BULLISH POSIBLE MOVEWS 28/6/2025strong buy 97.000
buy 96.800
going on bullish moves
buyers and sellers
ready to new months new week's
buy 97.000
take profit 97.400
take profit 97.800
take profit 98.500
stop los 96.600

US DOLLAR INDEX BOTTOMING?DXY looking for bottom and reversal around 97.
possible target : 108+
stop trade below 96.
good luck.
DXY IS BULLISHA possible upward move might take place . Looking forward to go long until resistance area . I will wait and see how it goes .
Happy Trading

$DXY Looks like a long.If the TVC:DXY can hold this trend line, it would suggest a bounce back up to the resistance.
makes sense if the yields end up higher at some point.
Will see
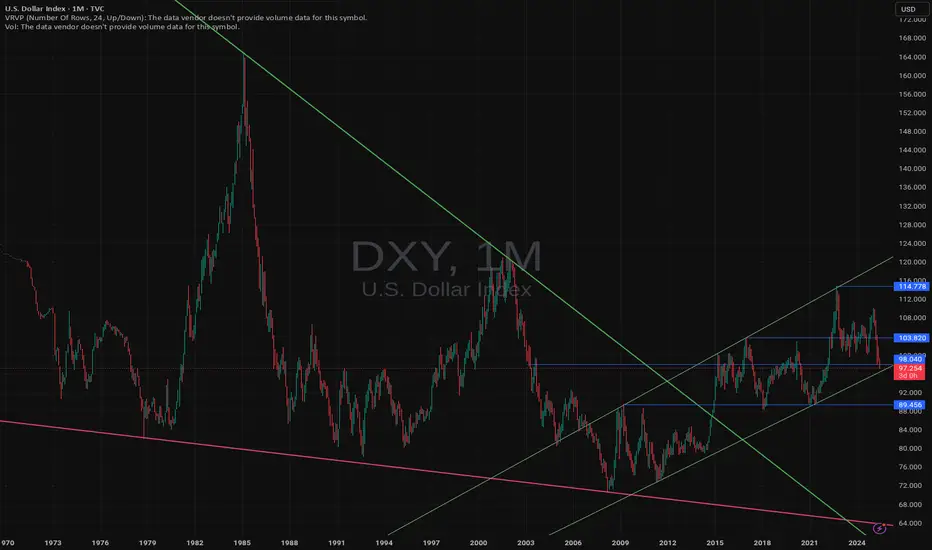
dollar elliott wave countingdxy is falling since it peaked in Q4 2022
since their last 75bps hike dollar is constantly falling and stocks, gold, bitcoin constantly rising and making new all time high
wave W = wave Y
(equal in length, 100% projection for wave Y)
since starting of the year due to trump tariff dollar is falling
this is year in first half dollar saw biggest collapse since end of gold standard
now 100% projection target for wave Y at 95 area is big static support level
if dxy recover back to 100 area then this will be first sign of reversal
