DXY AMD ANALYSIS AMD concepts per ict
CISD on the monthly level
Weekly imbalance respected
Displacement
DXY trade ideas

DXY Trading JournalDXY Trading Journal
April 20 Analysis
Monday created the weeks low which was then taken on Wednesday.
Price created the high on Tuesday.
Thursday Price in a deep discount from previous day and taking sell side liquidity. Price takes minor buy side and rebalances previous days inefficient delivered price, price closes in a consolidation in a discount.
*Last weeks highlight Price took key lows from July 2023 and rebalanced a BISI from April 2022.
April 20 week ahead
Bias is bear
I would not be surprised if price stays in a tight trading range this week. Price is in a deep discount. I could see Price seek higher prices in the beginning of the week. My longer term idea is for Price to take the noted key equal lows and rebalance 4 hour FVG before I suspect for the DXY will seasonal shift to seeking higher prices.

DXY / Dollar Index Market Heist Plan (Scalping/Day)🌟Hi! Hola! Ola! Bonjour! Hallo! Marhaba!🌟
Dear Money Makers & Robbers, 🤑 💰💸✈️
Based on 🔥Thief Trading style technical and fundamental analysis🔥, here is our master plan to heist the DXY / Dollar Index Market. Please adhere to the strategy I've outlined in the chart, which emphasizes long entry. Our aim is the high-risk ATR Zone. Risky level, overbought market, consolidation, trend reversal, trap at the level where traders and bearish robbers are stronger. 🏆💸"Take profit and treat yourself, traders. You deserve it!💪🏆🎉
Entry 📈 : "The heist is on! Wait for the MA breakout (103.300) then make your move - Bullish profits await!"
however I advise to Place Buy stop orders above the Moving average (or) Place buy limit orders within a 15 or 30 minute timeframe most recent or swing, low or high level.
📌I strongly advise you to set an "alert (Alarm)" on your chart so you can see when the breakout entry occurs.
Stop Loss 🛑: "🔊 Yo, listen up! 🗣️ If you're lookin' to get in on a buy stop order, don't even think about settin' that stop loss till after the breakout 🚀. You feel me? Now, if you're smart, you'll place that stop loss where I told you to 📍, but if you're a rebel, you can put it wherever you like 🤪 - just don't say I didn't warn you ⚠️. You're playin' with fire 🔥, and it's your risk, not mine 👊."
📍 Thief SL placed at the recent/swing low level Using the 1H timeframe (101.700) Day / Scalping trade basis.
📍 SL is based on your risk of the trade, lot size and how many multiple orders you have to take.
🏴☠️Target 🎯: 105.000 (or) Escape Before the Target
💰💸💵DXY / Dollar Index Market Heist Plan (Scalping / Day Trade) is currently experiencing a bullishness,., driven by several key factors.👇👇👇
📰🗞️Get & Read the Fundamental, Macro, COT Report, Quantitative Analysis, Sentimental Outlook, Intermarket Analysis, Future trend targets..., go ahead to check 👉👉👉🔗
⚠️Trading Alert : News Releases and Position Management 📰 🗞️ 🚫🚏
As a reminder, news releases can have a significant impact on market prices and volatility. To minimize potential losses and protect your running positions,
we recommend the following:
Avoid taking new trades during news releases
Use trailing stop-loss orders to protect your running positions and lock in profits
💖Supporting our robbery plan 💥Hit the Boost Button💥 will enable us to effortlessly make and steal money 💰💵. Boost the strength of our robbery team. Every day in this market make money with ease by using the Thief Trading Style.🏆💪🤝❤️🎉🚀
I'll see you soon with another heist plan, so stay tuned 🤑🐱👤🤗🤩

DXY / Dollar Index Market Heist Plan (Scalping / Day Trade)🌟Hi! Hola! Ola! Bonjour! Hallo! Marhaba!🌟
Dear Money Makers & Robbers, 🤑 💰💸✈️
Based on 🔥Thief Trading style technical and fundamental analysis🔥, here is our master plan to heist the DXY / Dollar Index Market. Please adhere to the strategy I've outlined in the chart, which emphasizes long entry. Our aim is the high-risk Red Zone. Risky level, overbought market, consolidation, trend reversal, trap at the level where traders and bearish robbers are stronger. 🏆💸"Take profit and treat yourself, traders. You deserve it!💪🏆🎉
Entry 📈 : "The heist is on! Wait for the MA breakout (104.550) then make your move - Bullish profits await!"
however I advise to Place Buy stop orders above the Moving average (or) Place buy limit orders within a 15 or 30 minute timeframe most recent or swing, low or high level.
📌I strongly advise you to set an alert on your chart so you can see when the breakout entry occurs.
Stop Loss 🛑:
Thief SL placed at the recent/swing low level Using the 1H timeframe (103.800) Day trade basis.
SL is based on your risk of the trade, lot size and how many multiple orders you have to take.
🏴☠️Target 🎯: 105.400 (or) Escape Before the Target
🧲Scalpers, take note 👀 : only scalp on the Long side. If you have a lot of money, you can go straight away; if not, you can join swing traders and carry out the robbery plan. Use trailing SL to safeguard your money 💰.
DXY / Dollar Index Market Heist Plan (Scalping / Day Trade) is currently experiencing a bullishness,., driven by several key factors.
📰🗞️Get & Read the Fundamental, Macro, COT Report, Quantitative Analysis, Sentimental Outlook, Intermarket Analysis, Index-Specific Analysis, Positioning and future trend targets.. go ahead to check 👉👉👉
⚠️Trading Alert : News Releases and Position Management 📰 🗞️ 🚫🚏
As a reminder, news releases can have a significant impact on market prices and volatility. To minimize potential losses and protect your running positions,
we recommend the following:
Avoid taking new trades during news releases
Use trailing stop-loss orders to protect your running positions and lock in profits
💖Supporting our robbery plan 💥Hit the Boost Button💥 will enable us to effortlessly make and steal money 💰💵. Boost the strength of our robbery team. Every day in this market make money with ease by using the Thief Trading Style.🏆💪🤝❤️🎉🚀
I'll see you soon with another heist plan, so stay tuned 🤑🐱👤🤗🤩

DXYDollar needs more correction before downside.
Disclosure: We are part of Trade Nation's Influencer program and receive a monthly fee for using their TradingView charts in our analysis.

NEW WORLD ORDER BLUEPRINT : THE GRAND DESIGN I have said everything in prior posts
but this analysis dates to ray dalios hegemony video
looks like this is the time
so dxy will rebound in value good news will spur the economic tank willthen crash trump vs powell you cant rig the economy couple this with the bad after taste of tariffs negative sentiment from the world no one coming to sretch their hand out then boom
ni hao wo jiao Lao Ban Muji, wo ai bin qili
ai, shuo, follow
zaijian

USDX in danger ! Usdx or Dxy or Us dollars index in dangrous position .. it needs to reverse soon.
Im not sure what is the impact of further decline but seriously it will be harmfull . !
I forcast the positive vision .. otherwise ....!!!!!!
DXY Analysis - MORE DOWNSIDEHere is my analysis on the DXY (US Dollar Index).
Basically, I'm expecting lower prices. Now i'm just waiting for more information on the daily and sub-daily chart to guide me in the right direction.
- R2F Trading

Dollar Index - Further Capitulation On the Horizon?It's like a gaping wound that refuses to heal, spewing blood everywhere!
Dollar index has been falling like a ton of bricks from the beginning of this year with little to no signs of retracing back into equilibrium and the question to ask yourself is.... will the 90-day ban restore dollar index above the 100 mark?
Or will be continue to see risk on scenarios?

DXY update.
WEEKLY TREND IS SUPER BEARISH.
1D swing , and 1D fractals both structures are bearish.
in 2h tf -> price gave 1st fakeout then took out liquidity, and later it gave
fractals shift .
So to conclude:
I'm BULLISH in XXX / USD pairs and vice versa.
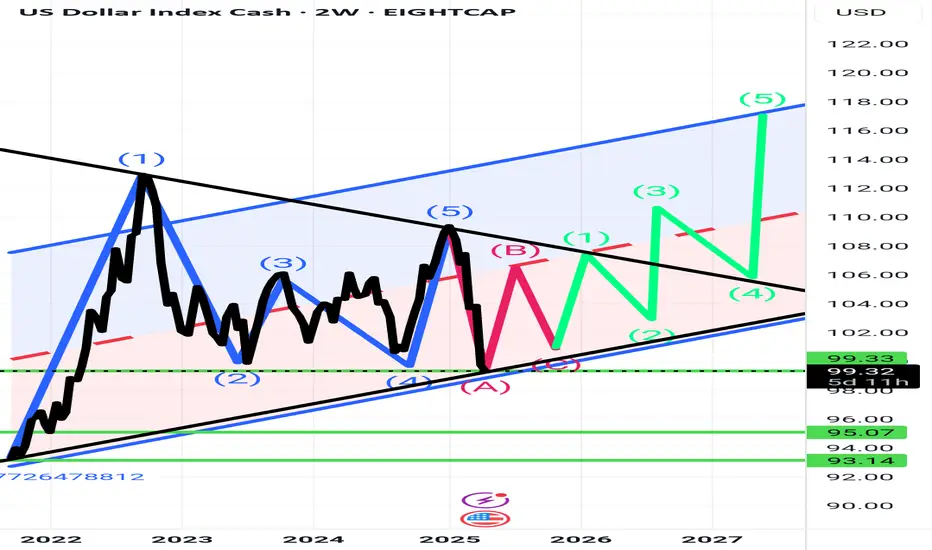
Dxy monthly analysis The dollar will fall to unprecedented levels due to several stupid policies, in addition to the US debt disaster. This is a medium- and long-term analysis using Elliott Waves, in addition to expected liquidity zones. Finally, I would like to ask: Is this the end of the dollar with China's increasing rise, or is this the beginning of preparations and selling by the major players in preparation for World War III, which will occur in 2027 or perhaps sooner?

I've Cracked the BULLISH Code in Dollar IndexDollar Index is setup for longs based on COT and other fundamental underlying conditions.

DXY: Local Bullish Bias! Long!
My dear friends,
Today we will analyse DXY together☺️
The recent price action suggests a shift in mid-term momentum. A break above the current local range around 99.390 will confirm the new direction upwards with the target being the next key level of 99.627 and a reconvened placement of a stop-loss beyond the range.
❤️Sending you lots of Love and Hugs❤️

DXY zoomed outBear Flag with price target breaking larger bear flag. Could this actually mark the dollar top for a long time?
Not financial advice

DXYElement: Details
Trend: Bearish on Daily
Bias Zone: Resistance at 100.160 (Monday high)
COT Timing: Tuesday close used for sentiment anchor
1H Pattern: M-Pattern confirming rejection
Target: 99.200 (Monday low - key support)
Outcome: Target hit on Wednesday

Altseason and a Weak Dollar — Will History Repeat in 2025?The altseason of 2017 started at the same time as the U.S. dollar index (DXY) began to fall. This likely helped bring more money into the crypto market. In 2020–2021, a similar thing happened: the falling dollar was followed by a strong rise in altcoins. But that time, altseason started closer to the end of the dollar’s decline.
A weaker dollar makes risky assets like crypto more attractive. In April 2020, the total crypto market cap was around $218 billion. Today, it’s about $2.63 trillion — around 12 times bigger.
However, to start a new altseason now, the market may need a lot more cheap money than in 2020. I’m not sure if the 2025 altseason can be as strong as in the past.
Now it seems that the only way to repeat that success is if a big part of the capital moves from Bitcoin into altcoins. This would need a sharp drop in Bitcoin dominance. But this brings new questions. After the launch of Bitcoin ETFs, the ownership structure has changed. Many people now own Bitcoin through investment funds, not directly. These funds may not be very excited to invest in altcoins.
What do you think about it? Share your opinion in the comments.

USD index bearish trendThe analyst expects the correction to end when the USDX reaches a value of 101.800. This is the predicted target for the end of the "C" wave of the correction. Once the index hits 101.800 (according to this analysis), the correction is expected to be complete, and the USDX may then resume its previous (likely upward) trend.
In short: The USDX is expected to fall to 101.800 to finish a temporary price dip (correction) that's shaped like an ABC pattern.

DXY Is Bullish! Buy!
Take a look at our analysis for DXY.
Time Frame: 9h
Current Trend: Bullish
Sentiment: Oversold (based on 7-period RSI)
Forecast: Bullish
The market is on a crucial zone of demand 99.408.
The oversold market condition in a combination with key structure gives us a relatively strong bullish signal with goal 101.388 level.
P.S
Please, note that an oversold/overbought condition can last for a long time, and therefore being oversold/overbought doesn't mean a price rally will come soon, or at all.
Disclosure: I am part of Trade Nation's Influencer program and receive a monthly fee for using their TradingView charts in my analysis.
Like and subscribe and comment my ideas if you enjoy them!

DXYBased on 6 consecutive bearish Commitment of Traders (COT) the US Dollar Index (DXY) is exhibiting a sustained bearish momentum, potentially indicating a decline in the US dollar's value relative to other major currencies.

check the trendThe price is expected to change the trend in the current support range and we will witness the start of an upward trend.
If the price breaks through the support range, the continuation of the downward trend will be likely.

Global Market Overview. Part 1: USDXThe Dollar Index is drifting at the key 99.5 mark. This strategic support level, which has held since early 2024, is on the verge of collapsing.
Let’s be clear: this isn’t just about the strength of the dollar. What’s at stake is the monetary sovereignty of the United States, caught between inflation, politics, and election-season hysteria.
And make no mistake — this has nothing to do with technical analysis. What we’re witnessing is a fundamental fire, and Donald Trump and his administration are fanning the flames.
Powell: “Rates remain unchanged.” But for how long?
Just days ago, Fed Chair Jerome Powell delivered what seemed to be a firm message:
“We are in a wait-and-see mode. Cutting rates prematurely could do harm.”
“If inflation accelerates, more difficult decisions may follow.”
On the surface — classic hawkish rhetoric. But in reality, this isn’t resolve.
It’s a delay tactic. Even Powell admits:
“The labor market is walking a fine line.”
“Economic growth weakened in Q1.”
“Business sentiment is deteriorating.”
“Tariff policy could lead to stagflation.”
“Political pressure is mounting by the week.”
The Fed says, “It’s too early to cut rates.”
But the market hears something entirely different: “We’re getting close.”
Trump applies pressure
Ahead of the elections, Trump declares:
“If we don’t cut rates now, we’ll lose to China, Europe, and our own markets.”
This isn’t just campaign rhetoric. It’s an open challenge to the Fed’s independence.
And history already tells us what happens when Trump applies pressure — 2019 rate cuts proved he can break through Powell’s defenses.
What the charts are saying
The Dollar Index (USDX) is locked in a persistent downward channel.
The 103.0 support zone has been broken
The 101.17 level remains the final significant support
99.5 is already being tested as a potential sell-off trigger
Below that — only air until 98.0 and 97.5
The technical setup confirms a fundamental truth:
The market no longer believes in the dollar’s strength.
What if the Fed actually cuts rates?
If the Fed moves to cut, USDX will break below 99 and enter a systemic phase of weakening.
Capital will flow into gold (as if it hasn’t already gone far enough), oil, crypto, and high-yield emerging markets.
The United States will lose its competitive edge in monetary policy,
and the dollar will slowly cease to function as the global anchor it once was.
Powell can talk tough all he wants. The market is no longer listening.
The Dollar Index isn’t dropping because rates are already cut — it’s falling because everyone knows it’s just a matter of time.
U.S. monetary policy has lost the initiative, and market expectations have taken over.
Today, the Fed rate is no longer a tool of control. It’s a signal of approaching capitulation.
The question is no longer “Can we hold 99.5?”
The real question is: “What happens after it breaks?”
Manipulation or strategy? Black swans on a leash
Powell’s rate policy, DXY charts, inflation forecasts — all of it loses clarity when the dominant market force is no longer economics, but politics.
We live in an era where markets break not from bad data, but from tweets, briefings, and backroom deals — moves that only reveal themselves in the charts after the fact.
That’s what makes the current cycle the most toxic in the last 15 years.
Markets aren’t just volatile — they’ve become irrational.
Trade war: scalpel in a surgeon’s hand or a bat in a brawler’s grip?
Tariffs aren’t new.
But in Trump’s hands, they’ve evolved — from macroeconomic tools to blunt political weapons.
He uses them as battering rams — to force concessions, corner opponents, and set up ideal conditions for insider gains.
The market reacts exactly as you’d expect:
Tariffs announced — indexes fall
Panic ensues — capital flees into dollars and gold
Within 48 hours — videos surface of Trump and his allies joking about the “hundreds of billions” they made during the crash
This isn’t conspiracy.
It’s already triggered official investigations, but everyone knows: the odds of accountability are near zero.
And that’s the biggest risk for fundamental analysis today:
It’s powerless against narratives crafted behind closed doors.
So who’s really running the market?
Trump is deliberately deflating the bubble. Loudly. Dramatically. On camera.
But the goal isn’t destruction. It’s control.
And while Powell fears making a mistake, Trump fears only one thing — losing control of the narrative.
The market is no longer a field for rational actors.
It has become a battlefield, where officials already understand:
You can control more than just money through the market — you can shape public consciousness.
How not to lose your footing in this chaos?
We’ll break it down in the next part of the Global Market Overview. Stay tuned.

dxy-1Ddollar index has a bearish gaurd to close it's cycle and sweep the liquidities to provide its fuel to form new HHs...

Key Support Level on DXY Index at 97-98In this analysis, I highlight the important support zone for the DXY (US Dollar Index) around the 97-98 level. Monitoring this zone is crucial for understanding potential price movements and trading opportunities.
