DXY(Dollar)Dollar is consolidating and its best to wait for it to break out of the high or low. As of now it is in ‘No Mans Land’.
DXY trade ideas


DXY: Bears Are Winning! Short!
My dear friends,
Today we will analyse DXY together☺️
The in-trend continuation seems likely as the current long-term trend appears to be strong, and price is holding below a key level of 99.125 So a bearish continuation seems plausible, targeting the next low. We should enter on confirmation, and place a stop-loss beyond the recent swing level.
❤️Sending you lots of Love and Hugs❤️

USD Oversold on Weekly & Fibonacci Support TestWeekly charts can be helpful for tracking the motion of the ocean, or larger dominant trends. And so far in 2025, that trend has been quite bearish for the US Dollar and this showed up even with the Greenback coming into 2025 with a full head of steam.
But last week something that's somewhat rare showed up - as weekly RSI on DXY went into oversold territory for only the second time in the past seven years.
The last time this happened was August of 2024, and that was followed by the Q4 reversal in the USD. And before that - it was all the way back in early-2018, which is around when DXY marked a major low that still hasn't been traded through.
This isn't to say that RSI is an automatic indication of reversal because it's not - it's simply a lagging indicator that shows how one sided a trend has been of late. But - it does illustrate how chasing the USD lower could be a challenge here especially given how quickly bears have come on over the past couple of months.
There's also some Fibonacci support that's in-play which is very near support in the range of USD that held for a couple of years before the Q4 breakout. The 61.8% retracement of the 2021-2022 major move plots right at 98.98, which has so far held the lows in DXY.
Of interest and perhaps a bigger component of this move is whether EUR/USD will be able to establish a reversal at or around the 1.1500 handle. And that's a question mark right now, because from a data and driver perspective, it would seem that the backdrop is there as US retail sales printed with strength this week, and Chair Powell sounded somewhat hawkish around the prospect of inflation given the tariff situation. And then the ECB rate cut on Thursday sounded dovish - all factors that would normally be expected to push EUR/USD weakness.
The fact that it hasn't happened is of interest as this could be a bigger picture dominant trend showing it's hand. As I shared in the EUR/USD post which I'll link below, bulls are still in charge of the pair from a price action perspective so accordingly I would still assume bears are in-control of USD until evidence suggests otherwise. In DXY, it's the 102 level that I would like to see traded through as illustration of bulls taking control. -js

US exceptionalism is overwhat if te era of us exceptionalism is over.
The dollar will still be reserve curency but demand will be serverly cut, faith in the us fails and the dollar reprices back to where it was.
right now not looking great. im not call for death of the dollar just a repice back to normality
Dxy looks ike it could jsut sweep all the way back

Smart Traders Watch the Fed — Smarter Ones Watch the DollarHello Traders 🐺
In this idea, I decided to talk about the U.S. Dollar Index (DXY) — because so many people have been asking me:
“How do you predict the Fed’s moves, and how do they affect deflationary assets like BTC?”
My last idea was about BTC, where I explained why I believe a major bull run is coming — and part of that is because the Fed might soon shift back to QE.
But if you're trying to predict QE...
The first thing you need to watch is the U.S. Dollar Index, which reflects the strength of the U.S. Dollar.
So let’s break it all down:
🔍 Part 1: What Does the Fed Actually Do?
The Fed isn’t just a printer — it’s the U.S. central bank, and it has a dual mandate:
✅ Keep prices stable (control inflation)
✅ Promote maximum employment
That means the Fed doesn’t just want growth — it wants sustainable growth. No crazy inflation, no deep recession. Balance is key.
🧰 How Does the Fed Do It?
Through Monetary Policy, which is basically the toolkit used to control liquidity, interest rates, and economic behavior (like how much people borrow, spend, or save).
Let’s break down the main tools:
1️⃣ Federal Funds Rate
This is the most powerful tool the Fed has.
It’s the rate banks use to lend to each other overnight.
If the Fed raises the rate:
→ Loans get expensive
→ Spending slows
→ Inflation drops
→ But markets can crash
If the Fed cuts the rate:
→ Loans get cheaper
→ Demand rises
→ Growth accelerates
→ But inflation can surge
2️⃣ Open Market Operations (OMO)
This is how the Fed injects or removes liquidity using bonds.
Buys bonds → Injects money → 🟩 QE (Quantitative Easing)
Sells bonds / lets them expire → Removes money → 🟥 QT (Quantitative Tightening)
3️⃣ Reserve Requirements
This used to be a big deal — the % banks had to hold in reserves.
But since 2020, it's set to 0%.
4️⃣ Discount Rate
The interest rate the Fed charges banks directly.
A change here sends a strong signal to the markets.
Sometimes the Fed also works in sync with the U.S. government — using fiscal support like:
💸 Stimulus checks
🏢 Corporate bailouts
🧾 Tax relief packages
📈 So... Why Does the Dollar Index (DXY) Matter?
There’s a very clear inverse correlation between the DXY and BTC.
When the dollar gets stronger (DXY pumps), BTC usually dumps.
Why? Because rising DXY often means:
🔺 The Fed is raising rates
🔺 Liquidity is being pulled out
🔺 QT is in play
Let me show you some real chart examples:
📉 July 2014 — DXY pumped → BTC dumped hard
DXY Chart:
BTC Chart:
➡️ Just a 28% DXY pump → 80% BTC crash. Ouch.
📈 2017 — DXY dropped → BTC entered full bull market
DXY Chart:
BTC Chart:
➡️ A 15% DXY drop → Bitcoin bull run of a lifetime.
Now here’s the good news 👇
DXY is starting to look very bearish on the chart:
Combine that with the Fed shifting to QE, and guess what?
We're likely entering the early stages of another bull market.
If you read my last BTC idea, you already know what I’m expecting...
🚀 A massive run is just around the corner.
I hope you found this idea useful, and as always —
🐺 Discipline is rarely enjoyable, but almost always profitable 🐺
🐺 KIU_COIN 🐺

Despite long-term support, the dollar is eyeing deeper watersAlthough the US Dollar (USD) Index has connected with a monthly support area between 98.72 and 99.67, April’s lower low at 99.01 reached levels not seen since early 2022 and price crossing below the 50-month simple moving average (SMA) at 101.91 potentially questions this support zone.
Bolstering the likelihood of additional downside in the USD are the daily and H4 charts. The former exhibits scope to reach support at 98.58 (and formed a Death Cross ), while the latter completed a bearish pennant pattern (ruptured the lower boundary), extended from 100.64 and 99.01. As you can see, H4 action is currently retesting the underside of the breached pattern’s border.
In view of the above technical surroundings, USD shorts could have some gas left in the tank.

USDX-BUY strategy 6 hourly chart Line Brk (2)The USDX is poised to correct, I feel. we are oversold, and it means we may be seeing a return back towards 101.50-101.75 area. this suggest all USD based currencies will correct one way or another.
Strategy BUY @ 99.30-99.80 and take profit near 101.50.

Dollar Index UpdateDollar index hasn't broken support, and ECB meeting tomorrow.
I went into gold today anyways because the pumping will counteract any rise in teh dollar, lol.
If gold dips tomorrow after the meeting, I'm adding more.

DXY – Key Level Broken, More Downside Ahead?Hello Folks , Long time no see .
The US Dollar Index (DXY) just broke below 106.5, and things are getting interesting. The trend has been weakening, and price is now sitting at a crucial zone.
📌 Here’s what I’m watching:
107.66 is the big resistance. If price can reclaim it, bulls might have a chance.
105.48 & 104.46 are the next major support levels.
👀 My Take:
If we stay below 106.5, I expect more downside towards 105.4 and maybe 103.3. If price bounces and reclaims 107, I’ll reconsider.
What’s your view? More downside or a bounce coming? Drop your thoughts below! 🚀🔥
🚨 Disclaimer:
Just sharing ideas here—this isn’t a trade advice . Everyone sees the market differently, and the goal is to improve our analysis, not tell anyone what to do. At the end of the day, your trades are your call, your responsibility. Trade smart! 🚀📊

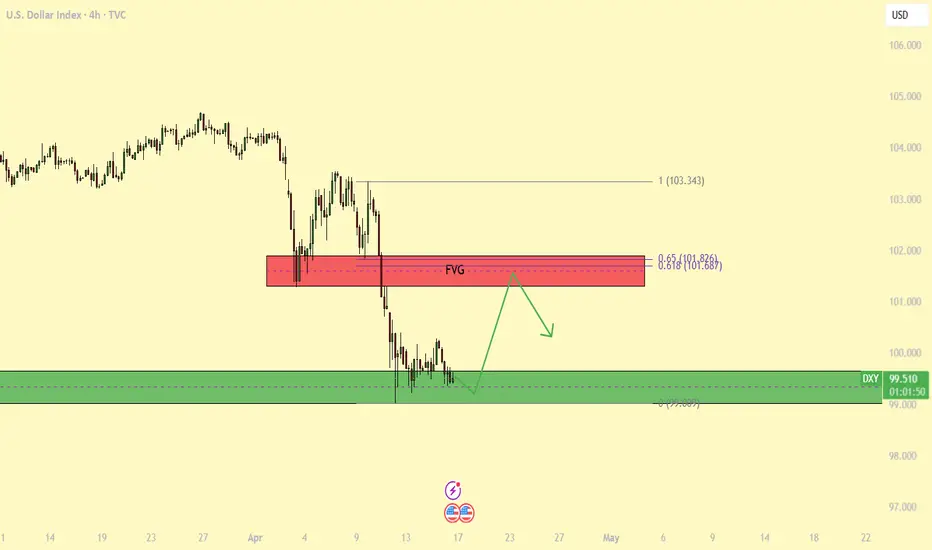
DXY - Is a relief bounce to the 4-h FVG coming?The US Dollar Index (DXY) has been in a clearly defined downtrend over the recent period, showing consistent lower highs and lower lows. During its latest downward move, the DXY formed a 4-hour Fair Value Gap (FVG), which aligns with a significant gap in price action. This confluence of technical factors marks a strong rejection area, and from a trading perspective, it presents an ideal zone to consider short positions, especially if bearish price action confirms the setup.
Currently, however, the DXY is sitting at a major support level. This level has historically acted as a demand zone, and given the extended move downward, a bounce or retracement to the upside is a realistic scenario. Traders should stay alert for signs of bullish momentum or reversal patterns, as the potential for a temporary recovery from this support is not unlikely before any continuation of the broader trend.
Thanks for your support.
- Make sure to follow me so you don't miss out on the next analysis!
- Drop a like and leave a comment!
The Great Long. DXY LIQUIDITY GAME.We knowgood old SEC days are coming, Fed Pivot is coming and a strong dollar is coming with it. But for now
Let me explain you this chart.
The chart is on a weekly timeframe but all the points of interest and liquidity can be perfectly seen on the monthly as well.
I want to show you how price moves from liquidity zone to liquidity zone touching specific areas no matter what.
Following all the red lines that are previous highs that the price made (liquidity) and the low from July 2023.
For me this chart is pure art, this is the game I look for when daytrading, but for this being on a weekly/monthly chart is just mesmerizing.
This previous -10% drop from Jan-Feb till today, comes from a very specific point in the chart.
And the +15% pump that I see, is coming from a very specific point as well.
As you can see this drop comes after liquidating several highs (sellside liquidity) on the way to a predominant imbalance that respected perfectly. What I want to say is that price follow liquidity first then touches a specific zone and respects it.
Now, we have the same scenario but now we have targeted July 2023 low and a weekly imbalance. A significant low has been triggered and a point of interest has been fille. Fed Pivot is coming and we expect to see a strong dollar in the long run.
I think this is just the perfect point in the chart for direction to shift and to start to price-in what is about to come. Last monday (Black Monday) was a climatic point.
Events bring the volatility for price to make it where it has to,
I think this is the turning point.
I hope you enjoyed the content this is NOT Financial advice. I just want this analysis and info to be here.

Dixie 41625Still in a long term uptrend and testing the lower range of its rising channel. Uncertainty may bring short term vol to the downside . But once the world understands that this is a global crisis. Dollar will once again gain strength against all others, Euro, Japanese Yen, British Pound, Canadian Dollar, Swedish Krona, Swiss Franc. The dollar will rip to new highs and continue its golden retrace target.
Bitcoin down, which ive said. Gold and silver continue marching up. Real things hold stable and are the only true stores of value.

Big Drop Ahead on DXY! Smart Money Already Selling!”Idea in Simple Terms:
Bias: Bearish.
Current Position: Wave B or early C.
Action Plan: Look for sell setups in the minor resistance zones.
Final Target: 92.00–94.00 area .
“Key Idea” Illustration:
This shows a simplified roadmap:
DXY is expected to rally slightly into the minor resistance.
Then, a sharp drop toward the blue demand zone, respecting the ABC correction.

DXY HOTW InDXY HOTW IN
OHLC Profile
Have to treat this choppy PA with caution and wait for extra confirmations.
Expecting a Powell Speech delivery tonight.

DXY
as I said in the session yesterday
Expect this chart to consolidate in this range... this will expereince volatility when in about 8hours or so, powell speaks.

DXY Bullish Reversal Setup – Long Entry from Support Zone TowardEMA 30 (Red Line): Currently at 99.700 — tracks short-term trend, and price is hovering near this level.
EMA 200 (Blue Line): At 100.935 — indicates long-term trend, acting as dynamic resistance above.
📈 Trade Setup
✅ Entry Point:
Price: 99.699
Rationale: This level has been tested multiple times, forming a support zone. A bounce here signals a potential long entry.
🎯 Target Point (Take Profit):
Price: 102.738
Distance: ~3.04 points or 3.43% potential move upward.
Note: Marked as EA TARGET POINT, which suggests a calculated area possibly based on previous resistance or algorithmic strategy.
🛑 Stop Loss:
Price: 98.624
Reasoning: Just below the defined support zone (highlighted purple area), ensuring protection against downside breakouts.
📊 Risk-to-Reward Ratio
Entry: 99.699
Target: 102.738 → Gain of ~3.04
Stop: 98.624 → Risk of ~1.08
R/R Ratio: ~2.8:1 — favorable setup
📌 Overall Sentiment
This chart indicates a bullish reversal setup from a strong support zone, possibly targeting a mean reversion or trend reversal toward the 200 EMA and beyond.
However, keep in mind:
The price is currently below both EMAs, so the trend is still bearish.
The trade is counter-trend, relying on support holding and momentum shifting.

.DXY (U.S.DOLLAR INDEX) M30 ANALYSIS UPDATES
🔍 **Chart Overview:**
- The chart shows a recent **bearish movement** after a double top pattern, indicated by the red arrows.
- Price has dropped significantly and is approaching a **key support zone** around **99.209 – 99.253**.
- A potential **bullish reversal** is anticipated from this support zone.
---
🧠 **Trade Idea:**
✅ **Bullish Scenario (Primary Setup):**
1. **Wait for price action** confirmation around the support area **(99.209 – 99.253)**.
2. Once bullish confirmation appears (e.g., bullish engulfing, pin bar, or double bottom), look for **buy entries**.
3. **First target:** **99.839** (minor resistance zone).
4. **Final target:** **100.607** (major resistance & previous high).
❗️**Invalidation:**
- If price breaks and closes **below 99.209** with strong bearish momentum, the bullish idea becomes invalid and further downside may be expected.
. 🧩 **Strategy Notes:**
- This setup assumes a potential **V-shaped recovery** after a liquidity grab below the recent low.
- Watch for **U.S. economic data releases**, as marked on the chart – they may trigger volatility and impact DXY movement.

The US dollar is Forex's weakest currency this year 2025Fall of the US dollar: institutional investors were already selling in February
The US dollar (DXY) is officially the weakest currency on the floating foreign exchange market (Forex) since the beginning of the year. Down over 8% against all the world's major currencies, this vertical downtrend had been anticipated by technical analysis as early as January. This comes as no surprise to those who follow major technical signals: breakout of the 200-day moving average in early March, structural pressures visible with the Elliott wave fractal approach, bearish signals from the ichimoku system... in short, the technical tools had spoken, and the market has effectively embarked on a downtrend this year 2025.
The question now is: is a bottom in sight? In the short term, perhaps, the market is testing the strong chartist support of 99/100 points on the DXY (see main chart of this analysis).
In the medium term, the downtrend could continue. One thing is clear, and that is that institutional positioning has played a central role in the downturn: hedge funds and asset managers all turned bearish on the US dollar in the depths of winter. As early as February, the former became net buyers of EUR/USD, as shown by the CFTC's COT report. Then, at the beginning of March, all institutional investors became net sellers of the US dollar against a basket of major currencies (see the inset data in the chart below).
Bis repetita with the first year of Trump's first term (2017)
It was the trade war, that of the so-called reciprocal tariffs, which saw the increase in medium-term bearish technical signals on the US dollar against a basket of major currencies. Volatility on Wall Street exploded, not least because of the Trump administration's escalating tariffs. The US economic climate is becoming increasingly unpredictable for markets, with trade policy seemingly improvised and decisions generating systemic uncertainty.
But that's not all: the US bond market is also sending out warning signals. The 10-year yield has gone up, and spreads between the US and other developed economies have widened. Some even speak of a form of Chinese pressure on US debt, through massive sales of Treasuries. The MOVE index, a barometer of bond volatility, confirms it: the tension is there, and it's clearly weighing on the dollar.
DISCLAIMER:
This content is intended for individuals who are familiar with financial markets and instruments and is for information purposes only. The presented idea (including market commentary, market data and observations) is not a work product of any research department of Swissquote or its affiliates. This material is intended to highlight market action and does not constitute investment, legal or tax advice. If you are a retail investor or lack experience in trading complex financial products, it is advisable to seek professional advice from licensed advisor before making any financial decisions.
This content is not intended to manipulate the market or encourage any specific financial behavior.
Swissquote makes no representation or warranty as to the quality, completeness, accuracy, comprehensiveness or non-infringement of such content. The views expressed are those of the consultant and are provided for educational purposes only. Any information provided relating to a product or market should not be construed as recommending an investment strategy or transaction. Past performance is not a guarantee of future results.
Swissquote and its employees and representatives shall in no event be held liable for any damages or losses arising directly or indirectly from decisions made on the basis of this content.
The use of any third-party brands or trademarks is for information only and does not imply endorsement by Swissquote, or that the trademark owner has authorised Swissquote to promote its products or services.
Swissquote is the marketing brand for the activities of Swissquote Bank Ltd (Switzerland) regulated by FINMA, Swissquote Capital Markets Limited regulated by CySEC (Cyprus), Swissquote Bank Europe SA (Luxembourg) regulated by the CSSF, Swissquote Ltd (UK) regulated by the FCA, Swissquote Financial Services (Malta) Ltd regulated by the Malta Financial Services Authority, Swissquote MEA Ltd. (UAE) regulated by the Dubai Financial Services Authority, Swissquote Pte Ltd (Singapore) regulated by the Monetary Authority of Singapore, Swissquote Asia Limited (Hong Kong) licensed by the Hong Kong Securities and Futures Commission (SFC) and Swissquote South Africa (Pty) Ltd supervised by the FSCA.
Products and services of Swissquote are only intended for those permitted to receive them under local law.
All investments carry a degree of risk. The risk of loss in trading or holding financial instruments can be substantial. The value of financial instruments, including but not limited to stocks, bonds, cryptocurrencies, and other assets, can fluctuate both upwards and downwards. There is a significant risk of financial loss when buying, selling, holding, staking, or investing in these instruments. SQBE makes no recommendations regarding any specific investment, transaction, or the use of any particular investment strategy.
CFDs are complex instruments and come with a high risk of losing money rapidly due to leverage. The vast majority of retail client accounts suffer capital losses when trading in CFDs. You should consider whether you understand how CFDs work and whether you can afford to take the high risk of losing your money.
Digital Assets are unregulated in most countries and consumer protection rules may not apply. As highly volatile speculative investments, Digital Assets are not suitable for investors without a high-risk tolerance. Make sure you understand each Digital Asset before you trade.
Cryptocurrencies are not considered legal tender in some jurisdictions and are subject to regulatory uncertainties.
The use of Internet-based systems can involve high risks, including, but not limited to, fraud, cyber-attacks, network and communication failures, as well as identity theft and phishing attacks related to crypto-assets.

DXY IN NEXT 6 MONTHSBIGBOY join the market and now they BUY stocks, what you sell! Becarefull with your assets.

US Dollar Long Term Projection!This is a big if but...
If the USA and the TVC:DXY was to loose its reserve status then this chart would breakdown to the bottom of the blue trend line! This range target is 50% off from current levels!

DXY PROJECTION BY JJJFXTVC:DXY
DXY is clean and clear now. We are trading above the weekly and daily open. Give us crt high as our key level and if price close above the key level we expect price to trade into 50% of the range WkH and WkL. We have two zone above which are fvg and the 50% each fvg is shown.

The DXY shows a downward tendency.In the long run, the implementation of tariffs will prompt trading partners to take countermeasures 😡, resulting in a contraction of the global trade scale 😔. American enterprises will face higher import costs for raw materials, and their export markets will be restricted, thus curbing the economic growth of the United States 😩. This will put depreciation pressure on the US dollar, causing the DXY to decline 📉.
U.S. Tariff Policies
Since April 9th, the United States has levied tariffs ranging from 10% to 25% on goods from China, the European Union, Canada, and other regions. These tariffs cover crucial sectors like automobiles, steel, and semiconductors 😒.
Countermeasures of Various Countries
China: On April 4th, China declared that it would impose a 34% tariff on U.S. goods starting from April 10th. Then, on April 9th, the tariff rate was further hiked to 84%, applying to all U.S. goods 😠.
The European Union: Announced that it would impose a 25% tariff on U.S. motorcycles, diamonds, and other goods as of May 16th 😤.
Canada: On April 9th, imposed a 25% retaliatory tariff on U.S. automobiles, while exempting auto parts 😏.
💰💰💰 DXY 💰💰💰
🎯 Sell@ 100 - 101
🎯 TP 98 - 97
Traders, if you're fond of this perspective or have your own insights regarding it, feel free to share in the comments. I'm really looking forward to reading your thoughts! 🤗
👇The accuracy rate of our daily signals has remained above 98% within a month! 📈 We sincerely welcome you to join our channel and share in the success with us! 👉
