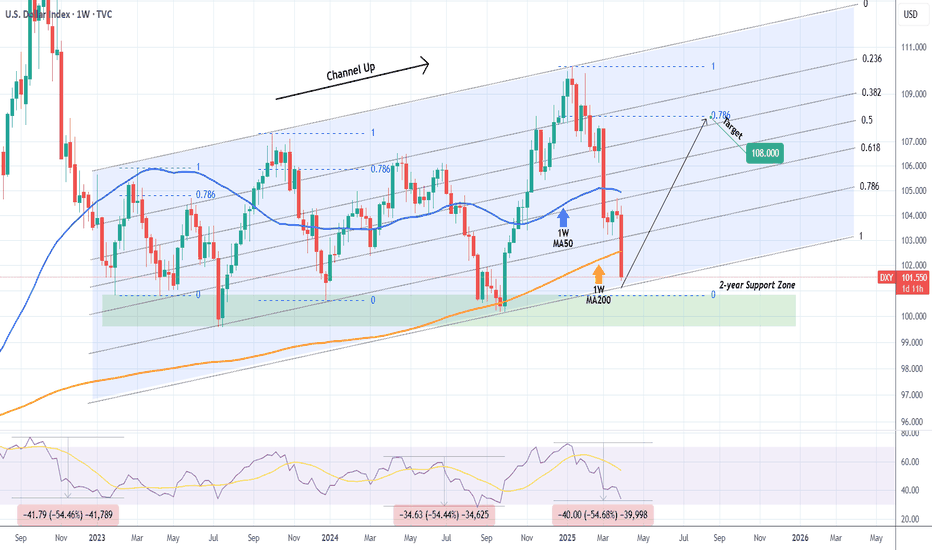
DXY just broke below the 1W MA200 after 6 months!The U.S. Dollar index (DXY) broke today below its 1W MA200 (orange trend-line) for the first time in 6 months (since the week of September 30 2024). By doing so, it has almost hit the bottom (Higher Lows trend-line) of the long-term Channel Up.
The last contact with the 1W MA200 initiated a massive Bullish Leg two weeks after, so it would be an encouraging development if the candle holds here or better yet even close above the 1W MA200.
If it does, we expect a new strong Bullish Leg to start, targeting initially at least the 0.786 horizontal (blue) Fibonacci level at 108.000.
If not, the 2-year Support Zone is the last defense, with 99.600 as its lowest level (the July 10 2023 Low). Below that, a multi-year downtrend for DXY awaits.
Notice however, the incredible 1W RSI symmetry between selling sequences. Since January 2023, we've had two -54.50% declines. Right now, the current decline since January 2025 is exactly at -54.50%. If DXY rebounds here, it will confirm this amazing symmetry.
-------------------------------------------------------------------------------
** Please LIKE 👍, FOLLOW ✅, SHARE 🙌 and COMMENT ✍ if you enjoy this idea! Also share your ideas and charts in the comments section below! This is best way to keep it relevant, support us, keep the content here free and allow the idea to reach as many people as possible. **
-------------------------------------------------------------------------------
💸💸💸💸💸💸
👇 👇 👇 👇 👇 👇
DXY trade ideas
"DXY/Dollar Index" Bull Money Heist Plan (Scalping / Day Trade)🌟Hi! Hola! Ola! Bonjour! Hallo! Marhaba!🌟
Dear Money Makers & Robbers, 🤑 💰💸✈️
Based on 🔥Thief Trading style technical and fundamental analysis🔥, here is our master plan to heist the "DXY/Dollar Index" Indices Market. Please adhere to the strategy I've outlined in the chart, which emphasizes long entry. Our aim is the high-risk Red Zone. Risky level, overbought market, consolidation, trend reversal, trap at the level where traders and bearish robbers are stronger. 🏆💸"Take profit and treat yourself, traders. You deserve it!💪🏆🎉
Entry 📈 : "The heist is on! Wait for the MA breakout (104.100) then make your move - Bullish profits await!"
however I advise to Place Buy stop orders above the Moving average (or) Place buy limit orders within a 15 or 30 minute timeframe most recent or swing, low or high level.
📌I strongly advise you to set an "alert (Alarm)" on your chart so you can see when the breakout entry occurs.
Stop Loss 🛑:
Thief SL placed at the recent/swing low level Using the 1H timeframe (103.500) Scalping/Day trade basis.
SL is based on your risk of the trade, lot size and how many multiple orders you have to take.
🏴☠️Target 🎯: 105.000 (or) Escape Before the Target
🧲Scalpers, take note 👀 : only scalp on the Long side. If you have a lot of money, you can go straight away; if not, you can join swing traders and carry out the robbery plan. Use trailing SL to safeguard your money 💰.
"DXY/Dollar Index" Indices Market Heist Plan (Scalping / Day Trade) is currently experiencing a bullishness,., driven by several key factors.
📰🗞️Get & Read the Fundamental, Macro Economics, COT Report, Geopolitical and News Analysis, Sentimental Outlook, Intermarket Analysis, Index-Specific Analysis, Positioning and future trend targets... go ahead to check 👉👉👉🔗
⚠️Trading Alert : News Releases and Position Management 📰 🗞️ 🚫🚏
As a reminder, news releases can have a significant impact on market prices and volatility. To minimize potential losses and protect your running positions,
we recommend the following:
Avoid taking new trades during news releases
Use trailing stop-loss orders to protect your running positions and lock in profits
💖Supporting our robbery plan 💥Hit the Boost Button💥 will enable us to effortlessly make and steal money 💰💵. Boost the strength of our robbery team. Every day in this market make money with ease by using the Thief Trading Style.🏆💪🤝❤️🎉🚀
I'll see you soon with another heist plan, so stay tuned 🤑🐱👤🤗🤩
DXY Will Go Lower From Resistance! Sell!
Take a look at our analysis for DXY.
Time Frame: 12h
Current Trend: Bearish
Sentiment: Overbought (based on 7-period RSI)
Forecast: Bearish
The market is on a crucial zone of supply 104.207.
The above-mentioned technicals clearly indicate the dominance of sellers on the market. I recommend shorting the instrument, aiming at 102.727 level.
P.S
We determine oversold/overbought condition with RSI indicator.
When it drops below 30 - the market is considered to be oversold.
When it bounces above 70 - the market is considered to be overbought.
Disclosure: I am part of Trade Nation's Influencer program and receive a monthly fee for using their TradingView charts in my analysis.
Like and subscribe and comment my ideas if you enjoy them!
DXY | Major Cycle Peak – Is the Dollar Losing Its Grip?The U.S. Dollar Index (DXY) appears to be following a well-defined historical cycle, marking major peaks approximately every 15–20 years. If history repeats, the 2022 peak near 114 could signal the beginning of a multi-year dollar decline, impacting global markets, commodities, and currency pairs like EUR/USD.
Historical Peaks & Reversals
Examining past DXY cycles, we see:
969 Peak (~120): Followed by a prolonged decline into the 1970s.
1985 Peak (~165): Marked by the Plaza Accord, triggering a sharp dollar downtrend.
2001 Peak (~120): Led to a multi-year decline as the Fed shifted policies.
2022 Peak (~114): The most recent high—could it mark the next major reversal?
Each peak historically aligns with aggressive Fed tightening cycles, followed by a shift towards easing policies, leading to a weaker dollar. With U.S. interest rates expected to plateau or decline, this pattern suggests a potential long-term bearish trend for the dollar.
Implications of a Weaker Dollar
Bullish for EUR/USD – A declining DXY typically strengthens the euro.
Boost for Commodities – Gold, oil, and other dollar-denominated assets could rally.
Stronger Emerging Markets – A softer dollar eases financial conditions globally.
With DXY showing signs of a historical cycle peak, investors and traders should watch for confirmation of a multi-year downtrend, potentially reshaping global markets.
Dollar I Monday CLS, KL - Order Block, Model 1Hey Traders!!
Feel free to share your thoughts, charts, and questions in the comments below—I'm about fostering constructive, positive discussions!
🧩 What is CLS?
CLS represents the "smart money" across all markets. It brings together the capital from the largest investment and central banks, boasting a daily volume of over 6.5 trillion.
✅By understanding how CLS operates—its specific modes and timings—you gain a powerful edge with more precise entries and well-defined targets.
🛡️Follow me and take a closer look at Models 1 and 2.
These models are key to unlocking the market's potential and can guide you toward smarter trading decisions.
📍Remember, no strategy offers a 100%-win rate—trading is a journey of constant learning and improvement. While our approaches often yield strong profits, occasional setbacks are part of the process. Embrace every experience as an opportunity to refine your skills and grow.
Wishing you continued success on your trading journey. May this educational post inspire you to become an even better trader!
“Adapt what is useful, reject what is useless, and add what is specifically your own.”
David Perk ⚔
DXY DTF AnalysisDXY DTF Analysis
DXY is currently in a downtrend, creating lower highs and lower lows. Price has recently broken below a minor key level at 103.300, followed by a retracement that targeted stop losses from sellers. This retracement has created liquidity at the liquidity zone, further validating the bearish sentiment. With the break below the minor support level, we are expecting the downtrend to continue.
Outlook and Key Technical Levels :
🔹 Minor Key Support: 103.300 (Break below signals bearish continuation)
🔹 Minor Key Resistance: 103.090 (Retracement level for sell limit order entry)
🔹 Next Minor Support: 99.850 (Downside target for sellers)
Fundamental Insight and Market Sentiment
📉 U.S. Dollar Weakness: The U.S. dollar has been under pressure recently due to growing concerns over tariffs, which have created uncertainty in the markets. This has fueled fears of a potential economic slowdown, with tariffs negatively impacting investor sentiment. The ongoing trade tensions and global uncertainties have resulted in a weaker outlook for the dollar, aligning with the technical breakdown in the DXY.
📈 Global Market Dynamics: Meanwhile, global risk sentiment remains mixed, with market participants seeking safer assets like gold, further weighing on the dollar. The negative impact from U.S. trade policies, combined with a shift in investor confidence, is contributing to a bearish outlook for the DXY.
Given the technical setup and broader market sentiment, we are closely monitoring DXY for potential sell opportunities, especially if price retraces within the identified levels for a better entry point.
📌 Disclaimer:
This analysis is for informational and educational purposes only and should not be considered financial advice. Trading involves substantial risk, and past performance is not indicative of future results. Always conduct your own research and consult with a financial professional before making any investment decisions.
The DXY extends its decline, maintaining a bearish sentiment The DXY extends its decline, maintaining a bearish sentiment as it sweeps imbalances toward 100.370. Meanwhile, the gold market remains bullish, benefiting from the weakening dollar. Traders should watch for further downside in DXY and potential strength in gold FOLLOW FOR MORE INSIGHTS , COMMENT AND BOOST IDEA
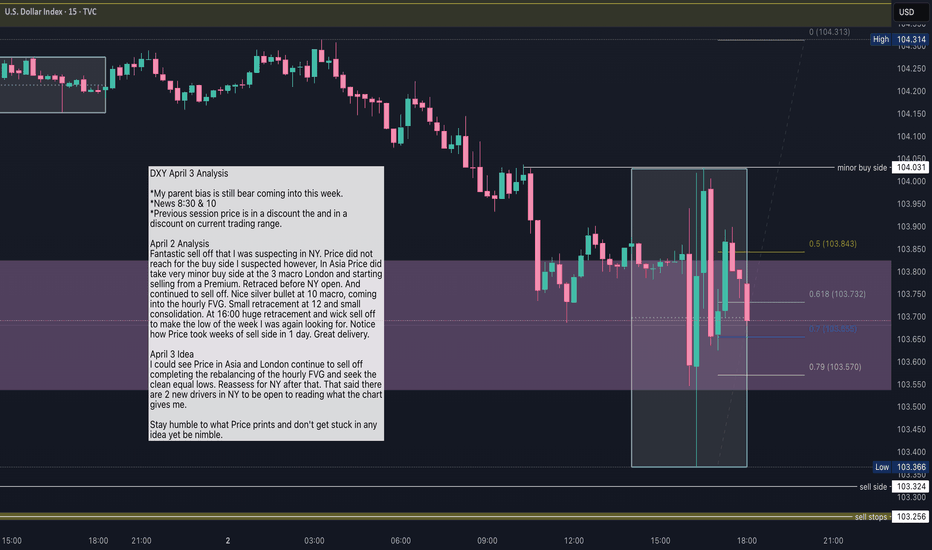
DXY April 3 Analysis DXY April 3 Analysis
*My parent bias is bear
*News 8:30 & 10
*Previous session price is in a discount the and in a discount on current trading range.
April 2 Analysis
Fantastic sell off that I was suspecting in NY. Price did not reach for the buy side I suspected however, In Asia Price did take very minor buy side at the 3 macro London and starting selling from a Premium. Retraced before NY open. And continued to sell off. Nice silver bullet at 10 macro, coming into the hourly FVG. Small retracement at 12 and small consolidation. At 16:00 huge retracement and wick sell off to make the low of the week I was again looking for. Notice how Price took weeks of sell side in 1 day. Great delivery.
April 3 Idea
I could see Price in Asia and London continue to sell off completing the rebalancing of the hourly FVG and seek the clean equal lows. Reassess for NY after that. That said there are 2 new drivers in NY to be open to reading what the chart gives me.
Stay humble to what Price prints and don't get stuck in any idea yet be nimble.
DXY:Expect an uptrend based on the daily chart supportOn Tuesday, the price of the U.S. Dollar Index generally fluctuated in a range. The price reached a daily high of 104.345, a low of 103.99, and closed at 104.19.
Looking back at the performance of the U.S. Dollar Index on Tuesday, after the morning opening, the price initially fell under short-term pressure. Subsequently, it halted its decline and resumed its upward movement above the daily support level, but the overall range was limited. The price rose in a volatile manner, and finally closed with a bullish doji.
From a weekly perspective, continue to focus on the 106.60 level, which is a key level for the medium-term trend. Below this level, the medium-term trend is bearish, and the price increase is temporarily regarded as a correction within the medium-term decline.
Meanwhile, from a daily perspective, temporarily pay attention to the 103.90 level, which is crucial for the wave trend. Above this level, adopt a bullish stance for the wave trend. Also, on the four-hour chart, temporarily focus on the support at the 104.10 area. Therefore, before the price breaks below the low of Monday, bet on an upward movement based on the daily support. Only after a downward break will the trend turn bearish.
Currently, there is a lot of news, so everyone must be cautious of market risks.
Trading Strategy:
buy@103.90-104
TP:104.50-104.80
Get daily trading signals that ensure continuous profits! With an astonishing 90% accuracy rate, I'm the record - holder of an 800% monthly return. Click the link below the article to obtain accurate signals now!
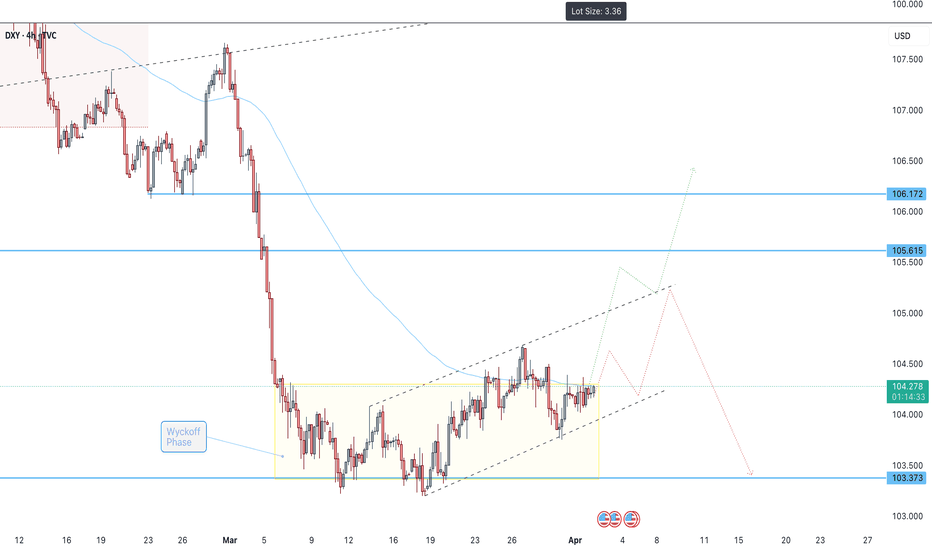
Potential Moves for DXYOn the H4 chart, DXY presents two potential paths. It appears that the bottom is in, as the price is painfully escaping a Wyckoff accumulation phase.
A key level to watch is 105.615, where a gap may need to be filled. Once this level is reached, the next move will depend on the retracement momentum. If bullish strength persists, DXY is likely to continue upward toward the 106.172 resistance level.
The broader market is feeling the impact of DXY’s movements, with all USD pairs experiencing pressure. Given the turbulent nature of exiting a Wyckoff phase, volatility should be expected.
⚠️ Risk Warning: These are my personal views, not financial advice (NFA). Trade carefully.
DXY is bearish, dont fade this move, BUY EURUSD AND GBPUSDI dont really know what the market is waiting for, why it has been ranging this few days but one thing is certain, the move downwards is certain. I will be really suprised if DXY moves up from here.
Dont miss out of this move, I'm begging.
My initial position is still open and I've added more from this point.
Follow me as my trades are market order and not limit orders so you will see and trade it on time
Dollar Index Bullish to $111.350 (UPDATE)The DXY price action from my last video analysis has been moving as we expected & following the arrow accordingly.
We’ve seen a nice dip for the Dollar, a healthy retracement to the downside which should now be followed by the next bull run back up.
Major Wave 5 (Wave Y) en-route to $111.350📈
DeGRAM | DXY continued growthThe DXY is in an ascending channel between the trend lines.
The price is moving from the support level, the lower boundary of the channel and the lower trend line, which has already acted as a rebound point.
The chart has formed a harmonic pattern and successfully held the 50% retracement level.
We expect the growth to continue.
-------------------
Share your opinion in the comments and support the idea with like. Thanks for your support!
DXY Bounces Back: I’m Staying BullishAfter breaking below the 104 support and hitting a low of 103.75, TVC:DXY staged a strong recovery, reclaiming support and signaling a potential false breakout.
The overnight retest of 104 established a higher low, suggesting further upside potential.
As long as 104 holds, I remain bullish and will look to sell EUR/USD and GBP/USD.
DXY April 1 AnalysisDXY April 1 Analysis
*My parent bias is still bear coming into this week.
*News 10
*Previous session price is in a premium and in a discount on current trading range in a consolidation cycle.
Price opened in Asia to the down side taking sell side from last Thursday, creating equal lows, London Price retraced to the 50 level which was my original target and in NY rebalance Fridays FVG closing in consolidation.
I suspected higher prices for the beginning of this week. Great delivery. Today I suspect that Price will come up to take the noted buy side and seek to rebalance the noted FVG, possibly take the noted clean equal highs.
I am bull on this day.
Stay humble to what Price prints and don't get stuck in any idea yet be nimble.
DXY:Seize the opportunity to sell short at high pricesThe situation in the Middle East is clearly deteriorating, which undoubtedly has a huge stimulating effect on the global risk aversion sentiment. More funds have started to seek safe havens. However, the best choice at present is not the US dollar. With the continuous rise of the East, more and more capital will favor this side of the East. Therefore, the pressure on the US dollar index is actually increasing, and it will be very difficult for it to rise.
Regarding the trend of the US dollar index today, although the current situation exerts great pressure, the actions to support the market of the US dollar index still take effect from time to time. So the price will not keep falling, and there will still be some oscillatory patterns. However, even if it moves in an oscillatory pattern, the upward pressure on the US dollar index will be significant. Therefore, when the price reaches the effective resistance level, it will be an excellent opportunity to short the US dollar index.
DXY Trading Strategy:
buy@104.500
TP:103.500
Get daily trading signals that ensure continuous profits! With an astonishing 90% accuracy rate, I'm the record - holder of an 800% monthly return. Click the link below the article to obtain accurate signals now!


