Short Term USD Strength This Week! Sell The Majors?This is the FOREX futures outlook for the week of Jun 8 - 12th.
In this video, we will analyze the following FX markets:
USD Index, EUR, GBP, AUD, NZD, CAD, CHF, and JPY.
USD gained some strength on Friday's job data. Talks with China this week may add to it. But I believe the bullishness will be short term.
Look for valid sells in EUR and GBP. Be cautious with AUD and NZD. CAD and CHF will also offer opportunities to sells.
CPI Data due Wed, making that day and the days that follow potentially the best trading days this week.
Enjoy!
May profits be upon you.
Leave any questions or comments in the comment section.
I appreciate any feedback from my viewers!
Like and/or subscribe if you want more accurate analysis.
Thank you so much!
Disclaimer:
I do not provide personal investment advice and I am not a qualified licensed investment advisor.
All information found here, including any ideas, opinions, views, predictions, forecasts, commentaries, suggestions, expressed or implied herein, are for informational, entertainment or educational purposes only and should not be construed as personal investment advice. While the information provided is believed to be accurate, it may include errors or inaccuracies.
I will not and cannot be held liable for any actions you take as a result of anything you read here.
Conduct your own due diligence, or consult a licensed financial advisor or broker before making any and all investment decisions. Any investments, trades, speculations, or decisions made on the basis of any information found on this channel, expressed or implied herein, are committed at your own risk, financial or otherwise.
DXY trade ideas

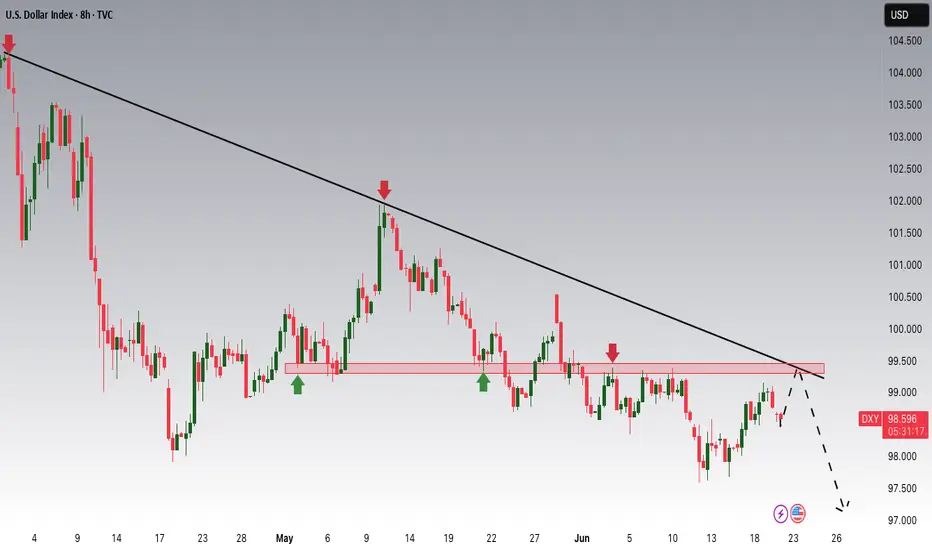
DXYDXY needs some correction and further upside as upside isn't done yet.
Disclosure: We are part of Trade Nation's Influencer program and receive a monthly fee for using their TradingView charts in our analysis.

DOLLAR INDEXThe relationship between the US Dollar Index (DXY) and the 10-year US Treasury yield is generally positive but has shown signs of weakening and occasional breakdowns recently.
Key Points:
Typical Positive Correlation:
Historically, when the 10-year Treasury yield rises, the dollar tends to strengthen, and when yields fall, the dollar weakens. This is because higher yields attract foreign capital seeking better returns, increasing demand for the dollar. Conversely, lower yields reduce dollar appeal.
Mechanism:
The 10-year yield reflects investor expectations about inflation, economic growth, and Federal Reserve policy. Higher yields often signal stronger growth or inflation, supporting a stronger dollar due to higher real returns on US assets.
Recent Weakening of Correlation:
Since early 2025, this positive correlation has weakened significantly. Despite rising 10-year yields (around 4.4% to 4.5%), the DXY has hovered near the 98–99 range and even declined over 10% year-to-date. This divergence is attributed to:
Investors re-evaluating the dollar’s reserve currency status and shifting capital to other markets (e.g., European equities).
Outflows from US assets amid geopolitical and economic uncertainty.
Asynchronous monetary policy cycles globally, with some central banks hiking or cutting rates at different paces than the Fed.
Market Sentiment and Safe-Haven Flows:
In times of stress, the dollar’s traditional role as a safe haven can be challenged, further complicating the yield-dollar relationship.
Conclusion
While the 10-year Treasury yield and the US dollar index usually move together, recent market dynamics have disrupted this pattern. Rising yields have not translated into a stronger dollar in 2025, reflecting broader shifts in investor sentiment, geopolitical risks, and global monetary policy divergence.

Dollar - Slightly Bullish Short Term but overall bearishDollar
Just expressing my feel on the dollar for the coming week

Dollar Index Analysis: Compression, Divergence, Breakout?Greetings to the TradingView community, here's a detailed look at DXY where technical structure and macro context may be hinting at a shift.
Dollar Index (DXY) Approaching Key Breakout | Bullish Divergence and Macro Shifts in Focus
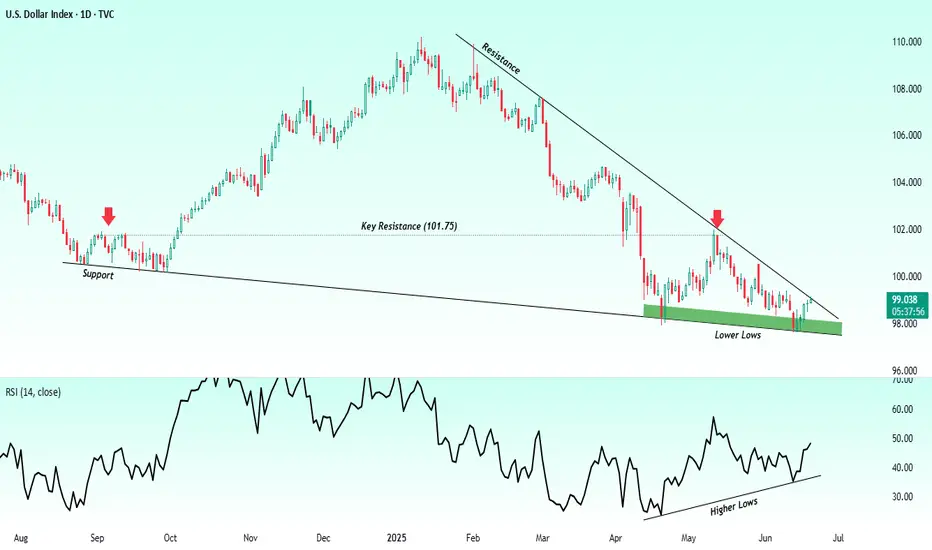
The U.S. Dollar Index (DXY) is currently approaching a structurally important juncture where technical compression is intersecting with potential macroeconomic shifts. Over the past several months, DXY has remained in a well defined downtrend, consistently printing lower highs and lower lows. However, the recent price action reveals signs of exhaustion in bearish momentum, opening the door for a potential trend reversal or a meaningful corrective rally.
Technically the index has been trading within a broad descending wedge pattern since late 2024. This structure, often interpreted as a bullish reversal formation, is now nearing its apex. Price has been hugging the upper boundary of the pattern a descending trendline that has acted as dynamic resistance and appears to be preparing for a possible breakout. Each subsequent test of this trendline has occurred with less momentum on the downside, a common precursor to a breakout when price compresses tightly within narrowing ranges.
More importantly, momentum indicators are beginning to diverge from price. The Relative Strength Index (RSI 14), for instance, is forming a series of higher lows while price continues to record lower lows. This bullish divergence is a classic signal that downside pressure is weakening and that buyers may be gradually absorbing supply. Divergence of this nature, especially in confluence with trendline resistance, often leads to a shift in price behavior.
A key horizontal level to monitor remains 101.75, which has historically acted as a strong resistance zone. This level marked the previous breakout rejection and coincides with the mid-range structure of the wedge. A sustained close above this zone would effectively break the prevailing lower-high formation and could signal a shift in market structure toward a more neutral or even bullish bias.
In terms of projected targets, if a breakout confirms, the logical areas to watch would be the previous swing highs from the downtrend. These include levels in the 102.50 to 104.00 range, where the market has previously paused or reversed. These prior lower highs may now act as resistance on the way up and can be used as checkpoints to gauge the strength of any bullish follow-through.
From a macroeconomic perspective, several factors could support or accelerate such a breakout. Recent U.S. inflation data has shown signs of softening, with both Consumer Price Index (CPI) and Producer Price Index (PPI) prints coming in below expectations. This has increased market speculation that the Federal Reserve may pivot toward a more accommodative stance later in the year. Although the Fed has not confirmed any immediate easing, market expectations around rate cuts are beginning to influence bond yields and, by extension, the dollar.
However, it’s also worth noting that monetary policy divergence among global central banks remains an important theme. While the Fed may lean toward caution, the European Central Bank and the Bank of England are facing their own unique inflationary challenges, which could either reinforce or limit relative dollar weakness. In such an environment, if other central banks appear more dovish than the Fed, it could provide relative strength to the dollar index.
Geopolitical uncertainty and equity market volatility are also important to consider. The dollar has historically acted as a safe-haven asset in times of global distress. If geopolitical tensions escalate or global risk sentiment weakens, capital flows into the dollar may accelerate regardless of interest rate trajectories.
In conclusion, the current DXY setup is a technically rich and macro-sensitive zone where price compression, bullish RSI divergence, and policy shifts are aligning. While confirmation is still needed, particularly via a breakout above the descending trendline and the 101.75 level, the probability of a structural shift is increasing. This setup is not a trading recommendation but rather an important chart to watch for clues about future dollar direction and its cascading impact on global FX pairs, commodities, and broader market sentiment.
Thanks for reading hope you like this publication.
Regards- Amit.
DXY Short Term longAt least that's why the tea leaves say TVC:DXY
RSI positive divergence
Fib support

DXY Potential DownsidesHey Traders, in today's trading session we are monitoring DXY for a selling opportunity around 99.300 zone, DXY is trading in a downtrend and currently is in a correction phase in which it is approaching the trend at 99.300 support and resistance area.
Trade safe, Joe.
DXY Eyes Key Long-Term Support from 2008The U.S. Dollar Index (DXY) is currently trading near three-year lows, reflecting concerns over economic fragility and heightened geopolitical tensions.
If price action holds below 97, the DXY could face additional pressure, potentially descending toward the lower boundary of a long-term channel that has held since the 2008 lows. Key support levels at 96 and 94 may offer potential rebound zones.
Monthly RSI reflects more downside potential towards oversold conditions last seen in 2021. To reverse the current bearish momentum, the index would need to regain and hold above the 100-mark, which could shift sentiment back toward a bullish rebound outlook against the markets.
- Razan Hilal, CMT

DXY; MARKETS JITTERS AND UNCERTAINTIES.The DXY did not hold a successful break above 99.000 which was our bullish signal. Furthermore, we had US banks closed for yesterday's NY session which did not do us any good as there was minimal movements in our charts. Without volatility there is little room for profit chasing as much as our USDJPY signal was on point.
Today's session started with a gap lower towards 98.50. I don't expect a mover lower before filling the gap so that will be our first objective before any further movement. My bias still remains the same ,a clean break and hold above 99.00 will signal a healthier dollar for the short term despite the war tensions.

Bullish bounce?US Dollar Index (DXY) is falling towards the pivot and could bounce to the 1st resistance.
Pivot: 98.48
1st Support: 97.62
1st Resistance: 99.47
Risk Warning:
Trading Forex and CFDs carries a high level of risk to your capital and you should only trade with money you can afford to lose. Trading Forex and CFDs may not be suitable for all investors, so please ensure that you fully understand the risks involved and seek independent advice if necessary.
Disclaimer:
The above opinions given constitute general market commentary, and do not constitute the opinion or advice of IC Markets or any form of personal or investment advice.
Any opinions, news, research, analyses, prices, other information, or links to third-party sites contained on this website are provided on an "as-is" basis, are intended only to be informative, is not an advice nor a recommendation, nor research, or a record of our trading prices, or an offer of, or solicitation for a transaction in any financial instrument and thus should not be treated as such. The information provided does not involve any specific investment objectives, financial situation and needs of any specific person who may receive it. Please be aware, that past performance is not a reliable indicator of future performance and/or results. Past Performance or Forward-looking scenarios based upon the reasonable beliefs of the third-party provider are not a guarantee of future performance. Actual results may differ materially from those anticipated in forward-looking or past performance statements. IC Markets makes no representation or warranty and assumes no liability as to the accuracy or completeness of the information provided, nor any loss arising from any investment based on a recommendation, forecast or any information supplied by any third-party.

DOLLAREXACTLY AS FORECASTED FROM MY WEEKLY DOLLAR CHART,ON STRONG NON-FARM DATA DOLLAR RISE TO KEEP GOING HIGER,GOLD SELL,AUDUSD SELL ,EURUSD SELL GBPUSD SELL.
Average Hourly Earnings m/m
0.3% 0.4% —
Non-Farm Employment Change
147K 111K 139K
Unemployment Rate
4.1% 4.3% 4.2%
Unemployment Claims
233K 240K 236K
Interpretation and Implications
Average Hourly Earnings m/m:
Rose by 0.3%, slightly below the forecast of 0.4%. This suggests wage growth is steady but not accelerating, which may ease some inflation concerns.
Non-Farm Employment Change:
The US economy added 147,000 jobs, beating both the forecast (111K) and the previous month (139K). This indicates continued, though moderate, labor market expansion.
Unemployment Rate:
Fell to 4.1%, better than the expected 4.3% and down from 4.2% previously. This points to a modest improvement in labor market conditions.
Unemployment Claims:
Dropped to 233,000, lower than both the forecast (240K) and last month (236K). This signals fewer new layoffs and continued resilience in the job market.
Market Impact
Dollar (USD):
The combination of stronger-than-expected job growth and a lower unemployment rate is generally supportive for the US dollar, as it suggests the labor market remains robust. However, slightly softer wage growth may temper expectations for aggressive Fed tightening going forward.
Federal Reserve Outlook:
These figures reinforce the Fed’s “data-dependent” stance. Solid job creation and falling unemployment reduce urgency for immediate rate cuts, but the lack of wage acceleration may allow the Fed to maintain a cautious approach.
In summary:
The US labor market in July 2025 shows moderate strength, with job gains and a falling unemployment rate, while wage growth remains steady but not excessive. This mix supports a stable outlook for the dollar and gives the Fed flexibility in its upcoming policy decisions.

DXY: Next Move Is Down! Short!
My dear friends,
Today we will analyse DXY together☺️
The market is at an inflection zone and price has now reached an area around 96.362 where previous reversals or breakouts have occurred.And a price reaction that we are seeing on multiple timeframes here could signal the next move down so we can enter on confirmation, and target the next key level of 96.319..Stop-loss is recommended beyond the inflection zone.
❤️Sending you lots of Love and Hugs❤️

Why I haven't posted this week:Hey all,
So, for those of you who watches my videos and market commentary will have noticed that I haven't posted anything this week, event though there were some awesome opportunities to highlight and discuss.
The reason for this is because I am currently conducting work training and was unable to record, however, rest assured that I'll be back next week to break down these markets with you and take advantage of the opportunities lining up.
Up until then keep well and bye for now

DXY FIREHere on this post, i shared my buy analysis on TVC:DXY , both entry and exits are on the post. see the video for more.

Long-term view for DXY!The current market sentiment isn't favorable for the dollar, but it still presents a good buying opportunity for long-term investors—especially for those looking to purchase USD from exchanges without using leverage or taking on trading risks.

DXY LONG 03/07/2025Here we have the DXY hitting the resistance of a multi-year confirmed tunnel, while the down trend seems very strong, and can break trough some more to the downside, its a good spot to start picking up some UUP stocks, I belive price will eventually break and hit the 93 price mark, will make a double bottom and run back up inside the channel.
Good luck

Dollar Index (DXY) Bearish Trend IntactThe Dollar Index (DXY) cycle, originating from its September 2022 peak, remains incomplete and exhibits a bearish outlook, signaling potential for further declines. The descent from the May 29, 2025 high is currently unfolding as a five-wave impulse pattern. From this high, wave ((i)) concluded at 98.35, followed by a corrective rally in wave ((ii)). The rally formed as an expanded flat, peaking at 99.43 as depicted on the one-hour chart below.
Subsequently, the Index extended lower, forming a nested structure. Within this decline from wave ((ii)), wave i bottomed at 97.7, with a corrective wave ii rally reaching 98.2. Wave iii then drove the Index lower to 97, followed by wave iv peaking at 97.49. The final leg, wave v, completed at 96.37, marking the end of wave (i). Currently, a corrective rally in wave (ii) is underway, aiming to retrace the decline from the June 23, 2025 peak. This rally appears to be unfolding as a zigzag pattern, with wave a concluding at 97.15 and wave b dipping to 96.69. Wave c is expected to target the 100%–161.8% Fibonacci extension of wave a, projecting a range of 97.45–97.9.
Should the Index reach this zone, it may encounter selling pressure, potentially leading to further downside or a three-wave pullback. As long as the pivot high at 99.4 remains intact, any rally is likely to falter in a 3, 7, or 11-swing structure, reinforcing the bearish bias for additional declines.

A Dollar in Freefall and a Bitcoin on the Brink
In the grand theater of global finance, narratives rarely align with perfect symmetry. The market is a complex ecosystem of competing forces, a cacophony of signals where long-term tectonic shifts can be momentarily drowned out by the piercing alarms of short-term volatility. Today, we stand at the precipice of one of the most profound and fascinating divergences in modern financial history, a story of two assets locked in an inverse dance, each telling a radically different tale about the immediate future.
On one side of this chasm stands the titan of the old world, the U.S. Dollar. The bedrock of global commerce, the world’s undisputed reserve currency for nearly a century, is in a state of unprecedented crisis. The U.S. Dollar Index (DXY), the globally recognized measure of the greenback’s strength against a basket of other major currencies, is in freefall. It is suffering its most catastrophic crash since 1991, and by some measures, is enduring its worst year since the historic turmoil of 1973. This is not a minor correction; it is a fundamental challenge to the dollar’s hegemony, a macro-level event driven by seismic shifts in U.S. economic policy, including aggressive trade tariffs and ballooning government deficits. For the world of alternative assets, a collapsing dollar is the loudest possible bullhorn, a clarion call to seek refuge in stores of value that lie beyond the reach of any single government.
On the other side of the chasm is the digital challenger, Bitcoin. Born from the ashes of the 2008 financial crisis as an answer to the very monetary debasement the dollar is now experiencing, Bitcoin should, by all fundamental logic, be soaring. The dollar’s demise is the very thesis upon which Bitcoin’s value proposition is built. And yet, while the long-term case has never looked stronger, the short-term picture is fraught with peril. A close reading of its technical chart reveals a market showing signs of exhaustion. A key momentum indicator, the stochastic oscillator, is flashing a stark warning, suggesting that the digital asset, far from rocketing to new highs, could be on the verge of a significant drop, a painful correction that could pull its price back below the psychological threshold of $100,000.
This is the great divergence. The macro-economic landscape is screaming for a flight to safety into hard assets like Bitcoin, while the micro-level technicals of Bitcoin itself are suggesting an imminent storm. It is a battle between the long-term fundamental signal and the short-term technical noise, a dilemma that forces every market participant to ask themselves a critical question: In a world where the old rules are breaking down, do you trust the map or the compass?
Chapter 1: The Fall of a Titan - Deconstructing the Dollar's Demise
To understand the magnitude of Bitcoin’s long-term promise, one must first dissect the anatomy of the dollar’s current collapse. The U.S. Dollar Index, or DXY, is not merely a measure of the dollar against a single currency; it is a weighted average of its value relative to a basket of six major world currencies: the Euro, the Japanese Yen, the British Pound, the Canadian Dollar, the Swedish Krona, and the Swiss Franc. Its movement is a reflection of global confidence in the U.S. economy and its stewardship. For this index to suffer its worst crash since 1991 is a historic event. To be on pace for its worst year since 1973 is a paradigm-shifting crisis.
The year 1973 is not a random benchmark. It was the year the Bretton Woods system, which had pegged global currencies to the U.S. dollar (which was in turn pegged to gold), officially died. Its collapse ushered in the modern era of free-floating fiat currencies. For the dollar’s current performance to be compared to that chaotic, system-altering period is to say that the very foundations of the post-1973 monetary order are being shaken.
The catalysts for this historic weakness are rooted in a dramatic shift in American economic policy, largely attributed to the actions of President Donald Trump’s administration. The two primary drivers are a protectionist trade policy and a fiscal policy of burgeoning deficits.
First, the tariffs. The implementation of broad tariffs on imported goods was intended to protect domestic industries and renegotiate trade relationships. However, such measures are a double-edged sword for a nation's currency. They create friction in the intricate web of global supply chains, increase costs for consumers and businesses, and often invite retaliatory tariffs from trading partners. This environment of trade conflict creates economic uncertainty, which can deter foreign investment. When international capital becomes wary of deploying in a country, demand for that country’s currency wanes, putting downward pressure on its value.
Second, and perhaps more fundamentally, are the rising deficits. The U.S. government has been running massive budget deficits, spending far more than it collects in revenue. This debt must be financed. When a country runs a large budget deficit alongside a large current account deficit (importing more than it exports), it becomes heavily reliant on foreign capital to purchase its government bonds. If the world’s appetite for that debt falters, or if the sheer volume of new debt issuance becomes too large to absorb, the nation’s central bank may be implicitly forced to monetize the debt—effectively printing new money to buy the bonds. This expansion of the money supply is the classic recipe for currency debasement.
The combination of trade protectionism and fiscal profligacy has created a perfect storm for the dollar. Global investors, looking at the rising deficits and the unpredictable trade environment, are beginning to question the long-term stability of the dollar as a store of value. This erosion of confidence is what is reflected in the DXY’s historic plunge. A weaker dollar makes U.S. exports cheaper and imports more expensive, but its most profound effect is on the global investment landscape. It forces a worldwide repricing of assets and sends a tidal wave of capital searching for alternatives that can preserve wealth in an era of fiat decay.
Chapter 2: The Digital Phoenix - Bitcoin's Long-Term Bull Case
In the world of finance, every action has an equal and opposite reaction. As the value of the world's primary reserve asset erodes, the value of its antithesis should, in theory, appreciate. Bitcoin is the dollar’s antithesis. Where the dollar’s supply is infinite and subject to the political whims of policymakers, Bitcoin’s supply is finite, transparent, and governed by immutable code. There will only ever be 21 million Bitcoin. This fundamental, mathematically enforced scarcity is the core of its value proposition.
The inverse correlation between the DXY and Bitcoin is one of the most powerful and intuitive relationships in the digital asset space. When the DXY falls, it signifies that the dollar is losing purchasing power relative to other major currencies. For investors around the globe, this means that holding dollars is a losing proposition. They begin to seek out assets that are not denominated in dollars and cannot be debased by the U.S. Federal Reserve. Bitcoin stands as the prime candidate for this capital flight. It is a non-sovereign, globally accessible, digital store of value that operates outside the traditional financial system. A falling dollar is therefore the strongest possible tailwind for Bitcoin, validating its very reason for existence.
This relationship transcends simple price mechanics; it is a philosophical and macroeconomic hedge. Owning Bitcoin is a bet against the long-term viability of the current debt-based fiat monetary system. The dollar’s crash, driven by deficits and monetary expansion, is not a flaw in the system; it is a feature of it. Bitcoin offers an escape hatch. It is a lifeboat for investors who see the iceberg of sovereign debt on the horizon.
This narrative is what has fueled the wave of institutional adoption that has defined the current market cycle. Sophisticated investors and corporations are not allocating to Bitcoin because they are speculating on short-term price movements. They are buying it as a long-term strategic reserve asset, a hedge against the very macroeconomic turmoil that the dollar’s crash represents. They see a world drowning in debt and a global reserve currency being actively devalued, and they are making a calculated, multi-generational bet on a system of verifiable digital scarcity. From this perspective, the long-term bull case for Bitcoin has never been clearer or more compelling. The dollar’s historic weakness is the ultimate validation of the Bitcoin thesis.
Chapter 3: The Ghost in the Machine - Bitcoin's Short-Term Technical Warning
If the story ended with the macro-economic picture, the path forward would be simple. But markets are not simple. They are a reflection of human psychology, a tapestry of fear and greed woven in real-time. While the fundamental, long-term story points resolutely upward, the short-term evidence, as read through the language of technical analysis, is painting a much darker picture.
Technical analysis operates on the principle that all known information, including the bullish macro fundamentals, is already reflected in an asset's price. It seeks to identify patterns and gauge market momentum to predict future movements. One of the most trusted tools for measuring momentum is the stochastic oscillator. It does not measure price or volume itself, but rather the speed and momentum of price changes. Think of it like a car's tachometer: it tells you not how fast you are going, but how hard the engine is working to maintain that speed.
The stochastic oscillator operates on a scale of 0 to 100. A reading above 80 is considered "overbought," suggesting the asset has moved up too quickly and the rally may be running out of steam. A reading below 20 is considered "oversold," suggesting a decline may be exhausted. The current technical analysis of Bitcoin’s chart reveals a deeply concerning signal from this indicator.
Despite the overwhelmingly bullish news of the dollar’s collapse, Bitcoin’s price momentum is reportedly waning. The stochastic oscillator is likely showing what is known as a "bearish divergence." This occurs when the price of an asset pushes to a new high, but the oscillator fails to do so, creating a lower high. This is a classic warning sign. It’s the market’s equivalent of a car’s engine sputtering and revving less intensely even as the driver pushes the accelerator to the floor. It suggests that the underlying buying pressure is weakening, that the rally is becoming exhausted, and that a reversal or significant correction may be imminent.
The technical forecast of a potential drop below the $100,000 level stems directly from this type of signal. It implies that the recent price strength is not supported by genuine momentum and that the market is vulnerable. Why would this happen when the fundamental news is so positive? There are several possibilities. Short-term traders who bought at lower prices may be taking profits. The market may be flushing out over-leveraged long positions, triggering a cascade of liquidations. Or, it could simply be the natural rhythm of a market. No asset moves up in a straight line. Even the most powerful bull trends require periods of consolidation and correction to shake out weak hands, build a stronger base of support, and gather energy for the next major advance. A pullback to below $100,000, while painful for those who bought at the top, could be a perfectly healthy and necessary event in the context of a much larger, multi-year bull market.
Chapter 4: Reconciling the Irreconcilable - The Investor's Dilemma
This great divergence presents every market participant with a profound dilemma, forcing a clear-eyed assessment of their own investment philosophy and time horizon. The market is speaking in two different languages simultaneously, and the message you hear depends on the language you choose to listen to.
For the long-term investor, the individual or institution with a five, ten, or twenty-year outlook, the story is clear. The historic crash of the U.S. dollar is the signal. It is the fundamental, world-altering event that confirms their thesis. The debasement of the world’s reserve currency is a generational opportunity to allocate capital to a superior, non-sovereign store of value. From this vantage point, the bearish reading on a short-term stochastic oscillator is, at best, irrelevant noise. It is the momentary turbulence felt on a flight destined for a much higher altitude. The strategy for this investor is one of conviction. They may choose to ignore the short-term dip entirely, or more likely, view it as a gift—a final opportunity to accumulate more of a scarce asset at a discount before the full force of the dollar’s crisis is felt in the market. Their actions are guided by the macro map, not the short-term compass.
For the short-term trader, the world looks entirely different. Their time horizon is measured in days, weeks, or months, not years. For them, the bearish divergence on the stochastic oscillator is the signal. The macro story of the dollar’s decline is merely the background context. Their primary concern is managing risk and capitalizing on immediate price swings. A warning of a potential drop below $100,000 is an actionable piece of intelligence. It might prompt them to take profits on existing long positions, hedge their portfolio with derivatives, or even initiate a short position to profit from the anticipated decline. Their survival depends on their ability to react to the compass of market momentum, regardless of the map’s ultimate destination.
The most sophisticated market participants, however, attempt to synthesize these two perspectives. They recognize that the long-term macro trend provides the overarching directional bias, while the short-term technicals provide the tactical roadmap for navigating that trend. Such an investor would maintain a core long position in Bitcoin, acknowledging the powerful tailwind of the dollar’s collapse. However, they would use the technical signals to actively manage their position and optimize their entries and exits. They might trim their position when the stochastic indicator signals overbought conditions, taking some profit off the table to reduce risk. They would then stand ready to redeploy that capital and add to their core holding when the technicals signal oversold conditions after the very correction they anticipated. This approach allows them to maintain their long-term conviction while respecting the short-term risks, blending the art of the trader with the discipline of the investor.
Conclusion: The Signal and the Noise
The financial markets are standing at a historic crossroads. The U.S. dollar, the sun around which the global monetary system has orbited for generations, is dimming. Its historic crash is a signal of the highest order, a fundamental warning that the era of unchallenged fiat dominance is facing its most serious test. This decay is creating a powerful gravitational pull toward assets defined by scarcity and sovereignty, with Bitcoin as the undisputed digital leader. This is the signal.
Simultaneously, the internal mechanics of the Bitcoin market are showing signs of short-term fatigue. The warnings from technical indicators like the stochastic oscillator are a reminder that no market is immune to the laws of gravity, that periods of profit-taking and consolidation are a natural and healthy part of any long-term advance. This is the noise.
The great challenge, and the great opportunity, for every investor today is to learn to distinguish between the two. The collapse of the dollar is a paradigm shift, while the potential drop in Bitcoin’s price is a cyclical correction. The former defines the destination; the latter describes the terrain along the way. The current divergence is a test of thesis, of timeframe, and of temperament. Those who are shaken out by the short-term noise will likely miss the long-term signal. But those who understand that the dollar’s fall is the very reason for Bitcoin’s rise, and who have the conviction to see the short-term turbulence for what it is, will be best positioned to navigate this great divergence and witness the dawn of a new financial landscape.

The Bessent Effect Explained: Weaken the Dollar The Bessent Effect Explained: Weaken the Dollar
There’s no coincidence that the U.S. dollar has had its worst first half of the year since the dawn of free-floating currencies in the 1970s. And if anyone knows how currencies tick — or unravel — it’s Scott Bessent, the man who once stood behind George Soros during the legendary short of the British pound in 1992. Now, three decades later, Bessent sits at the helm of the most powerful economy in the world, steering the U.S. Treasury through a historic moment: where America is trying to boost exports, undercut foreign currency manipulation, and lighten the crushing weight of debt — all while keeping inflation from boiling over.
Of course, no Treasury Secretary will ever say “we want a weaker dollar”, but if one wanted to do it strategically, they'd need to be part economist, part hedge fund manager and part illusionist.
Enter: The Bessent Effect.
📊 Charting the Decline
• After Election Day (BLUE LINE), the DXY marched upward, peaking near 109 — a reflection of market optimism or a dash of geopolitical anxiety.
• By Inauguration Day (REDLINE), that trend began to unwind. Investors started to squint at the fiscal roadmap and didn't love what they saw.
________________________________________
Debt Strategy Rhetoric: PURPLE LINE
In early February, Treasury Secretary Scott Bessent addressed the U.S. debt issuance strategy. While he openly criticized his predecessor’s reliance on short-term debt, his first major move was paradoxical: he continued that very approach, opting to maintain a heavy focus on short-term issuance while holding off on extending maturities. This subtle decision screamed one thing for markets: rollover risk. What if rates stay high? What if inflation persists? What if buyers disappear?
Result? The dollar started sliding faster.
________________________________________
Liberation Day: YELLOW LINE
On April 2, “Liberation Day” tariffs were announced. Potential retaliation from China and Mexico, and now you've got cross-border chaos. Trade wars spook global markets, slash demand for U.S. assets, and drive capital into gold and foreign currencies. The dollar’s dominance doesn’t vanish overnight — but the cracks begin to show.
________________________________________
Easing of SLR Announced: PINK LINE
On May 23, just when the DXY needed a break, Bessent went on Bloomberg and said, “We are very close to moving” on the Supplementary Leverage Ratio (SLR). Translation? Banks may soon face eased capital rules, making it easier for them to buy Treasuries.
Markets took it as regulatory backdoor stimulus — a shadowy workaround to support Treasury demand without triggering money printers. But it also raised fears about systemic risk, inflation, and policy overreach. The DXY barely blinked before continuing its methodical march lower.
________________________________________
But What If...
What if Bessent’s moves aren’t missteps, but part of a calculated devaluation strategy? A weaker dollar makes U.S. exports more competitive, revives domestic manufacturing, and reshapes global trade dynamics. By subtly bending the rules (instead of breaking them), Bessent may be re-engineering the dollar's role—less as a global anchor, more as a tool for national advantage. By easing the SLR, he may have discovered a subtle way to bring down the long end of the yield curve.
If it’s not currency destruction. Maybe it’s precision macro strategy?
________________________________________
What’s Next?
Sure, the DXY might bounce a little — even bad news needs a break. But what could drive it even lower?
How about the loss of Federal Reserve independence?
Luckily, that’d only happen if there were whispers of a “shadow Fed chair” waiting in the wings. But that’s just conspiracy talk... right?
Follow on X: @TheAlphaView

Possibility of correction Given the behavior of the indicator within the current resistance range, possible scenarios have been identified. If the resistance range is broken, an upward and fluctuating trend to the red resistance range is likely.

just slightly kidding, yes or no DXY MONTHLYjust slightly kidding, yes or no DXY MONTHLY\
bullish. so very bullish
let us know!
free transparent no edit no delete
🐉We value full transparency. All wins and fails fully publicized, zero edit, zero delete, zero fakes.🐉
🐉Check out our socials for some nice insights.🐉
information created and published doesn't constitute investment advice!
NOT financial advice

DXY UpdateAs expected the dollar has decreased in value over the past couple weeks as seen with my earlier post
We have come to a key level here for the dollar. FX tends to move in prolonged waves of price increases and decreases so this could potentially be the be the start of a prolonged decline

U.S. dollar index DXY analysis- daily time frame ✅ U.S. Dollar Index (DXY) Analysis — Daily Timeframe
👤 A TVC:DXY trader’s perspective:
When I look at this chart, several key points immediately stand out:
1️⃣ Long-Term Trend
On the weekly and daily timeframe, the major trend has turned bearish after peaking around 114. We see a clear series of lower highs and lower lows confirming the downtrend.
The sharp rally from 89 to 114 in the past was a strong impulsive move, which is now undergoing a deep correction. Currently, price is hovering around a major historical support near 96.
2️⃣ Key Support Zone
The current price near 96.7 is sitting right at a significant support area that has triggered considerable buying interest in the past.
If this support decisively breaks, the green zone marked as DD (around 93–95) represents a strong long-term demand zone and will likely be the next liquidity target for buyers.
3️⃣ Resistance (Supply Zones)
The four red-marked 4HR zones between 97 and 101.9 clearly show significant supply zones where sellers have stepped in on lower timeframes.
Should the price attempt a bounce from current levels, these resistance areas may act as a strong barrier to further upside.
4️⃣ Price Structure and Liquidity
Looking more closely, the market seems to be moving from a consolidation phase toward lower support liquidity. That means there is a high probability of a liquidity grab toward the 93–95 area before a potential fresh bullish leg.
At higher levels, unless the price can break and hold above 98 and then 100, we cannot confirm a trend reversal.
🔹 Summary
✅ Overall downtrend remains dominant
✅ 96–97 is a critical support zone
✅ A break below this support targets 93–95
✅ Trend reversal only possible with a confirmed break and hold above 98, and then 100–101
✅ The 4HR resistance zones (97–101) are strong hurdles for any bullish retracement
✅ As long as price remains below 98, any rally is likely just a corrective move
⚠️ Disclaimer: This analysis is for educational and informational purposes only and does not constitute financial advice or a recommendation to buy or sell. All trading decisions are solely your own responsibility.
