DXY at the Crossroads: How the 108–110 could reshape the market
Key Highlights
The U.S. Dollar Index TVC:DXY is currently near an important resistance level of 108–110.
A potential reversal of the dollar at this level could lead to further growth in stock markets and strengthen cryptocurrencies, while a break above 110+ would continue to put pressure on risk assets.
If CAPITALCOM:DXY surpasses 110 and holds above it, there is a possibility of reaching as high as the 120 mark. A rejection from the 108–110 zone would indicate a downward trend developing, possibly pushing the index toward the 98 area or lower.
Future outcomes will depend on Federal Reserve monetary policy, global demand for the dollar and other safe-haven assets, as well as overall economic stability.
What about crypto?
There are serious risks for CRYPTOCAP:TOTAL2 CRYPTOCAP:TOTAL3 & CRYPTOCAP:OTHERS
A long-term perspective on ICEUS:DXY suggests that “alt seasons” tend to occur during periods of dollar weakness. Currently, the 108–110 zone and the MA50-W are pivotal. A potential DXY reversal here may act as a catalyst for another major altcoin rally in the coming months, while continued dollar strength could postpone any such “alt season.”
Shaka
DXY trade ideas

USXUSD LOTWUSXUSD LOTW Potentially In.
H1 BOS confirms this for me. Targeting H4 Internal Liquidity & Daily FVG.
Let's see.

Tariffs your time is up!
Tariff pauses are ending on July 9th. Even if expected deals aren't reach, it's expect that we won't pause again. Expecting the dollar to regain strength into this date.

DXY Game Plan - USD IndexIt is important to watch the DXY to understand the strength of the USD across global markets.
The DXY is a key index that reflects the U.S. dollar’s dominance in foreign exchange. Therefore, tracking it can provide valuable insights into the potential direction of all major asset classes.
In this post, I’ll break down both technical and fundamental expectations.
Technical Analysis
DXY has been in a retracement phase (bearish) since January 2025. During this time, we’ve seen EUR and other major forex pairs form strong bullish trends.
Currently, the DXY is approaching a weekly bullish trendline, where I expect a potential bounce.
Additionally, DXY is trading within a discount zone (below the 0.5 Fibonacci level, also known as equilibrium). Personally, I’m watching for a deeper move into the maximum discount zone (around the 0.75 Fib level).
This area also aligns with key liquidity concepts. Ideally, I want to see a deviation below the bullish trendline, with a sweep of one of the weekly liquidity levels marked on the chart (two black horizontal lines).
I'm not relying on a clean triangle trendline retest, but it's a possibility.
Game Plan
DXY taps the bullish trendline
Deviates below it, running weekly liquidity (black lines)
Hits the max discount zone (~0.75 Fib)
Then shows signs of reversal and strength
Once that setup completes, I’ll be expecting strong USD performance, and will look to short risk assets — including stocks and major forex pairs.
Fundamental Analysis
The Federal Reserve is currently resisting pressure to cut interest rates, while Trump is vocally pushing for rate cuts.
The market is already pricing in a 79% probability of a September rate cut (source: CME FedWatch Tool), so if that happens as expected, I don’t anticipate major market reaction.
However, a surprise rate cut in July would likely trigger a flash crash in DXY/USD — though based on my game plan, I would expect a V-shaped recovery shortly afterward.
EUR, GBP, AUD, and CAD have also hit key resistance zones, so I believe we're likely to see USD strength for a while.

Weekly Outlook. Dollar Strength🗓 Economic Outlook – 2025-06-30 💹 RSI Divergence and Dollar Strength 🟢 Summary
A bearish divergence in the RSI combined with strong U.S. fundamentals suggests continued upward pressure on the Dollar Index (DXY). This trend may persist, particularly if upcoming economic data supports current expectations. 📊 Technical Insight
RSI Divergence Observed
On the DXY chart, we observe a hidden bullish divergence in the RSI, where price makes a higher low while RSI makes a lower low.
This pattern suggests potential continuation of the uptrend despite short-term corrections.
🧮 Fundamental Overview
ADP Employment Report (Wednesday)
Expected stronger results could support the dollar’s bullish trend through next week.
Watch for surprise upside in employment numbers.
NFP Index
Currently above 100, indicating a healthy U.S. economy.
Even if it reaches 120 as expected, the impact may be muted due to prior pricing-in by the market.
"I try to share an overview of the data a day in advance to give you a general perspective."
🔴Remember, the long-term outlook for the dollar is bearish.🔴

DXY: Local Bullish Bias! Long!
My dear friends,
Today we will analyse DXY together☺️
The market is at an inflection zone and price has now reached an area around 96.706 where previous reversals or breakouts have occurred.And a price reaction that we are seeing on multiple timeframes here could signal the next move up so we can enter on confirmation, and target the next key level of 96.819.Stop-loss is recommended beyond the inflection zone.
❤️Sending you lots of Love and Hugs❤️

DXY RANGING Today we see DXY in a ranging phase after seeing a BOS on the H4 timeframe
Expecting retracement to the upside
Pairs to watch out for
Euro Dollar and the Pound Dollar
OANDA:EURUSD OANDA:GBPUSD
OANDA:AUDUSD OANDA:NZDUSD

Bullish on EURUSD till Q1 2026Looking at the chart, I remained bullish on the Euro dollars for the mid term.
Those who followed , would have made some good profits.
Any pullback on EURUSD remains a good entry to accumulate.
As usual, please DYODD

DXY - 4H - UPDATEBears tried again on Friday but buyers stepped in and defended the low.
What's next?
If DXY can hold the price above Friday's low, it may set up a bounce.
The R/R is quite attractive. I will keep it on my radar for a potential trade tomorrow.

DXY JUNE DELIVERY NOTES & NFP week aheadDXY
JUNE DELIVERY NOTES
*June was a distribution candle rebalancing a BISI from March 2022
*daily chart shows price consolidate beginning of June, then mid month breaking to lower prices taking key equal lows, third week price retraces to make a 1 pip high, last week a trending sell off cycle to close the month
*Price is a discount parent range- anticipating a pull back this week for NFP
*Monthly price has broken structure and expecting it to gravitate to the .70 level 96.672 and rebalance the volume imbalance from Feb 2022 for the next coming weeks target ideas
*4 hour chart shows price in a consolidation Thursday and Friday-expansion expected Monday
June 27 DELIVERY
*Price opens in Asia in a expansion cycle to take minor buy side and create a wall of equal highs
*21:00 retraces creates equal lows
*0:00 price takes minor equal highs
*2 London macro price rallies for my suspected equal lows target
*3 macro small retrace of delivery
*7 macro price fake swing to equal lows -creates a wall of equal lows
*9 macro price rallies for equal highs
*13:00 price expands to take session buy stops
*closes retracing to the 50 level
JUNE 30 IDEAS
*I suspect for Sunday's delivery to take minor equal lows possibly the equal lows for a deep discount set up for a buy day- Monday
*last liquidity Friday buy side
*Price is in a deep discount over sold is my thought with the sell off we saw Monday through to Wednesday we could see Price retrace to the 50 level 98.204 for this weeks pull back?
*NFP week ahead parent bias is KING and we are still bear on this pair

DXY This week on DXY we can see shift from last week longs to short this week based on big institutions smart money. So more bearish expected throughout the week.

Make US(and USD) weak again, and short DXY 99,358Hey traders, this is a fundamentally and technically based idea. I´m expecting a weakening of USD due to actual US goverment policy. Important weekly lenel 100,600 was broken and holding. If you decide to trade this idea, you can enter now at current price 99,358 and hold till profit lines. TP your trade partially. You can consider averaging at 100,600 instead of cutloss after the reaction. Wish you good luck.

TIME FOR THE DOLLAR TO STRENGTHEN OR FURTHER WEAKNESS.So what are we lookin at? We have been looking at the weakest price in dollar yet.Yesterday we tested the yearly lows at 97.700 which we are using as current baseline. I will mark up that price range to use as our support. Geopolitical tensions are cooling off as Trump called for ceasefire between the two war torn nations but we still have lots of economic data flowing in. Most attention fall towards Fed chair Powell speech as this will shape up the direction of the dollar going forward as we head to a new month. Correction higher means USDJPY will rise as we are having a steady Yen currency. We saw the dollar fail to hold above 99.300 which is our nearest resistance level marked by a horizontal ray.So focus is on those two price levels so as to enable us find opportunities to trade.

24th JuneTA: Many confluences for a bearish bias. Only confirmation needed for high probability price action is running (closing below 4H SL) on 1H. We have to exercise some caution, because price is still in the area of the monthly sweep. For a trade PA has to give us optimal behaviour.
News: Powell testifies at 10:00am. This could lead to a very quick move below the swept monthly low.

Price action Since the dxy failed to make a lower low and failed to break below but above this is a scenario that might play out
Dollar Back to bearishAmazing run on the liqudity I outlined over the weekend. We literally stabbed through with a few pips and massive rejection. This is all war related but you see how these levels get appreciated all the time.
Insane rejection after taking the liquidity

EUR/USD Macro Structure | Don’t Miss the Cycle ShiftAfter reviewing the 12M, 2M, and currency indexes — this isn’t just a bounce, it’s a potential macro reversal.
EUR/USD (2M Chart)
We’ve now got two Morning Star Dojis followed by a bullish engulfing — price is climbing steadily toward 1.16319 (neckline zone). If we break and retest clean, 1.25560 becomes a high-probability target. I view this as the neckline of a multi-year W-formation.
💶EUR Index (16D Chart)
The breakout has already occurred. Retest is happening now around the 1.057 zone. Fibonacci structure supports continuation, and volume confirms strength. If momentum holds, 1.085 – 1.130+ are valid extensions.
💵 USD Index (DXY - 16D Chart)
Meanwhile, the dollar is breaking down from a neckline around 98. If the 97–98 range gives way, we may revisit 88.253, confirming a shift in USD dominance.
🌐 Fundamental Alignment:
The Eurozone is pushing hard for digital transformation, with the ECB advancing legislation on the digital euro. Christine Lagarde has been vocal about blockchain innovation — and XRP’s involvement in cross-border integration is no coincidence.
🎯 Key Price Levels:
1.16319: Neckline (retest zone)
1.25560: Mid-term target
1.60195: Macro expansion (long-term, structure-dependent)
📌 I encourage all traders to zoom out and track structure across multiple timeframes. Sometimes the past holds clues to the future.

DXY: Target Is Up! Long!
My dear friends,
Today we will analyse DXY together☺️
The price is near a wide key level
and the pair is approaching a significant decision level of 98.274 Therefore, a strong bullish reaction here could determine the next move up.We will watch for a confirmation candle, and then target the next key level of 98.606 .Recommend Stop-loss is beyond the current level.
❤️Sending you lots of Love and Hugs❤️

USXUSD HOTW SetUSXUSD HOTW Set
Lower prices for DXY.
Everyone and their mum think DXY will surge because of USA vs Iran, perfect time to sell DXY.
H4 Close like this confirms this idea for me.
Let's see...

DXYThis US dollar index is going a little down before continuing going up. Since there are gaps to be filled.

What to Expect From FOMC and the Market’s Reaction to It? With tariffs and Middle East escalation in focus, central banks have somewhat fallen to the backstage recently. But today’s FOMC meeting might change that. The federal funds rate upper band is most likely to stay at 4.50% with a unanimous vote. However, today’s focus will not be on the interest rate itself but rather on the dot plot and updated economic forecasts.
Inflation continues to move closer to the 2% target, but that trend may have shifted with the latest CPI report. Although recent inflation data came in better than expected, inflation appears to be flattening above 2% and could start rising again in the near future. Last week’s CPI and Core CPI reports showed early signs of this, and the upcoming PCE and Core PCE data could confirm those signals. Why is inflation still low despite tariffs? The main reason is frontloading.
U.S. consumers and firms frontloaded many goods, especially durable good, ahead of the tariff hikes. Now, with tariffs in effect, consumption has slowed, and many firms are holding elevated inventory levels. In this environment, firms are reluctant to raise prices due to lower demand and high stockpiles. This suppressive effect is expected to gradually fade, allowing prices to rise. For that reason, the Fed is unlikely to begin rate cuts prematurely. Inflation could make a peak in the last quarter of 2025 or the first quarter of 2026 in our view. But the possible oil price spike due to Iran – Israel war could change this projection.
At the March FOMC meeting when the economic projections were last updated, some of the tariff impacts were already incorporated. Inflation and unemployment were revised higher, while GDP was revised lower. Despite this, the Fed maintained its forecast of two rate cuts for both 2025 and 2026. However, since March, newly announced tariffs have been more extensive than expected. Some board members including Jerome Powell stated that. As a result, a similar adjustment to the forecasts may occur today: higher inflation and unemployment, lower GDP. Accordingly, the dot plot could show only one rate cut for 2025 and three for 2026. Why would the Fed cut more in 2026? Because the tariff impact is expected to be a one-time shock, not a structural shift. Once the effects wear off, the Fed could ease more. But there are some risks to that. According to some new research and New York FED President Williams, not only long term inflation expectations needs to be anchored, rather the “whole curve” So during a possible inflation peak came with tariff effects, FED could not cut repeatedly and should closely watch the effects on short-term inflation expectations.
The main focus of today’s FOMC will be on the economic forecasts and the dot plot. If the new projections reflect only one cut for 2025, this would be bullish for the dollar. If the 2026 projection also shows only two cuts, that would be even more bullish. On the other hand, if the current forecast of two cuts in both 2025 and 2026 remains unchanged, the reaction could be slightly dovish for the dollar.
During the post-meeting press conference, Chair Powell is likely to focus on uncertainties related to tariffs and energy prices, especially given the rising geopolitical tensions in the Middle East. Powell may downplay the hawkish tone of the dot plot during the conference, potentially reducing the overall market impact.
With all this in mind, the dollar index could either break out of the descending wedge formation on the hourly chart or continue drifting toward the lower boundary. Holding above the 99 level could be key for short-term price action.

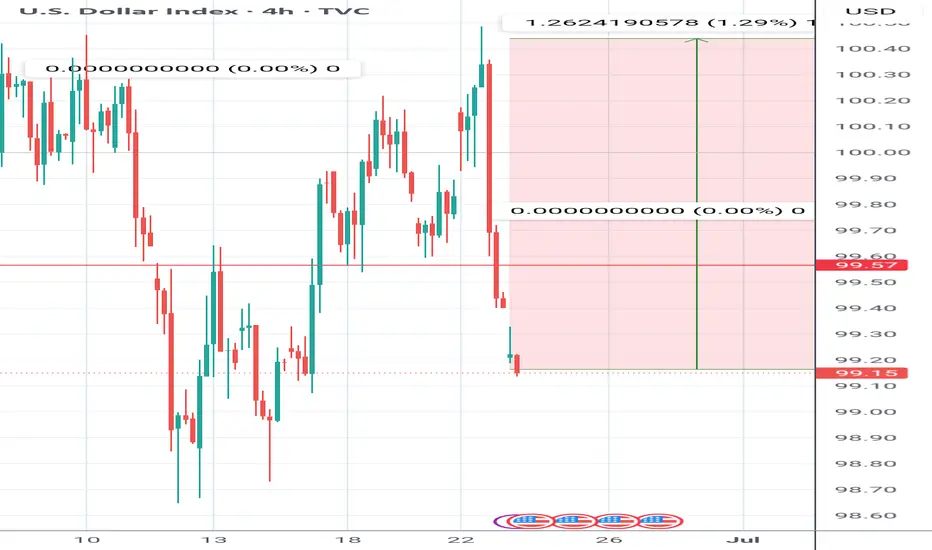
Cup of the Morning for DXYThe TVC:DXY seems to be forming a Cup and Handle Pattern on the 1Hr Chart!
Cup and Handle pattern is considered a strong Reversal Pattern where we should expect Bullishness for the USD.
After the 2nd or Equal High to the 1st was formed, Price made a Retracement to the 38.2% Fibonacci level and found Support to the begin forming the "Handle" or Consolidation Phase of the Pattern.
Price must Break and Close above the "Brim" or Equal Highs of the Cup @ 99.113 to Confirm the pattern!
Once confirmed, we can then look for price on DXY to rise up to the next level of Resistance in the 99.6 area!

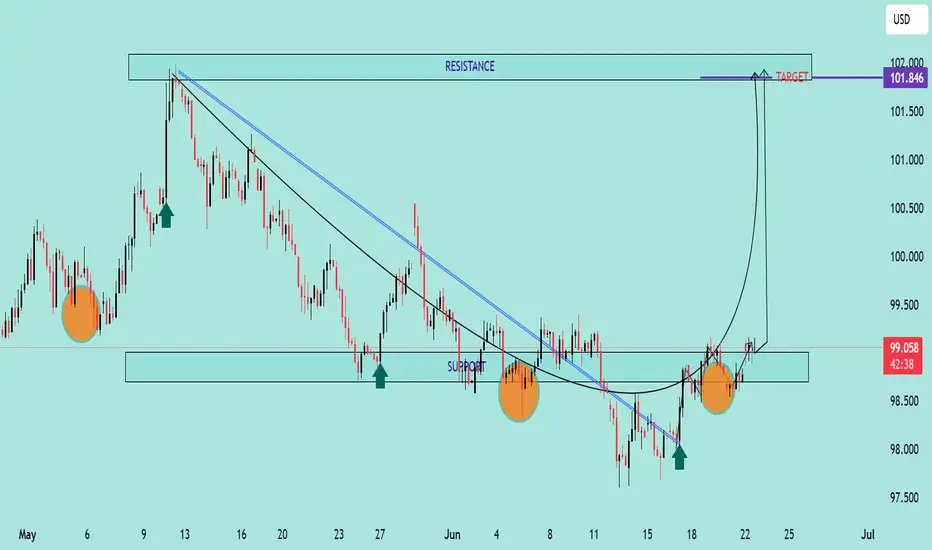
DXY Bullish Reversal & Cup Formation The DXY (US Dollar Index) is exhibiting a strong bullish reversal pattern, with multiple technical signals suggesting upward momentum:
🔍 Technical Analysis Summary:
✅ Support Holding Strong:
Price has respected the horizontal support zone around 98.00–98.50 on multiple occasions (highlighted by orange circles and green arrows), forming a solid base.
✅ Breakout from Downtrend:
A clear breakout above two descending trendlines (black and blue) indicates a shift from bearish to bullish sentiment.
✅ Cup Pattern Formation ☕:
A textbook Cup pattern is visible, where price formed a rounded bottom — a bullish continuation formation. The handle is minor and price has broken above the neckline (around 99.00), signaling a potential continuation toward the target.
✅ Bullish Target 🎯:
Based on the cup pattern and prior resistance, the projected target is around 101.846, aligning with previous major resistance.
📌 Key Levels to Watch:
Support Zone: 98.00 – 98.50
Immediate Resistance: 99.50 – 100.00
Major Resistance/Target: 101.846
🧭 Outlook:
As long as the price remains above the 98.50 zone, the bullish scenario remains intact. The cup breakout indicates strong buying pressure, and momentum could push DXY toward the 101.846 target in the coming sessions.