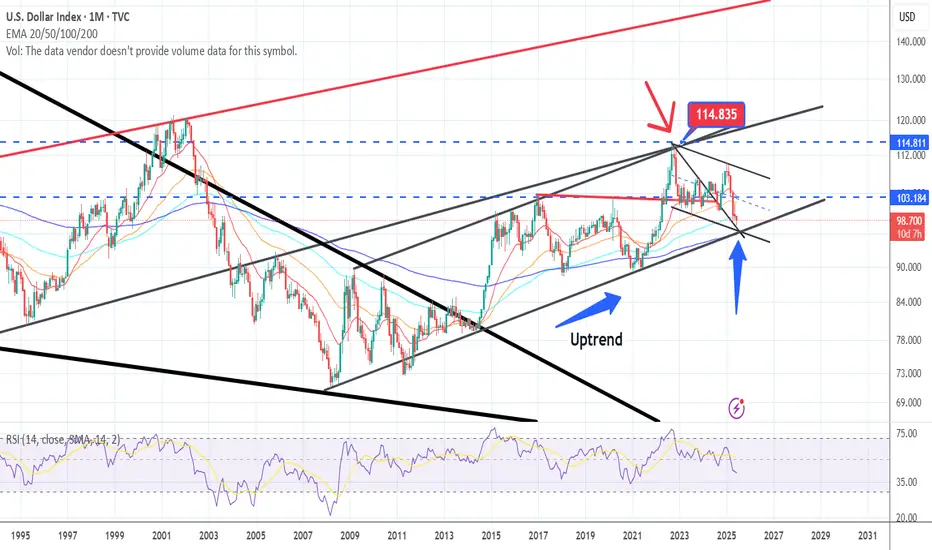
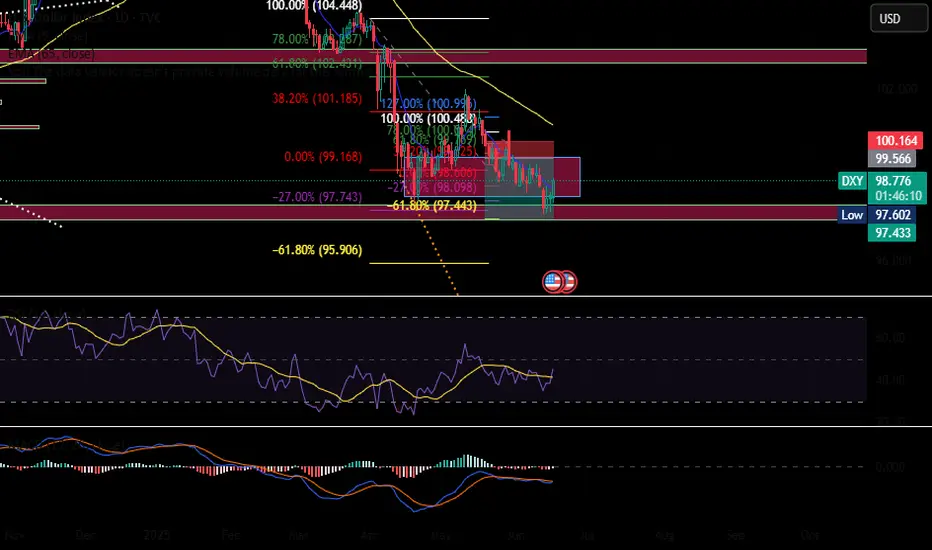
DXY (bearish?)The herd is completely bearish on the dxy, but the chart is showing something else.
The herd is an amazing indicator
What do we see:
-Still in an uptrend
-the 200 ema (blue line)
-A resistance trendline becoming a support trendline?
-A bull flag, so the under part of the flag
So crossing of those 3 trendlines and the 200 ema is telling me that probably this chart is bullish.
DXY trade ideas
DXYThe DXY shows strong bullish COT sentiment, with traders reducing shorts and increasing longs. It’s currently sitting on a key support level, suggesting a possible bounce.
Watch for bullish price action confirming the move.
Entry: On support hold and reversal signal.

DXY
The net long position by large speculators shows a clear bullish sentiment toward DXY. A +785 increase reflects growing confidence in the dollar, reinforcing that positive outlook continues. Overall Bias: Bullish — speculators remain positive on USD strength.

DXY direction.With the news in great favour of DXY, PA also shows multiple rejection at the support zone (clearly oversold already).
Focus on EURUSD and GBPUSD for a long time sell.

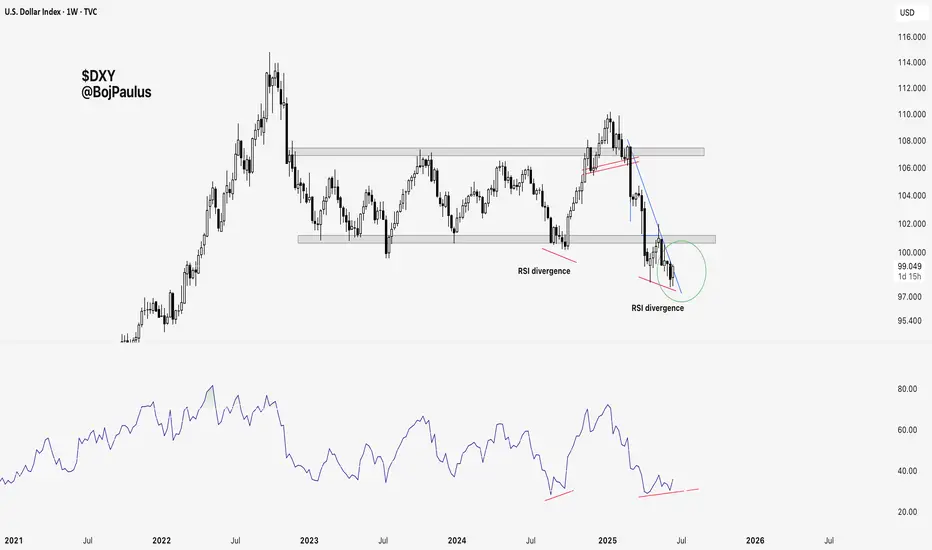
$DXY - First signs of recovery, but no confirmation yet.To find confirmation, I would like to see a clean break of the blue Line on 1d or 3d chart and a bullish MacD cross.`

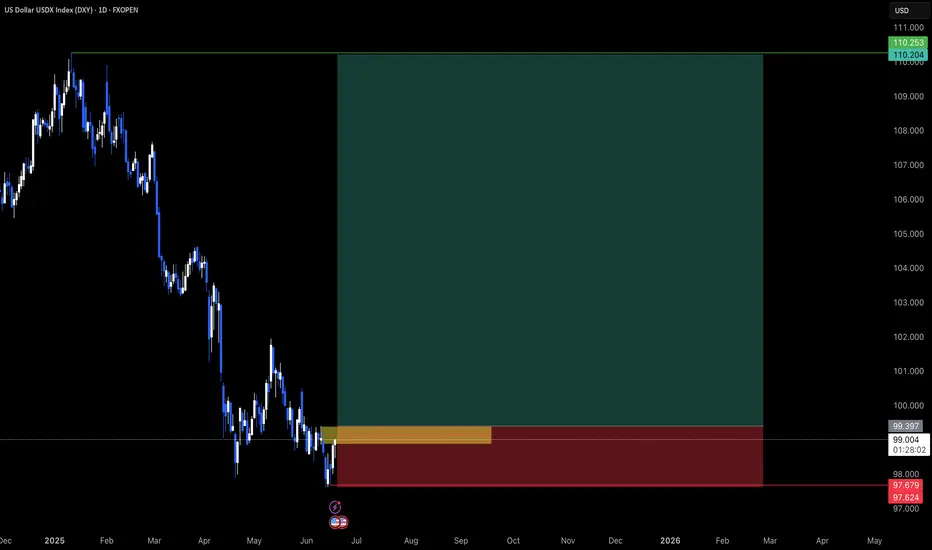
DXY OUTLOOK - SWING SETUPThe dollar has been on a six-month decline, but I anticipate a recovery. This is primarily due to the current economic climate, geopolitical landscape, and the dollar's traditional role as a safe-haven currency during periods of significant uncertainty
"May fortune attend thee, and thy trade prosper." .......L2Earned
Politics is a show. Live watching the Federal Reserve Chair Jerome Powell News Conference
(FOMC Conference)
and at the same time,
Dollar just swept liquidity,
Hit EQ,
Filled 1hrFV Array,
Sent to buyside.
This is crazy.
Its all a game. Its not real.

Bullish bounce?US Dollar Index (DXY) is reacting off the pivot and could rise to the 1st resistance.
Pivot: 98.48
1st Support: 98.09
1st Resistance: 99.25
Risk Warning:
Trading Forex and CFDs carries a high level of risk to your capital and you should only trade with money you can afford to lose. Trading Forex and CFDs may not be suitable for all investors, so please ensure that you fully understand the risks involved and seek independent advice if necessary.
Disclaimer:
The above opinions given constitute general market commentary, and do not constitute the opinion or advice of IC Markets or any form of personal or investment advice.
Any opinions, news, research, analyses, prices, other information, or links to third-party sites contained on this website are provided on an "as-is" basis, are intended only to be informative, is not an advice nor a recommendation, nor research, or a record of our trading prices, or an offer of, or solicitation for a transaction in any financial instrument and thus should not be treated as such. The information provided does not involve any specific investment objectives, financial situation and needs of any specific person who may receive it. Please be aware, that past performance is not a reliable indicator of future performance and/or results. Past Performance or Forward-looking scenarios based upon the reasonable beliefs of the third-party provider are not a guarantee of future performance. Actual results may differ materially from those anticipated in forward-looking or past performance statements. IC Markets makes no representation or warranty and assumes no liability as to the accuracy or completeness of the information provided, nor any loss arising from any investment based on a recommendation, forecast or any information supplied by any third-party.

DXY: Bulls Are Winning! Long!
My dear friends,
Today we will analyse DXY together☺️
The recent price action suggests a shift in mid-term momentum. A break above the current local range around 98. 059 will confirm the new direction upwards with the target being the next key level of 98.148 and a reconvened placement of a stop-loss beyond the range.
❤️Sending you lots of Love and Hugs❤️

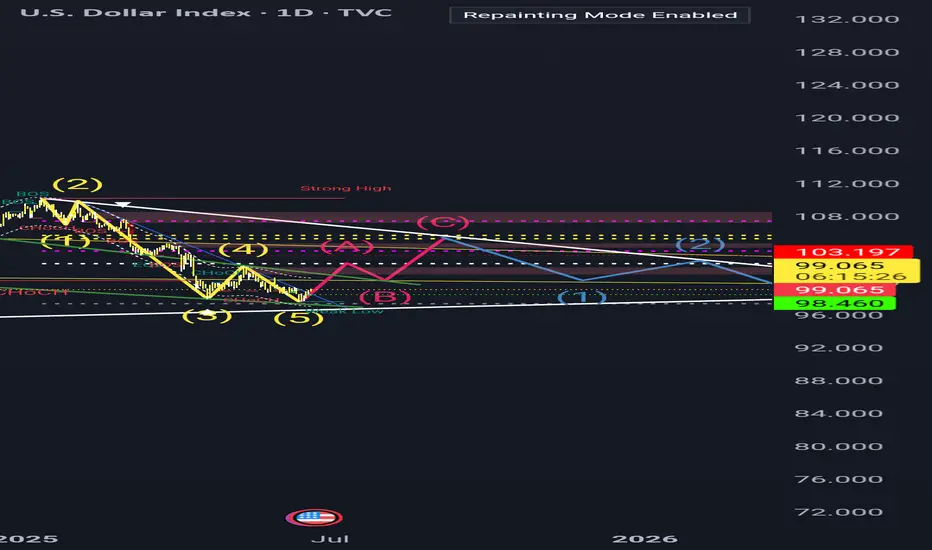
Dollar In Fifth Wave-Reversal In Trend May Not Be Far Away.The Fed will announce its latest policy decision later, and expectations are that Powell will keep rates on hold, especially after last week's slightly higher inflation print and still solid US jobs data. We can see some stabilization in the US dollar ahead of this event, but we have to keep an eye on geopolitical tensions in the Middle East, which coudl also play a key role in driving safe haven flows.
Meanwhile, the stock market continues to trade sideways, and I don't expect any major breakouts or strong moves ahead of the Fed. Also, tomorrow is a holiday in the US, so that could contribute to slower market conditions into the end of the week, unless, of course, the situation in the Middle East gets worse.
Looking at the DXY waves structure, I see athree-wave move from the most recent lows, so the fourth wave I highlighted a few days ago could now be approaching completion near this week’s key resistance around the 99 level. That’s definitely a level to watch for a potential fresh, but possibly final sell-off toward new lows around 97, maybe even 96.
That’s where the DXY could stabilize, as ending diagonal pattern signals that we are likely in the late stages of wave five, meaning this bearish cycle could soon come to an end.

dxy 1hr chart analaysis The current bullish trend in the DXY is likely to face a strong rejection around the 99.55–99.65 zone. Unless there is major news that significantly shifts the market direction — such as a surprise policy announcement like the tariffs introduced during Trump's era — the dollar index is not expected to break above that level. That zone could act as a major turning point, and a bearish reversal is likely to emerge from there

DXY 2H Analysis – June 18, 2025Pair : dxy ,,💲
Is the bullish move fading out? 📉
Price reacting near upper trendline resistance 🔵
Potential correction or final push before deeper drop ❗
Wave count suggests i–ii–iii–iv completed; wave v setup expected 🔁
Watch the reaction in the highlighted zone 📦
Either short continuation or a bullish trap loading 🧠
📌 Strategy: Elliott Wave + Trendline Confluence
📅 Stay sharp. Events approaching 📰
📈 Trade with a plan, not hope.
🔔 Follow @Greenfireforex for more real-time setups and ideas.

USXUSD LOTD SetLOTD Set
Looking for Unemployment Claims / FOMC Delivery Higher on USXUSD.
Nice buildup of Asia Highs below draw.
Let's see.

Dollar - Coming back into Consolidation (Short Term Bullish)Been following dollar with videos for over a month and we have been in sync from the highs highlited in the video. We hit our target last week and now looking for a short term bullish run on stops at 94.40s
Give us a follow. Support the channel. Videos are regular

Skeptic | DXY Crash Alert: Epic Bearish Triggers Unleashed!heyy, traders, what’s good? It’s Skeptic ! 😎 Let’s dive into a full-on breakdown of DXY—the Dollar Index is making waves, and I’m hyped to unpack it. The 98.801 level looks busted with a pullback in play, and I’m expecting more action. Stick with me to the end as we rip through Daily and 4-Hour timeframes to catch the vibe and nail those triggers! 🚖
Daily Timeframe: The Big Picture
So, US inflation data came in softer than expected recently, but DXY still dumped. You might be like, “Wait, shouldn’t lower inflation juice up the dollar?” Nah, here’s the deal: markets move on expectations, not just news. When something grows in the markets, it’s ‘cause traders are betting it’ll keep growing—and vice versa. For DXY, traders are sniffing out a US economic slowdown and expecting the Federal Reserve to cut rates soon, which could spark higher inflation later. That’s the double-whammy driving DXY’s drop, despite the tame inflation numbers. This is the biggest secret in markets—nobody talks about it, but it’s what I learned in econ class and see every day: markets run on expectations. 📚
Major Trend: Per Dow Theory, we’re in a bearish trend as long as we’re below 98.801 .
Game Plan: While under this level, hunt longs on USD pairs like EUR/USD. If we break above 98.801, chill and let the market reform before jumping in.
4-Hour Timeframe: Long & Short Triggers
Now, let’s get to the 4-hour chart for the real action—our long and short triggers:
Short Trigger: A break below support at 98.017 could keep the bearish vibe rolling. RSI hitting oversold would be a dope confirmation. 😤
Long Trigger: Since the major trend is bearish, longs are against the flow, so keep risk tight and take profits quick. The trigger is a break above 98.801, but the main long trigger is smashing through 99.244. So, 99.244 is your go-to for longs. 💪
Pro Tip: Shorts align with the trend, so they’re safer, but longs need extra caution—small positions, tight stops, and don’t get greedy!
Final Vibe Check
That’s the DXY lowdown, fam! Markets are tricky, but if you stick to reasoning over hype, you’ll stay ahead. No FOMO, no hype, just reason —that’s how we roll at Skeptic Lab. Wanna dive deeper into risk management or another pair? Let me know! 🙌
💬 Let’s Talk!
If this analysis got you pumped, smash that boost—it means a ton! 😊 Got a pair or setup you want me to tackle next? Drop it in the comments. Thanks for vibing with me—keep trading sharp! ✌️

DXY bullish here, sell XXXUSD! Do miss this trade plsAs per my previous post on dxy, I'm looking for higher prices now. I dont know the news or war or tariff or rate cut that will push it up. I'm just reporting what I'm seeing on the charts, most times, it doesn't lie. Just when everyone was bullish back in Jan, 2025. I turned bearish, now I'm telling you that we go up slowly or range.
This means you have to sell EURUSD, GBPUSD etc
TP1 @ 98.9
TP2 @ 99.4
Enjoy
Follow me and turn on notification so you'll see my trades on time and enter them on time

DXY June 18 2025We believe that Trump's tariffs and the downward trend in U.S. interest rates will continue to put pressure on the dollar, leading to further depreciation.
Monthly Target: 95.445-101.977

Bearish reversal?US Dollar Index (DXY) has reacted off the pivot and could drop to the 1st support.
Pivot: 98.89
1st Support: 98.29
1st Resistance: 99.60
Risk Warning:
Trading Forex and CFDs carries a high level of risk to your capital and you should only trade with money you can afford to lose. Trading Forex and CFDs may not be suitable for all investors, so please ensure that you fully understand the risks involved and seek independent advice if necessary.
Disclaimer:
The above opinions given constitute general market commentary, and do not constitute the opinion or advice of IC Markets or any form of personal or investment advice.
Any opinions, news, research, analyses, prices, other information, or links to third-party sites contained on this website are provided on an "as-is" basis, are intended only to be informative, is not an advice nor a recommendation, nor research, or a record of our trading prices, or an offer of, or solicitation for a transaction in any financial instrument and thus should not be treated as such. The information provided does not involve any specific investment objectives, financial situation and needs of any specific person who may receive it. Please be aware, that past performance is not a reliable indicator of future performance and/or results. Past Performance or Forward-looking scenarios based upon the reasonable beliefs of the third-party provider are not a guarantee of future performance. Actual results may differ materially from those anticipated in forward-looking or past performance statements. IC Markets makes no representation or warranty and assumes no liability as to the accuracy or completeness of the information provided, nor any loss arising from any investment based on a recommendation, forecast or any information supplied by any third-party.

DXYThe DXY has faced severe sell off due to President Trump's policy and idea of how the dollar should be controlled/managed. Though it has fallen, a pullback will happen soon. I will be using the DXY as a good guide for all the USD/XXX or XXX/USD pairs. You as a trader can take what you can from this.
These 4HR FVG'S seem like a very good place where you can do one of two things. First you may be able to manage and hold a trade throughout the whole pullback. Another option is take complete profits instead of partials and enter in at good prices with this pullback in mind for bias.

$DXYAs tensions rise in the Middle East, the dollar remains a safe haven.
We could see a temporary bullish run on the dollar as capital seeks safety.
But for me, Bitcoin was the first signal that smart money is shifting into alternative assets like Gold, Silver, and beyond.
Stay alert. The market speaks before the news does.
DXY OVERVIEW AND ANALYSIS - SELLOFF AT FOMC PRESS CONFERENCE 🟣DXY🟣 H4 CHART
As we witness the unfolding of a conflict in the Middle East this week I expect the commodities of OIL and GOLD to raise more after a pullback that will offer buy entries.
On my view the DXY index will pullback to the previous broken support now resistance in the 99.200 - 99.340 area and selloff to the weekly targets 97.500 and 96.800.
FOMC on Wednesday should catalyse this move and I expect the pullback to take place between the first days of the week
