EXY (Euro Index) The Euro backs the Dollar Index (DXY) by something of 50 something percent on the chart we see a gartley pattern that has completed and on the way down. Now Scott Carney, whom i think is next chartist genius next to Gann, Elliot, Dow, and Gartley. He was able to take all their readings and somehow make one of the most traded or talked about trading systems in the world. so much so tradingview teamed up with him yeas ago to help develop the harmonics drawings tool i use today, and the craziest thing about it is he came out with system in his early 30's. and what makes this even better is he is still alive running harmonic trader.com.
enough about Scott Carney i think that the pattern is completing a type 1 setup. So what im thinkning is Monday we will move to the 382 tuesday indecesion candle rest of the week retrace to the PRZ and the week after we might see a bigger move down.
the fundamental data
the COT
The Commercial Shorts are drvining the prices of the euro HIGH we a whopping 20,000 orders short!!! the longs to stop price was only a 1/5 of what the shorts did. the Non-Coms are increasing their longs by 10,000 orders driving prices way higher insync with the commercials.
so here is the net data
Commercials-
Current= (133,718) // Previous= (117,198)
Non-Commercials-
Current= 95, 649 // Previous= 81,240
Needless to say any buys on the Euro is a good decesion, prices are still going higer and higher. any dips in price are just that a Dip. might be an oppritunity to hop on a speeding train. i would not hold on to this pattern longer than the 382 retracement of the pattern
EXY trade ideas

breakout confirmed on EXYi've opened long positions on CHFJPY, EURJPY & EURCHF, i'm looking to gain upto 1000 pips combined.


EUR Analysisguys this is without the fundamental analysis
I will make an Update to this with the fundamental analysis tomorrow
stay tuned!

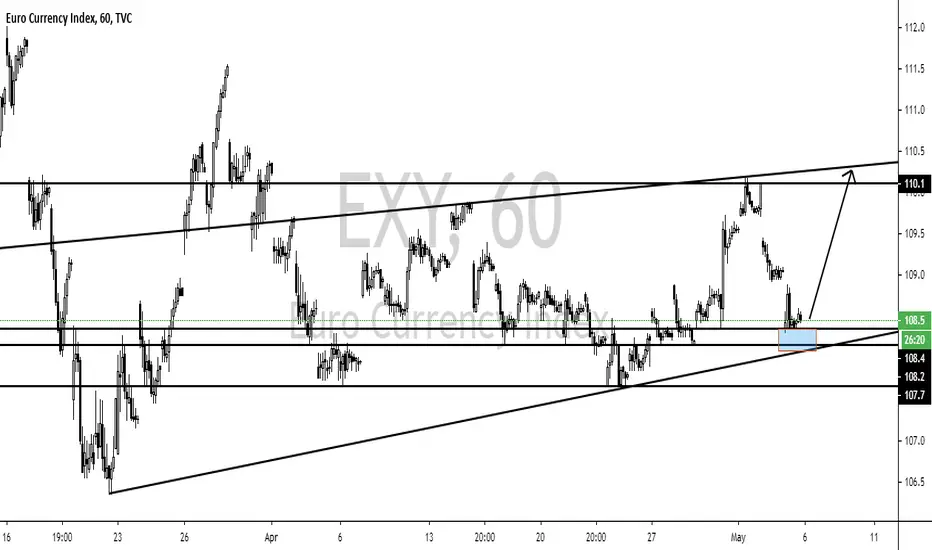
1D EXY LONGEURO index has pushed up through a key zone and a strong trendline. On the weekly chart, we can clearly see price accumulating for the upward push which have now seen through this week.
I believe price exhaustion will happen and we will see it test this trend line and / or zone of buy sensitivity before price moves upward to test the next zone of sensitivity above it.


EXY - Bearish engulfingBearish engulfing is one of the most reliable trading patterns (along with morning star) and in 80 percent cases generates a bearish reversal. Here, bearish candle engulfed 2 previous days what is rather significant. Price usually pulls back to the middle of bearish engulfing pattern before further drop. That is what we observing on Euro index.
We also reached weekly R3 reversal level.
Note also how price reacts at Camarilla S3-R3 reversal levels (those levels contain so called "value zone")
and Camarilla S4-R4 breakout levels (so called "floor and roof")
For educational purposes only.


EURO CURRENCY INDEX (EXY) Monthly, Weekly, DailyDates in the future with the greatest probability for a price high or price low.
The Djinn Predictive Indicators are simple mathematical equations. Once an equation is given to Siri the algorithm provides the future price swing date. Djinn Indicators work on all charts, for any asset category and in all time frames. Occasionally a Djinn Predictive Indicator will miss its prediction date by one candlestick. If multiple Djinn prediction dates are missed and are plowed through by same color Henikin Ashi candles the asset is being "reset". The "reset" is complete when Henikin Ashi candles are back in sync with Djinn price high or low prediction dates.
One way the Djinn Indicator is used to enter and exit trades:
For best results trade in the direction of the trend.
The Linear Regression channel is used to determine trend direction. The Linear Regression is set at 2 -2 30.
When a green Henikin Ashi candle intersects with the linear regression upper deviation line (green line) and both indicators intersect with a Djinn prediction date a sell is triggered.
When a red Henikin Ashi candle intersects with the linear regression lower deviation line (red line) and both indicators intersect with a Djinn prediction date a buy is triggered.
This trading strategy works on daily, weekly and Monthly Djinn Predictive charts.
Trades made when the monthly, weekly and daily arrows are pointing in the same direction are the most profitable.
This is not trading advice. Trade at your own risk.

1D EXY SHORTEURO index is bearish on monthly, weekly and now we have a gap down, re-test and a short to the gold indicated zone possibility.


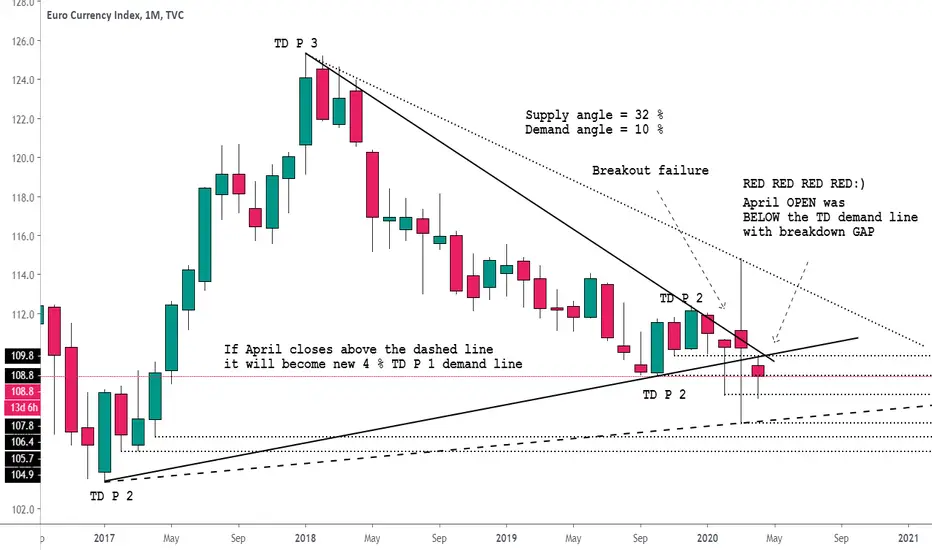
EXY - oversupplyEuro index chart. Monthly. Price is driven by global supply and demand. And what we are observing, is a clear oversupply of euro (all selling) and weakening demand (less international interest in euro) on universal scale. Buyers failed to break the supply line and April opened below the demand line with a gap.
Top Absolute Correlation
1 EURUSD - USDX -96.8%
2 EURUSD - USDPLN -95.8%
3 EURUSD - USDCZK -92.7%
4 EURUSD - EURSGD 88.9%
5 EURUSD - EURCHF 86.7%
6 EURUSD - USDSGD -81.6%
7 EURUSD - USDHUF -79.9%
8 EURUSD - EURJPY 78.7%
9 EURUSD - EURCAD 74.7%
10 EURUSD - HK50 70.5%


EURO below monthly balance DPPEURUSD chart might provide false information.
You have to look also at Euro currency index (against the basket all major currencies) to understand what is happening.
Demark pivots are very accurate when it comes to power balance.
As for today EURO still remains in monthly bear market. It is struggling against both monthly and weekly resistance.

Eurusd next support 1.0269 Eurusd will continue his bearish movement until 1.0269, for this analysis we use the following charts :
1. Eurusd 1D chart - still Bearish, see pic for resistance & support
2. Dxy 1M - still Bullish, next resistance 109.18 (dollar market-wide liquidation)
3. Exy 1M - clear Bearish, next support 98.4
4. Eurusd 1M - hard Bearish supported by strong sell volume, next support 1.0269
remember all direction need confirmation before opening
