Hang Seng....End of wave "2"?Hello Traders,
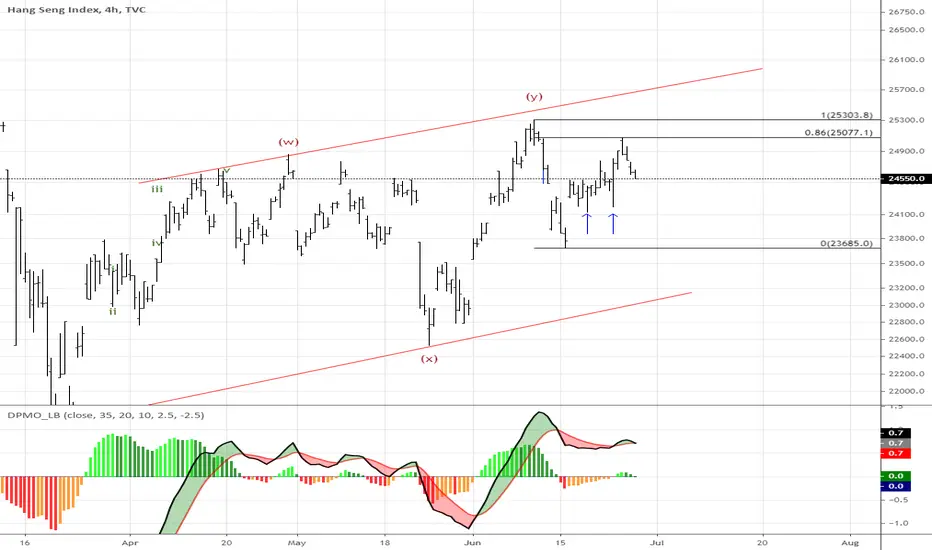
Hang Seng advanced to 25071 on June 24. This move shows overlapping waves, indicating a corrective pattern. It could be a wave „2“ which was done at 25071 and the index is ready to decline.
If so to come, HS will decline in the coming hours and a cross of 23685 would strengthen the odds for this view. A first hint is a break of 24184 and 24121 (denoted with the blue arrows) on an hourly closing basis.
If HS breaks below 23685 the target zone is the lower boundary of the channel (red) which crosses ~23100 area on Monday. A break of this channel line would indicate more bearish potential ahead!
On the other hand, would make a move above 25303, the wave (y) high this count invalid, and an alternate view come into play, including higher highs to come in the days ahead.
Have a great weekend
ruebennase
Feel free to ask or comment.
Trading this analysis is at your own risk!
HSI trade ideas

Hang Seng....End of wave "2"?Hello Traders,
Hang Seng advanced to 25071 on June 24. This move shows overlapping waves, indicating a corrective pattern. It could be a wave „2“ which was done at 25071 and the index is ready to decline.
If so to come, HS will decline in the coming hours and a cross of 23685 would strengthen the odds for this view. A first hint is a break of 24184 and 24121 (denoted with the blue arrows) on an hourly closing basis.
If HS breaks below 23685 the target zone is the lower boundary of the channel (red) which crosses ~23100 area on Monday. A break of this channel line would indicate more bearish potential ahead!
On the other hand would make a move above 25303, the wave (y) high this count invalid, and an alternate view comes into play, including higher high`s to come in the days ahead.
Have a great weekend
ruebennase
Feel free to ask or comment.
Trading this analysis is at your own risk!


Hang Seng Index Large Comple Correction TO CompleteIt looks like that the index has finished the correction around 61.8% Fibonacci retracement.
Now it could drop to the bottom of the range within a large complex correction

Hang Seng Index (HSI). Correction Could Be Over. Target 51300The correction that I expected earlier (see related) could be over already with shorter wave Y.
The final confirmation trigger set at 29200. The target is 51300.

HONG KONG UNDER RESISTANCE AND LOOKS BEARISHHello Traders,
Hong Kong is going through some troubling times right now. To summarize very briefly, Hong Kong has been its own entity for some time with its own legal systems, boarders and rights but due to legal agreements China wants to take back Hong Kong as part of China. This is a crude summary of events.
This is causing friction between Hong Kong and China and there have been violent protests for several months over the current situation. Hong Kong property market is also one of the most expensive in the world.
Due to the current climate of uncertainty and looking at the chart of the Hong Kong top 50, it looks very bearish to me.
Price has dropped out of a large descending triangle, that H+S dumping price to below the major support/resistance level. Price looks like its trying to break resistance but I think with whats going on right now it wont.
Quite simply if the price breaks resistance, holds resistance and moves up then that will make my bearish stance invalid.
But because I am bearish I am looking for weakness here. Repeated failures at resistance means the price will be going lower.


Hang Seng...Short term down?Hello Traders,
on May 22 Hang Seng made it`s low @ 22519 within a wave „X“ and advanced to 25303.8, a wave „Y“! The correction since that day is not a clear impulse down, nor is it a clear corrective pattern.
While the advance from 22528 (wave „X“) is a countable „five-up“ let`s check the targets to both sides.
If this move from 22528 is a fresh new impulse, the retracement for a wave „2“achieved the 0.618 Fibonacci, found support at the rising green trendline, what could be all of the correction.
If so, a push to new highs is next to occur and may have started @ 23588 yesterday. To establish this view, Hang Seng needs to advance above the area of 24685-24957 on an hourly closing price.
On the larger timeframe, it could be possible, that this move is part of the very first patterns of the resumed downtrend. The decline from 25303- 23685 retraced the 0.5 Fibonacci and is either wave „2“ or wave „a“ of wave „2“ which could develop as a „expanding-flat“!
So a break below the 23685 would strengthen the odds, that a wave „3“ is underway. This must be done with massive volume and a bear-candle1
So I guess, the next hours will be pretty important for the coming week and will bring more clarity to the developing wave patterns!
Have a great week...
ruebennase
Feel free to ask or comment!
Trading this analysis si at your own risk!


HSI/HK50: 25% correction & best level to RELOAD/BULLS(NEW)Why get subbed to to me on Tradingview?
-TOP author on TradingView
-15+ years experience in markets
-Professional chart break downs
-Supply/Demand Zones
-TD9 counts / combo review
-Key S/R levels
-No junk on my charts
-Frequent updates
-Covering FX/crypto/US stocks
-24/7 uptime so constant updates
HSI/HK50: 25% correction & best level to RELOAD/BULLS(NEW)
IMPORTANT NOTE: speculative setup. do your own
due dill. use STOP LOSS. don't overleverage.
🔸 Summary and potential trade setup
::: HSI/HK50 weekly chart review
::: massive H*S setup in progress
::: 25% correction up next
::: runaway BEAR gap previously
::: signals more downside mid-term
::: PT is 19 000 within 4-10 weeks now
::: weak chart and no upside until S/R
::: right now you can only SHORT IT
::: correction can last 4-10 weeks
::: 19 000 best reload BULLS later after corr
::: good luck traders
🔸 Supply/Demand Zones
::: N/A
::: N/A
🔸 Other noteworthy technicals/fundies
::: TD9/Combo update: N/A
::: Sentiment: BEARS
::: Sentiment outlook short-term: BEARISH


Trade war and Hong Kong A short story in the making.
perhaps this will be the first piece of the dominos in this decoupling warfare.

Hang Seng....One more high to come?Hello Traders,
Hang Seng made a high yesterday @25308 and declined since to 24480 today. Today`s decline is the largest one day decline since May 28 it fits well into the harmonic view, that a wave „4“ is done at 24308, which is the 0.382 Fibonacci of the decline since yesterday!
If so to come, hang Seng has one more high to established before it is ready to reverse.
The question would be if this reversal, so it will occur, is a correction at a lower timeframe, or will it be the start of a more prolonged wave of even higher degree? Well, we will see...!
Note the open gap`s at the chart. There is one left by the trading from March 6-9 from 26146-25134 and a second one from February 21-24 (27308-27105)! If both gaps would be filled, it will retrace a 0.786 Fibonacci of the decline from the high @ 29174, the possible wave „2“ area. If it just would fill the first (lower) gap, it probably will do it with a spike to complete the aforementioned scenario!
So, we will wait for the next trading hours to see, how HS will move.
Have a great week....
ruebennase
Feel free to ask or comment!
Trading this analysis is at your own risk!
