Daily Market Update for 3/31Summary: No sector avoided losses among continuing worries over the war in Ukraine and the Fed's response to inflation. Chinese stocks moved lower on disappointing economic data and COVID outbreaks.
Notes
Ideas always welcome in the comments. Errors will be amended as comments on TradingView or corrected inline in my blog.
-=x=-=x=-=x=-=x=-=x=-=x=-=x=-
Thursday, March 31, 2022
Facts: -1.54%, Volume lower, Closing Range: 1%, Body: 94% Red
Good: Lower volume
Bad: Closing range, advance/decline
Highs/Lows: Lower high, Lower low
Candle: Mostly red body, tiny upper wick
Advance/Decline: 0.41, more than two declining for every advancing stock
Indexes: SPX (-1.57%), DJI (-1.56%), RUT (-1.00%), VIX (+6.36%)
Sector List: Utilities (XLU -0.11%) and Consumer Staples (XLP -0.24%) at the top. Consumer Discretionary (XLY -1.92%) and Financials (XLF -2.29%) at the bottom.
-=x=-=x=-=x=-=x=-=x=-=x=-=x=-
Market Overview
No sector avoided losses among continuing worries over the war in Ukraine and the Fed's response to inflation. Chinese stocks moved lower on disappointing economic data and COVID outbreaks.
The Nasdaq fell by -1.54%. Volume was lower than the previous day but the 94% red body and 1% closing range show selling throughout the day. There is a small upper wick formed after open but then a sell-off in the last hour erased a lower wick leaving behind a thick red bodied candle. There were more than two declining stocks for every advancing stock.
The S&P 500 (SPX) lost -1.57% while the Dow Jones Industrial Average (DJI) fell by -1.56%. Small caps held up the best with the Russell 2000 (RUT) declining only -1.00%. The VIX Volatility Index rose +6.26%.
All S&P 500 sectors declined. Defensive sectors were at the top of the sector list. Utilities (XLU -0.11%) and Consumer Staples (XLP -0.24%) had the least significant declines. Consumer Discretionary (XLY -1.92%) and Financials (XLF -2.29%) were at the bottom of the list.
PCE Price Index data was slightly lower than forecast. Weekly Initial Jobless claims came in at 202,000 compared to the forecast of 197,000. The Chicago PMI for March showed a stronger than expected manufacturing sector.
The US Dollar index (DXY) grew +0.52%. US 30y and 10y Treasury Yields were lower while the 2y Yields increased. High Yield (HYG) and Investment Grade (LQD) Corporate bond prices moved lower. Brent Oil moved below $110, ending the day at $105.22.
The put/call ratio (PCCE) rose to 0.787. The CNN Fear & Greed index is just on the Fear side of Neutral. The NAAIM Money Manager Exposure Index rose to 79.72 from 52.69 the previous week.
All of the big six declined today. Alphabet had the biggest loss, declining by -2.10%. However, Amazon (AMZN) is the only one trading below any moving average line (the 200d MA).
No mega-caps gained today. Costco (COST) faired the best, only declining -0.11%. The biggest loser was Alibaba (BABA), declining -6.67% to end up at the bottom of the list.
The Daily Update Growth List had just eight stocks with gains. The best stock in the list was MongoDb, gaining +3.11%. Chinese stocks were at the bottom of the list with FUTU Holdings (FUTU) having the largest decline. The stock fell by -12.94%.
-=x=-=x=-=x=-=x=-=x=-=x=-=x=-
Looking ahead
Tomorrow is payrolls Friday when we get the monthly look at employment data in the early morning. We will also get the ISM Manufacturing Purchasing Managers Index after the market opens.
-=x=-=x=-=x=-=x=-=x=-=x=-=x=-
Trends, Support, and Resistance
The Nasdaq continued to pull back from the recent rally.
If the index will return to the trend line from the 3/14 low, it would take a +4.49% gain which is not likely to come in one day.
The five-day trend line points to a +2.80% gain.
If the one-day trend continues, we can expect another -0.23% decline for Friday.
-=x=-=x=-=x=-=x=-=x=-=x=-=x=-
Wrap-up
Investor jitters drove selling today. The war in Ukraine. Continuing high inflation. Economic data from China amid COVID outbreaks. Those were the major themes and will continue to drive volatility in the days and possibly weeks ahead.
We just ended the worst quarter for equities since the pandemic began. Here's hoping for a better Q2!
Stay healthy and trade safe!
IXIC trade ideas

Nasdaq Crash imminent Nasdaq Crash imminent, no man knows the day or time but we will see a pull back

Daily Market Update for 3/30Summary: Stocks pulled back after yesterday's rally as investors awaited any breakthroughs in the Russia-Ukraine negotiations.
Notes
Ideas always welcome in the comments. Errors will be amended as comments on TradingView or corrected inline in my blog.
-=x=-=x=-=x=-=x=-=x=-=x=-=x=-
Wednesday, March 30, 2022
Facts: -1.21%, Volume lower, Closing Range: 26%, Body: 52% Red
Good: Lower volume on decline, still well above last week's close
Bad: Closing range, lower high, lower low
Highs/Lows: Lower high, Lower low
Candle: Medium red body in middle of candle, equal upper and lower wicks
Advance/Decline: 0.33, three declining for every advancing stock
Indexes: SPX (-0.63%), DJI (-0.19%), RUT (-1.97%), VIX (+2.28%)
Sector List: Energy (XLE +1.16%) and Utilities (XLU +0.83%) at the top. Technology (XLK -1.33%) and Consumer Discretionary (XLY -1.52%) at the bottom.
-=x=-=x=-=x=-=x=-=x=-=x=-=x=-
Market Overview
Stocks pulled back after yesterday's rally as investors awaited any breakthroughs in the Russia-Ukraine negotiations.
The Nasdaq fell by -1.21%. The decline nearly filled the gap-up at yesterday's open. Volume was lower than the previous day. The 52% red body sits in the middle of candle with equal length upper and lower wicks. The upper wick, formed in the morning. The index then declined, briefly pausing at 14,500 before moving lower. A quick rally before the close created the lower wick.
The Russell 2000 (RUT) had the biggest decline, pulling back by -1.97% today. The S&P 500 (SPX) dropped -0.63%. The Dow Jones Industrial Average (DJI) declined only -0.19%, helped by a rally in energy stocks.
Four of the eleven S&P 500 sectors gained. Energy (XLE +1.16%) was at the top of the sector list, followed closely by Utilities (XLU +0.83%). The other two gaining sectors were both defensive sectors. Technology (XLK -1.33%) and Consumer Discretionary (XLY -1.52%) were at the bottom of the list.
GDP data for Q4 was lower than expected, showing quarter-over-quarter growth of 6.9% compared to expected growth of 7.1%. GDP Price Index data also came in lower than expected, possibly good news that prices are growing less quickly than thought. Crude Oil Inventories were lower than expected, helping boost oil prices today.
Brent Oil prices moved higher on reports that Germany may ration oil and the US Crude Oil Inventories were lower than expected. The US Dollar index (DXY) declined by -0.58%. US 30y, 10y, and 2y Treasury Yields all declined and the inversion in the 10y and 2y started to recover. High Yield (HYG) Corporate Bond prices declined while Investment Grade (LQD) Corporate Bond prices rose.
The put/call ratio (PCCE) declined to 0.627. The CNN Fear & Greed index is at Neutral.
All big six declined. Amazon (AMZN) dipped back below its 200d MA but all others are well above moving averages.
Novo Nordisk (NOVO) was the top mega-cap today, advancing +2.12%. UnitedHealth (UNH) followed with a +2.12% advance, helping the health sector end the day with gains. ASML Holding (ASML) was at the bottom of the mega-cap list, declining by -3.47%.
The Daily Update Growth List had only three gainers. Lululemon Athletica (LULU) was at the top of the list, gaining +9.58% on strong earnings and a stock repurchase announcement. RH (RH) and Chewy (CHWY) both disappointed investors with their earnings and landed at the bottom of the list. They declined by -13.33% and -16.10% respectively.
-=x=-=x=-=x=-=x=-=x=-=x=-=x=-
Looking ahead
PCE Price Index Data along with Personal Spending for February comes in the morning. We will also get the weekly Initial Jobless Claims. After the market opens, the Chicago Purchasing Managers Index data will provide a look at manufacturing health.
Walgreens (WBA) reports earnings tomorrow. The company will give one more look at the health of the Retail sector which so far had mixed results in earnings this week.
-=x=-=x=-=x=-=x=-=x=-=x=-=x=-
Trends, Support, and Resistance
The Nasdaq pulled back from yesterday's rally. On the way down, it go support at 14,500 but then ended the day below that area.
If the index returns to the trend line from the 3/14 low, that would mean a +2.83% gain for Thursday.
The five-day trend line points to a +2.11% gain.
If the pull-back continues, the one-day trend line ends with a -1.15% decline for tomorrow.
-=x=-=x=-=x=-=x=-=x=-=x=-=x=-
Wrap-up
Investors, and the general public, were hoping for more of a breakthrough in negotiations to end the war between Russia and Ukraine. Negotiators on both sides needed time to write a formal agreement and get support from within their parties. Talks will resume in online formats on Friday.
Germany has said it may start to ration oil. That caused Brent Oil to rise above $110 again today but is now back below that mark. Tomorrow's inflation data tomorrow will have the most influence over markets as we wait for better news from Ukraine.
Stay healthy and trade safe!

Nasdaq composite (IXIC) deathcrossAs Russia/West tensions increase and US stock futures in red, it is easy to expect a further sell off in equities (the same should happen in crypto market). We already had a deathcross (Daily timeframe on top chart) on Friday and if you check past this pattern is actually bullish long term. Considering the Weekly chart, I am expecting a close below 30 RSI (11) this or next week. That would be another confirmation of the bottom. You can check BTC and TOTAL crypto mcap charts as similar oversold setup closing in on Weekly.
Of course this does not mean we can't have further move down later this year, but once weekly closes below 30 on RSI and another week above its a very good confirmation we should see some rebound at least for the next good few weeks.

nas came closer to significant pointnow we will see the action at validation line of wave1. should be defended

Daily Market Update for 3/28Summary: More yield curve inversion in bond markets raised eyebrows while a drop in oil prices helped equities rally.
Notes
Ideas always welcome in the comments. Errors will be amended as comments on TradingView or corrected inline in my blog.
I had a vacation last week and decided to stay away from the computer as much as possible, so no Daily Updates for the past week. Overall a constructive week for the market, but fear-driven volatility persists as global events unfold and the yield curve inverts for the first time since 2008.
-=x=-=x=-=x=-=x=-=x=-=x=-=x=-
Monday, March 28, 2022
Facts: +1.31%, Volume lower, Closing Range: 100%, Body: 70% Green
Good: 100% closing range, consistent gains after morning dip.
Bad: Lower volume, and advance/decline ratio below 1.0
Highs/Lows: Higher high, Higher low
Candle: Thick green body above a medium lower wick. No upper wick.
Advance/Decline: 0.64, three declining stocks for every two advancing
Indexes: SPX (+0.71%), DJI (+0.27%), RUT (+0.00%), VIX (-5.67%)
Sector List: Consumer Discretionary (XLY +2.67%) and Real Estate (XLRE +1.27%) at the top. Materials (XLB -0.45%) and Energy (XLE -2.48%) at the bottom.
-=x=-=x=-=x=-=x=-=x=-=x=-=x=-
Market Overview
More yield curve inversion in bond markets raised eyebrows while a drop in oil prices helped equities rally.
The Nasdaq gained +1.31% for the day, continuing the rally since March 14. Volume was lower than the previous day and there were more declining stocks than advancing stocks. So although the rally continues, it is slowing. That could be constructive, allowing for moving averages to catch up. Or it could mean another dip is ahead.
The S&P 500 (SPX) gained +0.71%. The Dow Jones Industrial Average (DJI) gained +0.27%. The Russell 2000 (RUT) stayed flat. The VIX Volatility Index declined -5.67%, continuing to drop back to normal levels, but still elevated.
Consumer Discretionary (XLY +2.67%) led the sector list, helped by Tesla's (TSLA) 8% gain. Real Estate (XLRE +1.27%) was the next best sector. Materials (XLB -0.45%) and Energy (XLE -2.48%) were at the bottom of the sector list. The Energy sector was brought down by a dip in oil prices.
The 5y Treasury Yield rose above the 30y yield for the first time since February 2006. Inversions signal future recessions. The inversion in 2006 preceeded the 2008 Financial Crisis and a 60% correction in US equity markets.
Brent Oil fell by -8.64% but remained above $105. The US Dollar index (DXY) rose +0.32% today. US 30y and 10y Treasury Yields declined while the 5y and 2y Treasury yields advanced. Both High Yield (HYG) and Investment Grade (LQD) Corporate Bond prices rose. Silver and Gold both declined sharply.
The put/call ratio declined to 0.654.
The big six all gained today with Tesla (TSLA) leading the way with a +8.03% gain. Amazon (AMZN) and Microsoft (MSFT) followed with +2.56% and +2.31% gains. With Amazon moving above its 200d moving average, now all six are above the three key moving average lines.
Tesla topped the broader mega-cap list as well. Big oil companies were at the bottom of the list with Royal Dutch Shell (SHEL) having the biggest loss, declining by -2.90%.
The Daily Update Growth List did very well with only a handful of declining stocks in the list. At the top of the list was DoorDash (DASH), gaining +8.68%. GrowGeneration (GRWG) declined by -4.05%, ending down at the bottom of the list.
-=x=-=x=-=x=-=x=-=x=-=x=-=x=-
Looking ahead
How Price Index data for January will be available in the morning. After the market opens, we'll see CB Consumer Confidence for March and the JOLTs Job Openings for February.
More Fed members are scheduled to speak tomorrow and investors will be watching for any aggressively hawkish comments.
API Weekly Crude Oil Stock comes in the afternoon.
Lululemon Athletica (LULU), Chewy (CHWY), RH (RH) are among some of the interesting earnings reports for Tuesday.
-=x=-=x=-=x=-=x=-=x=-=x=-=x=-
Trends, Support, and Resistance
The Nasdaq seems to have support at 14,000 and is heading toward the support/resistance area of 14,500.
If the trend from the 3/14 low continues, we can expect a +1.89% advance for Tuesday.
The one-day trend line points to a +0.33%.
If the index returns to the five-day trend line, that would mean a -0.72% decline.
-=x=-=x=-=x=-=x=-=x=-=x=-=x=-
Wrap-up
It will be interesting to watch how the market reacts to more inversion in the yield curve. The higher yields on shorter-term Treasuries could be a combination of worries about the war in Ukraine, but also could be over fears of a recession induced by the Fed's attempts to control inflation.
Typically, an inversion signals a recession that is still months to a couple of years away.
Stay healthy and trade safe!

Corporations will face a tough enviorment over the next year(s)Our most recent boom was fueled by helicopter money and that helicopter is no longer around. Slump for 189 days, then rug to March 2020 lows? Imagine having the opportunity to buy tech stocks at generational low P/E's?
It would be a once in a lifetime opportunity. Few get these chances.. very dependent on a broader recession, but with the idea of early slump now portrays the best bust cycle post-recession (roaring 20's super cycle). I have been stashing away my cash rather than investing it over the past 6 months. I bought the recent low, but sold today as a small swing trade. I am so excited to watch prices over the next few weeks.


2008-2022: Is history repeating itself?I can see a very similar pattern ( to the 2008 pattern) is happening now.
Can you see it? I hope you can see the lines I drew in 2008 and 2022

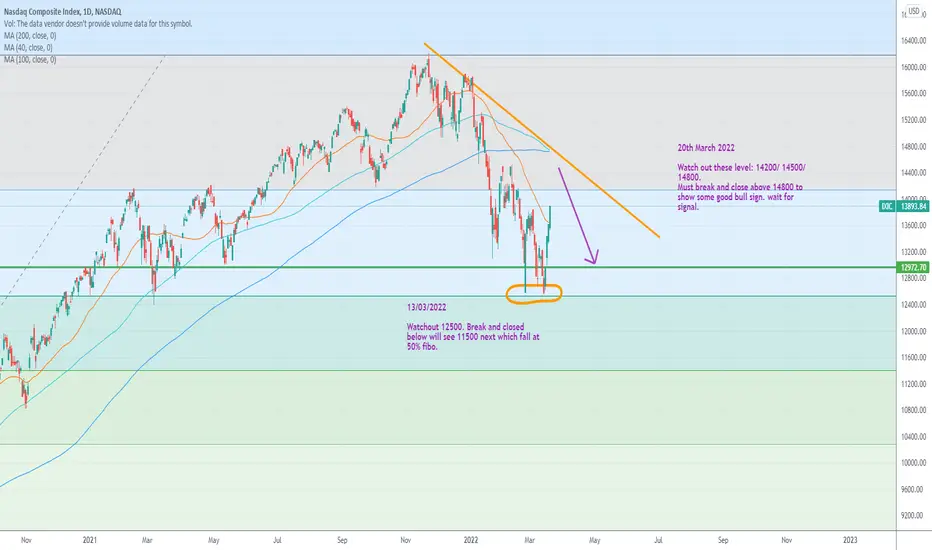
Sideway trending but bias on upside20th March 2022
Watch out these level: 14200/ 14500/ 14800.
Must break and close above 14800 to show some good bull sign. wait for signal.
Are we here?NASDAQ:IXIC - The chart spans from the year 2000, to now. Looks familiar, doesn't it? The mega run-up, breaking major support lines, panic, then a giant bullish weekly candle pulling us back to the moving averages. Looks very very similar to our current chart, doesn't it?
This move up and sideways could last for months and leave us blindsided, but the developments will unfold slowly enough to catch anyone off guard. Of course, we could keep trending sideways or higher for the rest of the year even, but don't be mistaken, this up move can't go on forever.

Where are we headed?NASDAQ:IXIC - The following screenshot is from the year 2000, the turn of the millennium. This looks familiar, doesn't it? The mega run-up, breaking major support lines, panic, then a giant bullish weekly candle pulling us back to the moving averages. Looks very very similar to our current chart, doesn't it?
This move up and sideways could last for months and leave us blindsided, but the developments will unfold slowly enough to catch anyone off guard. Of course, we could keep trending sideways or higher for the rest of the year even, but don't be mistaken, this up move can't go on forever.

Daily Market Update for 3/18Summary: The Nasdaq had its best week since November 2020, rallying more than 10% from Monday's low to close with a +8.18% gain.
Notes
Ideas always welcome in the comments. Errors will be amended as comments on TradingView or corrected inline in my blog.
-=x=-=x=-=x=-=x=-=x=-=x=-=x=-
Friday, March 18, 2022
Facts: +2.05%, Volume higher, Closing Range: 99%, Body: 89% Green
Good: High volume advance, great closing range
Bad: Nothing
Highs/Lows: Higher high, Higher low
Candle: Mostly green body, tiny lower wick, no upper wick
Advance/Decline: 1.86, more than three advancing for every two declining stocks
Indexes: SPX (+1.17%), DJI (+0.80%), RUT (+1.02%), VIX (-7.01%)
Sector List: Consumer Discretionary (XLY +2.11%) and Technology (XLK +2.05%) at the top. Energy (XLE -0.09%) and Utilities (XLU -0.85%) at the bottom.
-=x=-=x=-=x=-=x=-=x=-=x=-=x=-
Market Overview
The Nasdaq had its best week since November 2020, rallying more than 10% from Monday's low to close with a +8.18% gain.
The tech-dominated index rose +2.05% for the day. Volume was much higher thanks to a quadruple witching day where derivative contracts all expire the same day, causing an increase in volume. The candle is 89% green body with a 99% closing range, leaving behind a small lower wick created right after the market opened.
The S&P 500 (SPX) climbed by +1.17%. The Dow Jones Industrial Average (DJI) rose by +0.80%. The Russell 2000 (RUT) advanced +1.02%. The VIX Volatility Index fell further, declining -7.01% today.
Nine of the eleven S&P 500 (SPX) sectors gained today. Growth sectors led again with Consumer Discretionary (XLY +2.11%) and Technology (XLK +2.05%) at the top of the sector list. Energy (XLE -0.09%) and Utilities (XLU -0.85%) were the two declining sectors.
Existing Home Sales for February declined -7.2% month-over-month. Much more than the forecast of a -1.0% decline.
Brent Oil remained above $100, closing at $105 today. The US Dollar index (DXY) gained +0.22%. The US 30y and 10y Treasury yieldS declined while the 2y Treasury yield advanced. High Yield (HYG) and Investment Grade (LQD) Corporate Bond prices advanced. Gold and Silver declined. Timber continues to rise back toward its 2022 highs after dropping sharply this month.
The put/call ratio (PCCE) declined to 0.676. The CNN Fear & Greed index is in the middle of the Fear range as it moves back toward neutral. A drop in market volatility and less demand for safe-haven assets is driving the move in the index.
The big six made significant progress in their charts today. Nvidia (NVDA) is outperforming in the current rally, gaining +6.81% and well above its moving average lines. All six are above their 21d exponential moving average. Five are above their 50d moving average. Three of the six are above their 200d moving average.
Alibaba (BABA) topped the mega-cap list with a +7.90% gain, beating out Nvidia for the top spot. Verizon Communications (VZ) was at the bottom of the list, declining -2.98%.
In the Daily Update Growth List, UP Fintech (TIGR) was at the top. The company benefited from both the momentum in Chinese stocks and a great earnings report and outlook. The stock soared +33.66% today. The stock is up +73.42% for the week and over 100% from its low on Monday. The other Chinese stocks in the list also dominated the top spots.
Only two stocks declined in the growth list, Solar Edge (SEDG) declined -0.66% and Penn National Gaming (PENN) lost -0.11%.
-=x=-=x=-=x=-=x=-=x=-=x=-=x=-
Looking ahead
There is not much economic data scheduled for Monday, but Fed Chair Jerome Powell will speak in the morning.
Nike (NKE), Pinduoduo (PDD), and Tencent Music Entertainment (TME) report earnings on Monday.
-=x=-=x=-=x=-=x=-=x=-=x=-=x=-
Trends, Support, and Resistance
The Nasdaq moved above the 13,800 and closed right just above the 50d moving average line.
The one-day and five-day trend lines and the trend line from the 3/14 low all point to a gain of around 2% on Monday if the current momentum continues.
-=x=-=x=-=x=-=x=-=x=-=x=-=x=-
Wrap-up
I thought there might be a pullback in indexes today as investors take profits and protect from war news over the weekend. The optimism and high volume from expiring derivative contracts were enough to keep the strong rally from Monday's low alive.
Stay healthy and trade safe!

Nasdaq Break of market structure!There is a higher high, higher low! This indicate the downward trend had been reversed.
Target = 14378

Long NasdaqTime for Nasdaq to rebound!
Based on Gann Analysis i expect a rebound from 270 Angle that will reach Previous ATH

Daily Market Update for 3/17Summary: All sectors rose on Thursday as investors' worries eased about interest rate hikes and the war in Ukraine. However, oil prices are on the rise again and could create more volatility to close the week.
Notes
Ideas always welcome in the comments. Errors will be amended as comments on TradingView or corrected inline in my blog.
-=x=-=x=-=x=-=x=-=x=-=x=-=x=-
Thursday, March 17, 2022
Facts: +1.33%, Volume lower, Closing Range: 98%, Body: 84% Green
Good: Closing range, support at 21d EMA, advance/decline
Bad: Lower volume
Highs/Lows: Higher high, Higher low
Candle: Mostly green body with a tiny lower wick
Advance/Decline: 2.85, almost three advancing for every declining stock
Indexes: SPX (+1.23%), DJI (+1.23%), RUT (+1.69%), VIX (-3.75%)
Sector List: Energy (XLE +3.44%) and Materials (XLB +1.92%) at the top. Consumer Staples (XLP +0.69%) and Utilities (XLU +0.42%) at the bottom.
-=x=-=x=-=x=-=x=-=x=-=x=-=x=-
Market Overview
All sectors rose on Thursday as investors' worries eased about interest rate hikes and the war in Ukraine. However, oil prices are on the rise again and could create more volatility to close the week.
The Nasdaq rose +1.33%. Volume was lower than the previous day. The candle is covered by an 84% green body. A tiny lower wick formed when the index dipped to the 21d EMA. The closing range of 98% comes after a late afternoon rally. There were nearly three advancing stocks for every declining stock.
Small-caps outperformed today with the Russell 2000 (RUT) gaining +1.69%. The S&P 500 (SPX) and the Dow Jones Industrial Average (DJI) both rose by +1.23%. The VIX Volatility Index declined by -3.75%.
All S&P 500 sectors advanced. Energy (XLE +3.44%) and Materials (XLB +1.92%) were the top two as oil prices and commodity prices rose again. Consumer Staples (XLP +0.69%) and Utilities (XLU +0.42%) were at the bottom of the sector list.
Building Permits and Housing Starts in February were higher than forecasted. The weekly Initial Jobless Claims came in less than expected. There were only 214,000 claims vs the forecast of 220,000. The Philadelphia Fed Manufacturing Index for March showed much better conditions than expected, with the index registering 27.4 vs the expectation of 15.0.
The US Dollar Index (DXY) declined by -0.39%. US Treasury yields didn't move much but all declined a bit today. High Yield (HYG) and Investment Grade (LQD) Corporate Bond prices continued to rebound higher from their low points on Monday. Brent Oil closed the day above $100 again. Silver and Gold both were higher.
The put/call ratio (PCCE) declined to 0.709. The CNN Fear & Greed index moved back into the Fear range from Extreme Fear yesterday. The NAAIM money manager exposure index rose to 46.68 from exposure of 42.58 last week.
The big six all rose but more modestly than the previous two days. Tesla (TSLA) had the biggest gain, rising by +3.73% today. Amazon (AMZN) was next with a +2.70% gain. Nvidia (NVDA) closed above its 50d moving average, gaining +1.10%, and is not above all three moving averages I track.
Tesla topped the broader mega-cap list with its gain. At the bottom of the list was Alibaba (BABA), declining -4.39% as investors take profits from yesterday's massive rise for Chinese stocks.
Lemonade (LMND) topped the Daily Update Growth List, gaining +14.54%. The Chinese stocks that topped the list yesterday, were at the bottom of the list today. Niu Technologies (NIU) declined by -6.51%, landing at the bottom of the list.
-=x=-=x=-=x=-=x=-=x=-=x=-=x=-
Looking ahead
After the market opens on Friday, we'll have the Existing Home Sales stats for February.
Friday is a quadruple witching day for the market which means that derivatives for stock index futures, stock index options, stock options, and single stock futures all expire on the same day creating more volatility than usual in the market.
-=x=-=x=-=x=-=x=-=x=-=x=-=x=-
Trends, Support, and Resistance
The Nasdaq rose in the morning but then dipped back to the 21d EMA where it got support and then rose higher for the rest of the day.
The trend line from the 3/14 low is pointing at a +2.81% advance if this current rally can continue.
The one-day trend line ends with a +1.48% gain for tomorrow.
The five-day trend line points to a -0.29% decline.
-=x=-=x=-=x=-=x=-=x=-=x=-=x=-
Wrap-up
The market seems much more optimistic over the last few days. There's a big spike in stocks that are over their 50d moving average as the gains since Tuesday were broadly shared across the market. Still, after three days of big gains and investors wanting to protect from war news over the weekend, we may see some selling to end the week.
Stay healthy and trade safe!

Daily Market Update for 3/16Summary: The Fed brought no new surprises today, but the initial reaction caused a dip in indexes that reversed into a late after rally higher. Chinese stocks took off after the government pledged to support the stock market and not penalize companies with foreign listings.
Notes
Ideas always welcome in the comments. Errors will be amended as comments on TradingView or corrected inline in my blog.
-=x=-=x=-=x=-=x=-=x=-=x=-=x=-
Wednesday, March 16, 2022
Facts: +3.77%, Volume higher, Closing Range: 99%, Body: 71% Green
Good: Closing range of 99%, higher volume
Bad: Nothing
Highs/Lows: Higher high, Higher low
Candle: Gap up, large green body over long lower wick, not upper wick
Advance/Decline: 3.34, more than three advancing for every declining stock
Indexes: SPX (+2.24%), DJI (+1.55%), RUT (+3.14%), VIX (-10.59%)
Sector List: Consumer Discretionary (XLY +3.41%) and Technology (XLK +3.25%) at the top. Utilities (XLU -0.18%) and Energy (XLE -0.46%) at the bottom.
-=x=-=x=-=x=-=x=-=x=-=x=-=x=-
Market Overview
The Fed brought no new surprises today, but the initial reaction caused a dip in indexes that reversed into a late after rally higher. Chinese stocks took off after the government pledged to support the stock market and not penalize companies with foreign listings.
The Nasdaq closed +3.77% higher for the day. The index opened with a gap up which faded as the Fed interest rate news approached. When the news hit, the Nasdaq fell -1.92% in about 30 minutes but then reversed and climbed +3.42% from the intraday low. The wild session created a long lower wick that sites below a 71% green body and a 99% closing range. There were more than three advancing stocks for every declining stock.
The Russell 2000 (RUT) advance +3.14%. The S&P 500 (SPX) climbed by +2.24%. The Dow Jones Industrial Average (DJI) rose by +1.55%. The VIX Volatility Index fell -10.59%.
Nine of the eleven S&P 500 (SPX) sectors gained for the day. Growth sectors led with Consumer Discretionary (XLY +3.41%) and Technology (XLK +3.25%) at the top of the list. Utilities (XLU -0.18%) and Energy (XLE -0.46%) were the two losing sectors.
The Fed's decision was to raise interest rates by 25 basis points, a widely anticipated level for the first-rate hike. However, the Fed also announced plans to take on inflation aggressively with up to seven more rate hikes this year to end the year with a 1.75% to 2% interest rate. That aggressive stance was likely the reason for the initial reaction from investors.
In other economic news, Retail Sales and Core Retail Sales for February were less than forecast. Export Prices were higher and Import Prices were lower than forecast. Crude Oil Inventories were higher than expected.
The US Dollar index (DXY) fell by -0.62% with most of that coming after the Fed announcement. The US 30y Treasury Yield declined while the 10y and 2y Yield rose. High Yield (HYG) and Investment Grade (LQD) Corporate Bond prices rose. Brent Oil topped $100 briefly but ended the day with a decline.
The put/call ratio (PCCE) declined to 0.795. The CNN Fear & Greed index moved closer to Neutral but remained in the Extreme Fear range.
All of the big six advanced. Microsoft (MSFT), Alphabet (GOOG), and Nvidia (NVDA) rose above their 21d EMA lines. Amazon (AMZN) closed above both its 21d EMA and 50d MA.
Alibaba (BABA) topped the mega-cap list with a massive +36.76% gain as the Chinese government vowed to support public companies. Stocks at the bottom of the mega-cap list all had less than 1% declines. Johnson & Johnson was at the bottom of the list with a -0.92% decline.
23 stocks in the Daily Update Growth List gained over 10%. The six Chinese stocks in the list gained over 25%. The top stock was Futu Holdings which soared by +39.54%. Not a single stock in the list declined. CrowdStrike (CRWD) had the smallest gain, advancing by +0.54%.
-=x=-=x=-=x=-=x=-=x=-=x=-=x=-
Looking ahead
Building Permits and Housing Starts data for February will come in the morning. We will also get the weekly Initial Jobless Claims. Just before the market opens, the Industrial Production numbers for February will be released.
-=x=-=x=-=x=-=x=-=x=-=x=-=x=-
Trends, Support, and Resistance
The index met resistance at the 21d EMA in the morning, then got support at 13,000 in the afternoon dip, and finally climbed back to close above the 21d EMA.
Because of the sharp afternoon rally, even the one-day regression trend line points to a decline tomorrow, which would be -0.96%.
If the index returns to the five-day trend line, it would mean a -2.95% decline.
The trend line from the 2/10 high points to a -4.89%.
Just for some optimism, if we followed the trend line from the 3/14 low, it points to a +2.58% gain for Thursday.
-=x=-=x=-=x=-=x=-=x=-=x=-=x=-
Wrap-up
What a wild reaction to the Fed announcement. It may take some time to sort out where investors in both equities and bonds see the impact of the more hawkish fed. We might see some more volatility over the next few days as investors react to the Fed's new plans and any developments in Ukraine.
Stay healthy and trade safe!

MONTHLY TF NASDAQ COMPOSITE INDEX will it goes to 10430 soon This is my prediction for NASDAQ COMPOSITE INDEX . 100% wrong and if it goes right then its only coincidence. Only prediction. See you at 10430 soon then it will rebound from there to make Impulsive wave and tech will be in play again..

Daily Market Update for 3/15Summary: Oil prices dropped below 99.01 and the Producer Price Index indicated some relief on inflation, giving some assurance to investors that the Fed might not get too hawkish with interest rate hikes. That helped markets bounce to the upside on Tuesday.
Notes
Ideas always welcome in the comments. Errors will be amended as comments on TradingView or corrected inline in my blog.
-=x=-=x=-=x=-=x=-=x=-=x=-=x=-
Tuesday, March 15, 2022
Facts: +2.92%, Volume lower, Closing Range: 93%, Body: 74% Green
Good: Solid green candle, higher high/low, great closing range
Bad: Couldn't quite get above 13,000
Highs/Lows: Higher high, Higher low
Candle: Mostly green body, with a lower wick longer than upper wick
Advance/Decline: 1.33, more advancing than declining stocks
Indexes: SPX (+2.14%), DJI (+1.82%), RUT (+1.40%), VIX (-6.11%)
Sector List: Technology (XLK +3.36%) and Consumer Discretionary (XLY +3.35%) at the top. Real Estate (XLRE +0.79%) and Energy (XLE -3.66%) at the bottom.
-=x=-=x=-=x=-=x=-=x=-=x=-=x=-
Market Overview
Oil prices dropped below 99.01 and the Producer Price Index indicated some relief on inflation, giving some assurance to investors that the Fed might not get too hawkish with interest rate hikes. That helped markets bounce to the upside on Tuesday.
The Nasdaq rose +2.92%. Volume was lower than the previous day but still higher than the 50-day average volume. The candle has a 74% green body with a short lower wick and barely any upper wick, ending the day with a 93% closing range. There were more advancing stocks than declining stocks.
The S&P 500 (SPX) gained +2.14%, helped by the large mega-caps that performed well for the day. The Dow Jones Industrial Average (DJI) climbed by +1.82%. The Russell 2000 (RUT) gained +1.40%. The VIX Volatility Index fell by -6.11%, but remains elevated.
All S&P 500 sectors except for the Energy sector gained. Growth sectors topped the list. Technology (XLK +3.36%) and Consumer Discretionary (XLY +3.35%) were the top-performing sectors. Energy (XLE -3.66%) dropped as the price of oil plunged from its recent highs.
The Producer Price Index for February showed growth in prices of 0.8% compared to the forecast of 0.9%. The Core Producer Price Index, which excludes food and energy, rose by only 0.2% but was expected to rise 0.6%. The NY Empire State Manufacturing index showed worsening conditions for the sector, registering -11.80 compared to the forecast of +7.0.
Brent Oil fell below $100 for the first time since prices soared in the first week of March. The US Dollar index (DXY) declined by -0.08%. US 30y and 10y Treasury Yields rose while the 2y yield declined. High Yield (HYG) and Investment Grade (LQD) Corporate Bond prices rose. Silver and Gold prices continued to fall.
The put/call ratio (PCCE) declined to 0.907. The CNN Fear & Greed index is still in the Extreme Fear area.
The big six all gained today. Nvidia (NVDA) led the list of six with a +7.70% gain. Tesla (TSLA) advanced +4.63%. Microsoft (MSFT) and Amazon (AMZN) both gained around 3.9%.
Nvidia and Tesla also topped the broader mega-cap list. Only four mega-caps declined. Chevron (CVX) and Exxon Mobil (XOM) were at the bottom of the list with -5.06% and -5.69% declines.
Peloton rose +11.93% after getting positive commentary from an analyst at Bernstein. Only three stocks in the list had a decline, led by Sumo Logic which lost -1.42%.
-=x=-=x=-=x=-=x=-=x=-=x=-=x=-
Looking ahead
In the morning, Retail Sales data for February will be available. Sales are expected to be less than in January. Crude Oil Inventories will be available after the market opens.
The biggest news for tomorrow will be the Fed meeting and their interest rate decision which will come at 2p in the afternoon. Investors will also be interested in the interest rate projections for the rest of this year.
-=x=-=x=-=x=-=x=-=x=-=x=-=x=-
Trends, Support, and Resistance
The Nasdaq returned to the 13,000 support/resistance area. It was not able to close above the line, but could possibly move back above it tomorrow.
If the one-day trend line continues, expect a +1.28% advance for Wednesday.
If the index returns to the trend line from the 2/10 high, that would mean a -1.51% decline.
The five-day trend line points to a -2.88% decline for Wednesday.
-=x=-=x=-=x=-=x=-=x=-=x=-=x=-
Wrap-up
Finally, oil prices and the producer price index relieved some pressure from inflation worries. Markets reacted positively to the news and had a nice bump to the upside today. But investors will be even more sensitive to what comes from the Fed meeting tomorrow.
Stay healthy and trade safe!

Grand Super Cycle - Epic Crash Upward progression for 19.93%. Followed by a super crash 71.85%. Beginning between August 2021 and Jan 2022. Double bottom in December 2024.

Daily Market Update for 3/14Summary: Investors continued to move out of equities as the war continues in Ukraine and the Fed heads toward its first rate hike since the start of the pandemic.
Notes
Ideas always welcome in the comments. Errors will be amended as comments on TradingView or corrected inline in my blog.
-=x=-=x=-=x=-=x=-=x=-=x=-=x=-
Monday, March 14, 2022
Facts: -2.04%, Volume higher, Closing Range: 7%, Body: 59% Red
Good: Nothing
Bad: Long upper wick from failed rally, closing range
Highs/Lows: Lower high, Lower low
Candle: Long upper wick over a thick red body
Advance/Decline: 0.36, nearly three declining stocks for every advancing stock
Indexes: SPX (-0.74%), DJI (+0.00%), RUT (-1.92%), VIX (+3.32%)
Sector List: Financials (XLF +1.26%) and Health (XLV +0.71%) at the top. Technology (XLK -1.85%) and Energy (XLE -2.99%) at the bottom.
-=x=-=x=-=x=-=x=-=x=-=x=-=x=-
Market Overview
Investors continued to move out of equities as the war continues in Ukraine and the Fed heads toward its first rate hike since the start of the pandemic.
The Nasdaq declined by -2.04%. A rally in the morning failed to hold, creating a long upper wick above a thick red body covering 59% of the candle. The closing range was dismal at 7%, leaving behind a tiny lower wick. Volume was higher than the previous day.
Only the Dow Jones Industrial Average (DJI) avoided a loss for the day, but only climbed a fraction, ending the day even at +0.00%. The S&P 500 (SPX) declined by -0.74%. The Russell 2000 (RUT) dropped -1.92%. The VIX Volatility Index rose by +3.32%.
Four of the eleven S&P 500 sectors gained. Financials (XLF +1.26%) and Health (XLV +0.71%) were at the top of the sector list. Technology (XLK -1.85%) and Energy (XLE -2.99%) at the bottom. The Energy sector is pulling back from recent gains as the price of oil drops.
Brent Oil dropped to $103.55 per barrel. The US Dollar index (DXY) stayed about even, declining by just -0.04%. US Treasury Yields all rose sharply. High Yield (HYG) and Investment Grade (LQD) Corporate Bond prices dropped. Silver and Gold both declined.
The put/call ratio (PCCE) rose to 0.929. The CNN Fear & Greed index is in Extreme Fear but edged toward Neutral.
All of the big six declined. Tesla (TSLA) again was the worst of the six, declining -3.64%. Microsoft (MSFT) had the smallest decline but still dropped by -1.30%.
Pfizer (PFE) topped the mega-cap list for a second day, advancing +3.94% today. Likewise, Alibaba (BABA) was at the bottom of the list again, declining by -10.32%.
Only three of the Daily Update Growth List stocks advanced. PayPal (PYPL) topped the list with a +0.31% gain. Six stocks in the list declined more than 10%, with five of those stocks being Chinese companies. Ehang Holding (EH) was at the bottom of the list, declining by -16.45%.
-=x=-=x=-=x=-=x=-=x=-=x=-=x=-
Looking ahead
The February Producer Price Index (PPI) data will arrive in the morning. The data provides a forward-looking view on inflation pressures. The NY Empire State Manufacturing Index will also be available. API Weekly Crude Oil Stock will be published in the afternoon after the market closes.
-=x=-=x=-=x=-=x=-=x=-=x=-=x=-
Trends, Support, and Resistance
The Nasdaq moved toward its 40-month exponential moving average which provided a bottom for corrections in the past. The only corrections to break through that line are 2000, 2008, and 2020.
If the index returns to the trend line from the 2/10 high and the five-day trend line, that would mean a +1.64% gain for Tuesday.
The one-day trend line leads to a -3.29% decline.
-=x=-=x=-=x=-=x=-=x=-=x=-=x=-
Wrap-up
I saw some headlines today that said investors were moving into safe-haven assets but today we see the US dollar is steady, there are higher Treasury yields (selling bonds) and lower Silver and Gold prices. Cryptocurrencies aren't moving all that much. There certainly wasn't much interest in risk assets either.
The Fed meeting comes on Wednesday. Unless some huge surprise rate increase comes, I'd expect the market to move opposite of what it's doing now. Investors tend to overprotect heading into these events.
Stay healthy and trade safe!

markets will return to its median markets always correct overly high and low spikes .and in my opinion we will see more downward pressure until we get there.

Daily Market Update for 3/11Summary: Markets ended a choppy week with another losing session. Growth sectors sold off the most as investors moved to safer assets for the weekend.
Notes
Ideas always welcome in the comments. Errors will be amended as comments on TradingView or corrected inline in my blog.
-=x=-=x=-=x=-=x=-=x=-=x=-=x=-
Friday, March 11, 2022
Facts: -2.18%, Volume higher, Closing Range: 3%, Body: 94% Red
Good: Nothing
Bad: Mostly red body, lost support at 13,000
Highs/Lows: Higher high, Lower low
Candle: Outside day, long red body, tiny wicks
Advance/Decline: 0.44, more than two declining stocks for every advancing stock
Indexes: SPX (-1.30%), DJI (-0.69%), RUT (-1.59%), VIX (+1.72%)
Sector List: Utilities (XLU -0.34%) and Financials (XLF -0.71%) at the top. Communications (XLC -1.80%) and Consumer Discretionary (XLY -1.92%) at the bottom.
Expectation: Sideways or Higher
-=x=-=x=-=x=-=x=-=x=-=x=-=x=-
Market Overview
Markets ended a choppy week with another losing session. Growth sectors sold off the most as investors moved to safer assets for the weekend.
The Nasdaq closed lower by -2.18% on higher volume than the previous day. The 94% red body is surrounded by tiny upper and lower wicks. A 3% closing range represents the selling throughout the day and into the final minutes of the market. There were more than two stocks that declined for every advancing stock.
The S&P 500 (SPX) slid -1.30% and the Dow Jones Industrial Average (DJI) lost -0.69%. The Russell 2000 (RUT) declined by -1.59%. The VIX Volatility index rose by +1.72%.
All S&P 500 sectors declined today. Utilities (XLU -0.34%) and Financials (XLF -0.71%) were at the top. Communications (XLC -1.80%) and Consumer Discretionary (XLY -1.92%) had the biggest declines.
Michigan Consumer Expectations and Consumer Sentiment for March were lower than forecast, possibly weighed down by the war in Ukraine.
The US Dollar index (DXY) rose +0.61%. The US 30y Treasury Yield declined while the 10y and 2y yields rose. High Yield (HYG) and Investment Grade (LQD) Corporate Bond prices declined. Brent Oil prices rose but remained below $110 a barrel. Silver and Gold declined, but not much compared to the rising strength of the US dollar.
The put/call ratio (PCCE) rose to 0.863. The CNN Fear & Greed Index remained in Extreme Fear. The NAAIM money manager exposure index rose to 42.58, from 30.3 the previous week. The survey of money managers is taken on Wednesday evenings and the market rose this past Wednesday before dipping again on Thursday and Friday.
All of the big six declined. Tesla (TSLA) fell the most, losing -5.12%.
Pfizer (PFE) was the top mega-cap for the, advancing +2.17%. Alibaba (BABA) was at the bottom of the mega-cap list, declining by -6.68%.
Only two of the stocks in the Daily Update Growth List gained. Chewy (CHWY) rose +2.27% while Solar Edge (SEDG) gained +0.89%. Five of the growth stocks declined more than 10%. DocuSign (DOCU) fell -20.10% after providing weak guidance and an analyst downgraded the stock and dropped its price target from $175 to $100.
-=x=-=x=-=x=-=x=-=x=-=x=-=x=-
Looking ahead
There is not much scheduled US economic news to start the week. Wednesday will bring the Fed's meeting and final interest rate decisions.
-=x=-=x=-=x=-=x=-=x=-=x=-=x=-
Trends, Support, and Resistance
The Nasdaq held for a while around the 13,000 mark but then dropped below that area later in the afternoon.
If the index returns to the five-day trend line, that would mean a +1.79% gain for Monday.
The trend line from the 2/10 high, points to a +0.53% advance.
The one-day trend leads to a -1.56% decline to start the week.
-=x=-=x=-=x=-=x=-=x=-=x=-=x=-
Wrap-up
It was a crazy week. It looked like investors were optimistic on Wednesday but the gains were given back to losses by the end of the day Friday. Given the big decline was likely from investors closing positions to avoid bad news over the weekend, we might see a bounce on Monday. However, expect more volatility until we find a firm bottom with support.
The expectation for Monday is Sideways or Higher.
Stay healthy and trade safe!
