IXIC trade ideas

Head and shoulders, anyone??Gotta hold this neckline or it gets ugly very quickly. It's not only tech, the entire risk on trade will unwind fast. My guess is stimulus gets us back above if we do happen to peak below.
Needless to say, it's slippery so act accordingly. Taking all PTP Trend Trader shorts all week. Will look to take the long trades after liquidity injection.


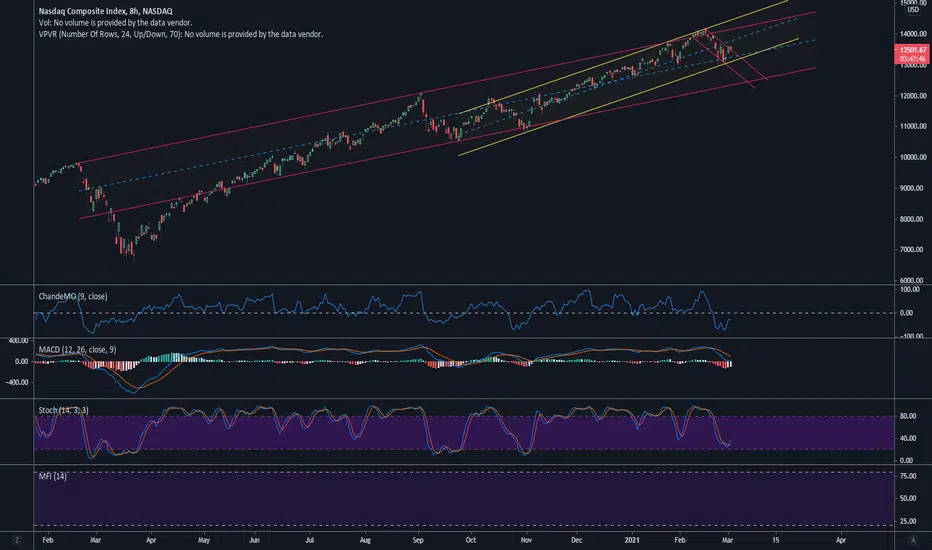
Daily Market Update for 3/2Trend lines drawn from the 2/16 ATH (11d), 2/24 (5d) and today 3/2 (1d).
Ideas always welcome in the comments. Errors will be amended as comments on TradingView or corrected inline in my blog.
-=x=-=x=-=x=-=x=-=x=-=x=-=x=-
Tuesday, March 2, 2021
Facts: -1.69%, Volume lower, Closing range: 3%, Body: 97%
Good: Stayed above 50d MA
Bad: All red body, no visible upper/lower wicks, back below 21d EMA
Highs/Lows: Higher high, lower low
Candle: Marubozu black candle with no wicks, all red body, outside day
Advance/Decline: More than three declining stocks for every advancing stock
Indexes: SPX (-0.81%), DJI (-0.46%), RUT (-1.93%), VIX (+3.21%)
Sectors: Materials (XLB +0.56%) only gaining sector. Consumer Discretionary (XLY -1.15%) and Technology (XLK -1.59%) were bottom.
Expectation: Sideways or Lower
-=x=-=x=-=x=-=x=-=x=-=x=-=x=-
Market Overview
The market gave up half of yesterday's gains in a continuation of two weeks of choppiness as investors await a stimulus bill that will have both positive and negative impacts on equities. Today's expectation breaker after yesterday's session requires a deeper look to understand. Investment has been rotating in and out of Consumer Discretionary and Technology for the past two weeks.
The Nasdaq closed the day with a -1.69% decline on lower volume. The 97% red body with no visible upper and lower wick forms a Marubozu (shaven head) candlestick. The 3% of lower wick was formed in just the last few minutes of trading as most of the day was dominated by selling. There were three declining stocks for every advancing stock.
The S&P 500 (SPX) and Dow Jones Industrial average (DJI) lost -0.81% and -0.46%. The Russell 2000 (RUT) turned in the worst performance of the day with a -1.93% decline.
The VIX volatility index advanced +3.21%
Materials (XLB) was the only gaining sector with a +0.56% advance. Also near the top of the sector list, but with a small loss, was Industrials (XLI) which declined -0.29%. Both sectors are likely to benefit from infrastructure projects planned to boost economic recovery. The bottom two sectors were also the only two to underperform the SPX. They were Consumer Discretionary (XLY -1.15%) and Technology (XLK -1.59%).
-=x=-=x=-=x=-=x=-=x=-=x=-=x=-
Economic Indicators
The US Dollar (DXY) declined -0.25%.
Yields on the 30y treasury bonds remained about the same while the 10y yields dropped. The 2y treasury bond yields remained flat.
High Yield Corporate Bonds (HYG) and Investment Grade Corporate Bond (LQD) prices both dropped for the day.
Silver (SILVER) and Gold (GOLD) both advanced for the day. Crude Oil (CRUDEOIL1!) advanced slightly after declining yesterday. Timber (WOOD) declined. Copper (COPPER1!) and Aluminum (ALI1!) both advanced considerably, moving up alongside the performance in the Materials sector.
-=x=-=x=-=x=-=x=-=x=-=x=-=x=-
Investor Sentiment
The put/call ratio dropped slightly to 0.578 as investors moved back to a bullish level. The put/call ratio (PCCE) is a contrarian indicator that shows overly bullish or overly bearish investor behavior. The 0.7 level is considered normal. As it approaches 0.60 (overly bullish) and below, watch for a possible pullback in the market.
The CNN Fear & Greed index is lower than the previous day, but still in the greed range.
-=x=-=x=-=x=-=x=-=x=-=x=-=x=-
Market Leaders
All of the big four mega-caps had losses for the day. Alphabet (GOOGL) is the only of the four trading above the 21d EMA. Microsoft (MSFT) closed below the 21d EMA, but is still trading above the 50d MA. Apple (AAPL) and Amazon (AMZN) are trading below both lines and their 21d EMA is below the 50d MA as they continue to look bearish.
AT&T (T), Coca-Cola (KO) were among a short list of mega-caps that had gains for the day. Tesla (TSLA) was at the bottom of the list -4.45%, down 20% from yesterday's intraday high.
Square (SQ) and Dr Horton (DHI) were the only two growth stocks for the daily update with gains, advancing +4.65% and 1.47%. NIO (NIO) dropped -13.0% after a disappointing earnings release. Zoom Video (ZM) dropped -9.00% after gapping up and then giving up 15% in intraday selling.
-=x=-=x=-=x=-=x=-=x=-=x=-=x=-
Looking ahead
There is an OPEC Meeting scheduled for tomorrow that will impact crude oil prices and likewise the energy sector. Crude Oil Inventories will also be released later in the day. The weekly stock numbers released today were higher than expected.
Non-farm Employment data before market open will give an update on the labor market.
Just after the market opens, Services and Non-Manufacturing purchasing data will give a heads up on activity levels for the two sectors.
Wednesday's earnings reports include Snowflake (SNOW), Okta (OKTA), Marvell (MRVL), Splunk (SPLK), and Dollar Tree (DLTR). Check the companies in your portfolio for earnings reports so you are not surprised.
-=x=-=x=-=x=-=x=-=x=-=x=-=x=-
Trends, Support and Resistance
The five-day trend line is pointing to a +0.65% gain for tomorrow.
The one-day trend line points toa -0.39% while the trend-line from the 2/16 ATH is pointing to a -1.52% loss. Both of those moves would put the index back below the 50d MA.
If there is further downside, the index held the 13,000 area as support in the previous two weeks. The 12,550 area also held in an early January dip. If it passes that area, the next support area is 12,250.
-=x=-=x=-=x=-=x=-=x=-=x=-=x=-
Wrap-up
Looking at Monday and Tuesday, it seems like another choppy week is ahead. Today was dominated by selling, and with a thick red bodied candle, the expectation tomorrow has to be for Lower. Since there is support at the 50d MA, we can also expect a Sideways move.
If there is a positive expectation breaker, then a gain on higher volume that takes the index back above the 21d EMA would provide confidence in a rally attempt.
Stay healthy and trade safe!


nasdaq - head and shoulder formationa head and shoulder pattern formation on the nasdaq that seems pushing index down to correction territory...

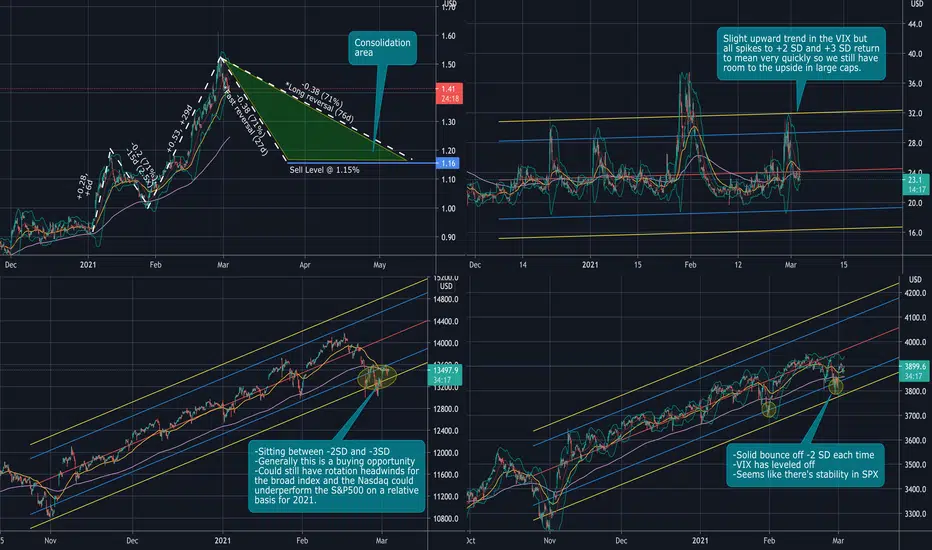
Upward momentum not broken (for now)Interest rates are in consolidation mode for 1-2 months or so. Unless interest rates spike again I expect a continuation upward for the S&P500. The Nasdaq definitely has headwinds as a whole because of the huge run it had last year and it will likely be a stock-pickers market when it comes to technology-related areas.
Daily Market Update for 3/1Trend lines drawn from the 2/16 ATH (10d), 2/23 (5d) and today 3/1 (1d).
Ideas always welcome in the comments. Errors will be amended as comments on TradingView or corrected inline in my blog.
-=x=-=x=-=x=-=x=-=x=-=x=-=x=-
Monday, March 1, 2021
Facts: +3.01%, Volume lower, Closing range: 97%, Body: 78%
Good: Strong buying throughout day, close above 21d EMA
Bad: Nothing
Highs/Lows: Higher high, higher low
Candle: Thick green body with short upper/lower wicks, slightly longer lower wick
Advance/Decline: More than three advancing stocks for every declining stock
Indexes: SPX (+2.38%), DJI (+1.95%), RUT (+3.37%), VIX (-16.46%)
Sectors: Technology (XLK +3.22%) and Financials (XLF +3.13%) were top. Consumer Staples (XLP +1.01%) and Real Estate (XLRE +0.11%) were bottom.
Expectation: Higher
-=x=-=x=-=x=-=x=-=x=-=x=-=x=-
Market Overview
Monday kicked off the week with an upside reversal from last week's downtrend. A small gap up was closed early in the session that was dominated by buying the rest of the day. The gains were large and broad across the market as manufacturing data released in the morning was better than expected.
The Nasdaq closed the day with a +3.01% gain. Volume was lower than Friday. The closing range of 97% represented the buying that continued into close after gains throughout the day created a 78% green body. More than three stocks gained for every declining stock.
The Russell 2000 (RUT) returned to the top of the index list with a +3.37% gain on optimism for stimulus to soon pass through congress. The S&P 500 (SPX) advanced +2.38%. The Dow Jones Industrial (DJI) gained +1.95%. Most importantly, all of the major indexes closed back above their 21d EMA, a key line for support and resistance.
The VIX volatility index dropped -16.46% after gaining over 26% last week.
All sectors gained for the day with Technology (XLK +3.22%) and Financials (XLF +3.13%) leading the list. Energy led for half the session before dropping back behind the other sectors. Consumer Staples (XLP +1.01%) and Real Estate (XLRE +0.11%) were the worst performing.
-=x=-=x=-=x=-=x=-=x=-=x=-=x=-
Economic Indicators
The US Dollar (DXY) gained +0.14%.
Yields on 30y treasury bonds gained while 10y yields stayed about even. 2y treasury yields dropped for a second day after spiking last Thursday.
Prices on High Yields Corporate Bonds (HYG) rose for the day will Investment Grade (LQD) corporate bonds dropped slightly.
Silver (SILVER) and Gold (GOLD) declined. Crude Oil (CRUDEOIL1!) declined. Timber (WOOD) advanced. Copper (COPPER1!) and Aluminum (ALI1!) both declined.
-=x=-=x=-=x=-=x=-=x=-=x=-=x=-
Investor Sentiment
The put/call ratio rose slightly to 0.823. The put/call ratio (PCCE) is a contrarian indicator that shows overly bullish or overly bearish investor behavior. The 0.7 level is considered normal. As it approaches 0.60 (overly bullish) and below, watch for a possible pullback in the market.
The CNN Fear & Greed index moved back to the Greed side but not yet Extreme Greed.
-=x=-=x=-=x=-=x=-=x=-=x=-=x=-
Market Leaders
All of the big four mega-caps closed the day with gains. Unlike Friday's gains, today's gains look more bullish, albeit the volume is lower. Microsoft (MSFT) closed back above the 21d EMA, joining Alphabet (GOOGL) which had recovered the line on Friday. Apple (AAPL) and Amazon (AMZN) are still trading below both the 21d EMA and 50d MA.
Tesla (TSLA) was the top mega-cap of the day with a 6.26% gain. Apple, PayPal (PYPL) and Exxon Mobile (XOM) round out the top four mega-caps. Most mega-caps gained for the day.
All of the growth stocks I track for the daily update had gains for the day. Digital Turbine (APPS) was the big winner with a 14.74% gain, nearly climbing back to its all-time high. Grow Generation (GRWG), Draft Kings (DKNG) and Etsy (ETSY) were other growth stock with greater than 10% gains.
Zoom Video (ZM) is up +8.60% after hours, providing a strong earnings beat and guidance for 2021 in their earnings update. NIO (NIO) and Lemonade (LMND) both were down after hours, disappointing investors with their earnings report. NIO had a greater loss than expected, despite strong revenue. Lemonade did not provide a strong outlook.
-=x=-=x=-=x=-=x=-=x=-=x=-=x=-
Looking ahead
There is not a lot of economic news scheduled for Tuesday. FOMC Members Brainard and Daly are scheduled to speak in the afternoon. API Weekly Crude Oil Stock will be released after market close.
Tuesday earnings releases will include Sea (SE), Target (TGT), Veeva Systems (VEEV), Ross Stores (ROST), and Kopin (KOPN). Check the companies in your portfolio for earnings reports so you are not surprised.
-=x=-=x=-=x=-=x=-=x=-=x=-=x=-
Trends, Support and Resistance
The one-day trend line points to a +4.39% gain for Tuesday. That's still well below the 14,000 area where possibly the index would find resistance.
The five-day trend line points to a -1.06% loss. The index closed in the upper half of the five-day regression trend channel. A return to the center of the channel would put the index back in the middle of the 21d EMA and 50d MA.
The trend-line from the 2/16 ATH is pointing to a -3.42% loss that puts the index back below the 50d MA and above the 13,000 support area.
If there is further downside, the index held the 12,550 area in an early January dip. If it passes that area, the next support area is 12,250.
-=x=-=x=-=x=-=x=-=x=-=x=-=x=-
Wrap-up
The downward trend and indecisive Friday made the expectation for today of Sideways or Lower, but with the hopes for an expectation breaker.
We got that expectation breaker today thanks to positive news over the weekend on the stimulus as well as signs that treasury bond yields had topped and would come back down. The US Dollar also strengthened considerably against other currencies, thanks to a positive outlook on the US economy and controlled inflation.
Expectation for tomorrow is a continuation and move higher. If that doesn't happen, then we'll take another look for indications on why not. Another positive gain, but with more volume would be a confidence booster.
Stay healthy and trade safe!

What might happen to the market in coming weeks/monthsThis is my favorite analysis
I give my qualified bid here on how NASDAQ and the market are going to evolve.
the graph is very similar to the financial crisis and makes exactly the same pattern, on top, bottom, RSI and MACD.
10-y bond have fallen and as I wrote in my other analysis, bonds will return to 0.95 and up again to 1.5. it's making a cup and handle now.
Follow the dates on the 1,2,3,4,5 wave and compare it with 10-y bond, and financial crisis(15. march 2011 to 17. june 2011).

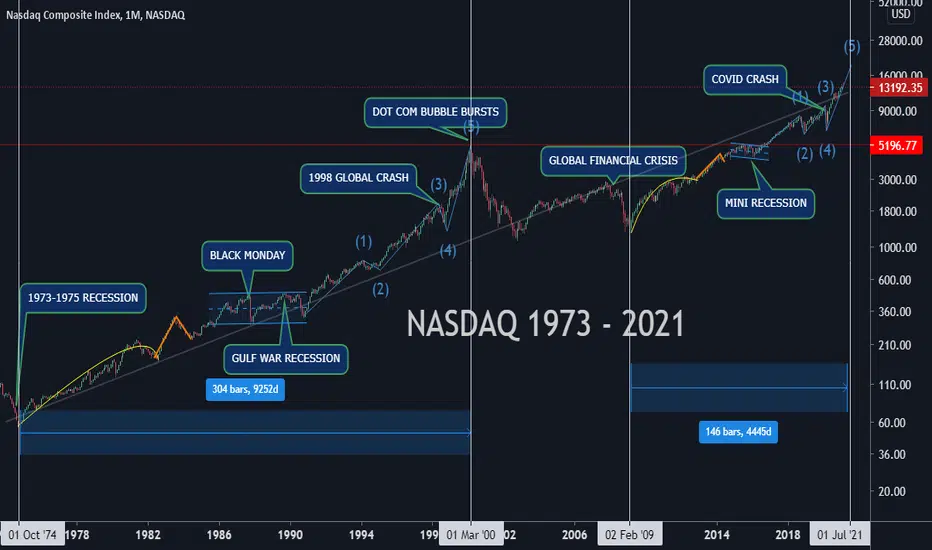
NASDAQ Will Have a Blowoff Top by AugustI have studied the hell out of this, and I can say for certain we are about to experience a wild bull run and then a blowoff top. This is the final stage of a 12.5 year cycle.
This exact cycle took place from 1974 - 2000.
The Nasdaq from 1974-2021 looks identical to Bitcoin from 2015-2021. In 2015 the charts obviously did not look the same at all. Bitcoin has mirrored 48 years of the NASDAQ immaculately, except it did it in 6-7 years. Bitcoin is now only slightly behind the NASDAQ and on pace to catch up within two months.
This may be the most significant long term chart comparison in history and nobody is talking about it. Both are set to have a blowoff top by the summer, It's undeniable.
Market Week In Review - 2/22/2021 - 2/26/2021The Market Week in Review is my weekend homework where I look over what happened in the previous week and what might come in the next week. It helps me evaluate my observations, recognize new data points, and create a plan for possible scenarios in the future.
I do occasionally have some errors or typos and will correct them in my blog or in the comments on TradingView. I do not have an editor and do this in my free time.
If you find this helpful, please let me know in the comments. I am also more than happy to add new perspectives and data points if you have ideas.
The structure is the following:
A recap of the daily updates that I do here on TradingView.
The Meaning of Life, a view on the past week
What's coming in the next week
The Bullish View, The Bearish View
Key index levels to watch out for
Wrap-up
If you have been following my daily updates, you can skip down to the “The Meaning of Life”. If not, then this first part is a great play-by-play recap for the week. Click the original charts for more detail each day.
-=x=-=x=-=x=-=x=-=x=-=x=-=x=-
Monday, February 22, 2021
Facts: -2.46%, Volume lower, Closing range: 1%, Body: 80%
Good: Nothing
Bad: Gap down, thick red body, rejected trying to regain the 21d EMA
Highs/Lows: Lower high, lower low
Candle: Mostly red body under a short upper wick, nearly zero lower wick
Advance/Decline: 0.46, 2 declining stocks for every advancing stock
Indexes: SPX (-0.77%), DJI (+0.09%), RUT (-0.69%), VIX (+6.35%)
Sectors: Energy (XLE +3.46%) Financials (XLF +0.39%) were top. Technology (XLK -2.21%), Consumer Discretionary (XLY -2.11%)
Expectation: Lower
It was a tough day for the Nasdaq, big tech, and growth stocks. On days like this, it is important to take a step back and view things from both sides. Avoid trying to make predictions. In this daily update let's look at what's going on more broadly, set an expectation for the index tomorrow and look for a follow-through or an expectation breaker.
The Nasdaq closed the day with a -2.46% decline. The volume was lower, but the move was decisive with a thick red 80% body and a dismal 1% closing range. The candle's short upper wick and nearly invisible lower wick represent a day where the bears ruled on the Nasdaq. Over two stocks declined for every advancing stocks.
-=x=-=x=-=x=-=x=-=x=-=x=-=x=-
Tuesday, February 23, 2021
Facts: -0.5%, Volume higher, Closing range: 88%, Body: 39%
Good: Support at 13,000, successful retest at 50d MA, close in upper half of range
Bad: Gap down and 50d MA violation to morning low
Highs/Lows: Lower high, lower low
Candle: Green body in upper half of candle with longer lower wick
Advance/Decline: 0.31, 3 declining stocks for every advancing stock
Indexes: SPX (+0.13%), DJI (+0.05%), RUT (-0.88%), VIX (-1.45%)
Sectors: Energy (XLE +1.65%) and Utilities (XLU +0.83%) were top. Technology (XLK -0.28%) and Consumer Discretionary (XLY -0.66%) were bottom.
Expectation: Sideways or Higher
Nerves of steel. That's what it took to keep your eyes on the market today. The Nasdaq opened up with a gap down and pierced below the 50d MA to reach the intraday low within 10 minutes of open. It finally found support at the 13,000 area and made a climb back above the 50d MA. After a retest of that area, it was finally able to climb to an afternoon high before pulling back slightly into close.
The index closed with a -0.5% loss which is better than where you might have expected to end up from the morning action. The volume was higher than the previous day and a long lower wick formed under a 39% green body that led to an 88% closing range. The candlestick almost resembles a bullish reversal hammer, but the body is a little thick for a perfect pattern. Still, the spirit of the hammer candlestick, that the market maybe found a bottom, is still represented in the intraday pattern. There were 3 declining stocks for every advancing stock.
-=x=-=x=-=x=-=x=-=x=-=x=-=x=-
Wednesday, February 24, 2021
Facts: +0.99%, Volume lower, Closing range: 97%, Body: 62%
Good: Another quick test at the 50d MA before climbing the rest of the day
Bad: Not much
Highs/Lows: Higher high, higher low
Candle: Thick green body at top of the candle, longer lower wick
Advance/Decline: 1.99, 2 advancing stocks for every declinging stock
Indexes: SPX (+1.14%), DJI (+1.35%), RUT (+2.38%), VIX (-7.66%)
Sectors: Energy (XLE +3.54%) and Financials (XLF +1.94%) were top. Consumer Staples (XLP -0.06%) and Utilities (XLU -1.17%)
Expectation: Higher
Thank you Jerome Powell. Fears of inflation gave way to more bullish sentiment as investors anticipate a new round of stimulus coming soon. The tech sector stopped it's multiple day decent and all of the major indexes turned in gains for the day.
The Nasdaq ended the day with a +0.99% gain. The confirmation of yesterday's bullish reversal candle resulted in a higher high and a higher low after the index successfully tested the 50d MA in the morning. The 97% closing range and 62% green body sit above a longer lower wick that result from a brief morning dip. Two stocks advanced for every declining stock.
-=x=-=x=-=x=-=x=-=x=-=x=-=x=-
Thursday, February 25, 2021
Facts: -3.52%, Volume higher, Closing range: 10%, Body: 73%
Good: Stayed above 13,000
Bad: Thick red body, low closing range, selling all day
Highs/Lows: Lower high, Lower low
Candle: Thick red body with an upper wick from a brief morning upward move
Advance/Decline: Over eight declining stocks for every advancing stocks
Indexes: SPX (-2.45%), DJI (-1.75%), RUT (-3.69%), VIX (+35.88%)
Sectors: Utilities (XLU -0.90%) and Healthcare (XLB -1.00%)) were top.
Expectation: Lower
Caution turns to fear. There is not much positive to look at in today's indexes or the market indicators I use for the daily update. Nonetheless, it's best to look at both sides of action and set some expectations and a plan for tomorrow.
The market opened with mixed economic news. Initial Jobless Claims and Durable Goods Orders were better than expected, but Q4 GDP and Pending Home Sales for January were disappointing. After a quick rise in the first minutes, the market started a sell-off that lasted the rest of the day. A brief rally as the afternoon started quickly stalled and reversed.
The Nasdaq closed the day with a -3.52% loss. With higher volume and the breadth of the selling, it was clearly a distribution day. The 10% closing range left the index near it's late-in-the-day low with a 73% red body covering the candle. The only positive is that the index held support above the 13,000 area. Every stock declined except GME and AMC. Not really, but feels like that.
-=x=-=x=-=x=-=x=-=x=-=x=-=x=-
Friday, February 26, 2021
Facts: +0.56%, Volume lower, Closing range: 49%, Body: 12%
Good: Successful test of 13,000 again
Bad: Lower high, lower low, indecisive spinning top candle, close below 50d MA
Highs/Lows: Lower high, Lower low
Candle: Thin red body in the middle of candle, long upper and lower wicks
Advance/Decline: More than two declining stocks for every advancing stock
Indexes: SPX (-0.48%), DJI (-1.50%), RUT (+0.04%), VIX (-3.25%)
Sectors: Technology (XLK +0.53%) and Consumer Discretionary (XLY +0.42%) were top. Energy (XLE -2.37%) and Financials (XLF -1.91%) were bottom.
Expectation: Sideways or Lower
A week dominated by selling ended with a day of indecision. Investor fears of inflation were lifted a bit by economic data that showed inflation might not be as accelerated as thought. Consumer sentiment numbers rose. Personal spending was lower than expected. That resulted in rising treasury bond yields to back off a bit and the US Dollar to strengthen.
The Nasdaq closed the day with a +0.56% gain on lower volume. The thin 12% body is in the middle of a candle with longer upper and lower wicks. The closing range very near to the open and in the center of the candle at 49% shows as a spinning top candle. The candle is a sign of indecision as both the bulls and the bears had moments throughout the trading session without a winner. There were more than two declining stocks for every advancing stock.
-=x=-=x=-=x=-=x=-=x=-=x=-=x=-
The Meaning of Life (View on the Week)
It started on Monday with a gap down to open the week, a brief climb in the morning, and then a sell-off that would set the tone for the rest of the week. For the broader market, it looked more like a rotation that just hit the tech-heavy Nasdaq and mega-caps while the rest of the market was OK. The small-cap Russell 2000 barely dipped for the day.
Tuesday brought the hammer. Another gap down and a huge sell-off in the morning that took the Nasdaq down 4% before finding support at the 13,000 level and climbing back above the 50d moving average for the close. It seemed the market may have found a local bottom for this pullback. Although Tuesday was another day of losses for big tech, there were other positives. The Dow Jones Industrial average hit a new all-time high. Eight out of eleven SPDR sectors ended the day with gains. Despite those positives, three stocks declined for every advancing stock on the Nasdaq.
Because of the hammer candlestick on Tuesday, the expectation was for a move higher on Wednesday to confirm the upside reversal. That expectation was fulfilled with a positive gain. Comments from Fed Chairman Jerome Powell seemed to calm fears of inflation and rising bond yields. Energy and Financials sectors moved back to the top of the sector list. Two stocks advanced for every declining stock. The VIX volatility index returned to normal levels. Corporate bond prices rose. Commodities advanced. Everything looked bullish.
So what happened? Was the repeated increase in volatility to stocks like GME and AMC enough to spook the market? Could it be the bullish rise in the index was driven by overly bullish investors causing a dip of the put/call level to 0.5? The short rally day did not have the volume to give it strength and futures faded into Thursday's open. Perhaps the fed's reassurances were not enough, yields continued to rise and scare investors from the potential impact of higher interest rates.
Thursday turned out to be a crushing session where every sector declined, every cap segment lost and it seemed like every stock except GME and AMC were sold off. There were over eight declining stocks for every advancing stock. Treasury bond yields, especially short term, spiked, causing more selling among equities. Corporate bonds sold off sharply as investors considered higher possibility of defaults. The mega-caps busted. Growth stocks reversed. Dogs and cats started living together. It was clearly a distribution day.
There was one positive to Thursday. 13,000. That area was tested three times this week and held.
Friday brought another test of the 13,000 but then a turnaround for the Nasdaq lifted the index into the afternoon. Although treasury bond yields came back down a bit, the US dollar strengthened and commodity prices dipped. Gains were isolated to Technology, Communications, and Consumer Discretionary. After hitting the intraday highs twice, investors sold in the final few minutes of the day to have the index return close to its open for the session. That created an indecisive spinning top candle for Friday and left us wondering over the weekend what will come next.
The Nasdaq closed the week down -4.92%. Volume was lower than the previous week in our indicator, but other data sources show volume as higher for the week. The closing range of 25% marks a second week in a row where the closing range is below 40%.
The Nasdaq remained within a parallel channel drawn from the March 2020 bottom. The last time the index tested the bottom channel line was the last week of October. The following week, the index recovered with a 9% gain. So we'll mark that as a level to watch later in this review.
The S&P 500 (SPX) declined -2.45% for the week. The Dow Jones Industrial average (DJI) declined -1.78%. The Russell 2000 (RUT) lost -2.90%.
The VIX volatility index closed the week with a +26.76% gain, but still well below highs of January and October.
It's a good week to take a close look at the sectors and see how the market moved around during pullbacks in the major indexes.
Energy ( XLE ) and Financials ( XLF ) were joined at the hip, finding themselves at the top of the sector list on Monday and Wednesday and at the bottom of the list on Friday. However the days spent at the top were enough to allow them to end the week in 1st and 2nd place.
However, Energy was the only sector that could keep gains to end the week in the positive.
Consumer Discretionary ( XLY ) and Technology ( XLK ) took a beating throughout the week as investors moved away from these sectors fearing the impact of inflation and higher interest rates.
Utilities ( XLU ) is usually in play when investors are nervous. It showed up at the top of the list on Tuesday and Thursday, but ended the week at the bottom of the list.
The cyclical stocks Industrials ( XLI ) and Materials ( XLB ) outperformed the SPX for a second week. Along with Energy and Financials, these cyclical sectors were top performers for the whole month of February.
US 30y and 10y Treasury Bond yields continued to rise and widen the gap with shorter term treasury bonds. The rising bond yields are a big part of what is spooking investors who are concerned about the impact on corporate costs to service debt. As yields continue to rise, investors will price it into the market indiscriminately by avoiding specific sectors.
High Yields Corporate Bonds (HYG) and Investment Grade (LQD) corporate bonds both declined for another week. The yield spread widened between high yield corporate bonds and short term treasury bonds.
The US Dollar (DXY) advanced +0.57% for the week. Most of that gain came on Friday after pricing data showed inflation may not be as bad as expected. Also consumer sentiment data was stronger than expected. Investors sold riskier currencies and bought the US Dollar as a safer investment.
Currencies such as the Australian Dollar and the Swiss Franc, that were outperforming the dollar in 2020, sold off sharply at the end of the week. That's an interesting change to keep an eye on for the coming weeks.
Silver (SILVER) and Gold (GOLD) both declined for the week.
Crude Oil Futures (CRUDEOIL1!) continued the rise and is now at its highest price since November 2018.
Timber (WOOD) declined for the week. Copper (COPPER1!) and Aluminum (ALI1!) both gained for the week, despite having a few days of showing weakness.
Some of the impact on commodity prices is due to the sudden strengthening of the US dollar.
-=x=-=x=-=x=-=x=-=x=-=x=-=x=-
The Big Four Mega-caps
All four big mega-caps declined for the week. Apple (AAPL) and Amazon (AMZN) had the biggest declines with losses of -6.63% and -4.83%, respectively. Microsoft (MSFT) and Alphabet (GOOGL) did a little better with declines of -3.56% and -3.20%. Referring to the chart above you can see that Microsoft and Alphabet are both still above their 10w moving average and outperforming the Nasdaq (relative candle indicator at bottom of each chart).
Apple and Amazon are trading below their 10w moving average and Amazon is just above the 40w moving average. Both are underperforming the broader index.
While the big four mega-caps and growth stocks are struggling the past few weeks, what segments are doing well? Many of the stocks that were down in 2020 due to the pandemic are performing well relative to the market now. That confirms the despite the fears about higher yields driving interest rates higher, investors are still confident that the economy is recovering and that recovery will bring relief to industries hit hard during the pandemic.
That doesn't mean to rush out and buy these recovery stocks. We still need the overall market to perform well. If we are entering a more severe correction, there are always industries and stocks that move down last. In a correction, everything eventually gets hit. However, if we find more support at 13k and the market can stabilize then finding these opportunities could be profitable.
-=x=-=x=-=x=-=x=-=x=-=x=-=x=-
Investor Sentiment
The put/call ratio (PCCE) ended the week at 0.810, showing a move to more caution among investors. The indicator hit near 0.5 earlier in the week as investors became overly bullish just before Thursday's sell-off. Even as the market sold off on Thursday, investors poured money into the leveraged TQQQ ETF. It was the top ETF inflow for the day.
A contrarian indicator, when the put/call ratio is below 0.7, it signals overly bullish sentiment which typically proceeds a pullback in the market. The indicator was at 0.458 just before the September correction and it was at 0.489 just before the short October correction.
The CNN Fear & Greed index moved into the Fear side for the first time since January.
Money managers are at a 85 leveraged level as measured by the NAAIM Exposure Index. That's down from being over 100 for the past two weeks.
-=x=-=x=-=x=-=x=-=x=-=x=-=x=-
The Week Ahead
Manufacturing data will be released on Monday as the market opens, providing a view into economic activity in the sector.
Weekly Crude Oil Stock numbers will be released on Tuesday after market close.
Wednesday's economic news will include non-manufacturing economic numbers. Employment data will be released before the market opens. Crude Oil Inventory data will be released in the afternoon.
Thursday will bring Initial Jobless Claims, Nonfarm Productivity, and Unit Labor Costs, all providing a view on the recovering labor market and the impact on business productivity.
Finally the week will finish with more employment data on Friday as well as Import and Export numbers.
Earnings releases next week will be focused on small, mid and large cap segments with the concentration of reports with smaller companies. There are also a large number retail companies reporting.
Zoom Video (ZM) will kick things off on Monday along with MercadoLibre (MELI), Nio (NIO), and Lemonade (LMND).
Tuesday will include Sea (SE), Target (TGT), Veeva Systems (VEEV), Ross Stores (ROST), and Kopin (KOPN).
Wednesday's reports include Snowflake (SNOW), Okta (OKTA), Marvell (MRVL), Splunk (SPLK), Dollar Tree (DLTR).
Thursday will include Broadcom (AVGO), Costco (COST), Kroger (KR), Burlington Stores (BURL), Gap (GPS).
Big Lots (BIG) will report on Friday.
Be sure to check for scheduled earnings reports for stocks in your own portfolio.
-=x=-=x=-=x=-=x=-=x=-=x=-=x=-
The Bullish Side
Over the weekend, we already have two great pieces of news to be bullish about. The stimulus bill made a big step forward by passing in the House. Now it's up to the senate to vote and pass it into law with Biden's signature. In addition, the US authorized Johnson & Johnson's single-dose vaccine which will enable millions more American's to receive shots in the coming weeks.
Consumer confidence numbers on Friday showed Americans are starting to have a more positive outlook. As confidence grows, that could unleash record amounts of household savings into the economy. Although that may drive inflation up a bit, the increase in spending will be welcome for sectors hard hit by the 2020 pandemic. Those sectors will include airlines, travel and leisure, hotels and energy.
Treasury bond yields already started to back off a bit on Friday after data showed inflation might not be as worrisome as previously thought. If the US Dollar continues to strengthen, that could bring yields down even further as global investment starts to feel better about sticking money into USD based bonds.
Having the put/call ratio rise above 0.7 and the CNN Fear & Greed index move to fear could be a good sign of a tempering of the overly bullish sentiment. That could bring less volatility to the market and make near term gains build on a more solid base.
The Nasdaq tested the 13,000 level and successfully stayed above the line three times in the past week. The strength of that support can be a base for getting back to the uptrend and more bullish rally ahead. Investor support showed up in the form of ETF inflows for SPY, TQQQ, IWM, QQQ being far higher than outflows.
-=x=-=x=-=x=-=x=-=x=-=x=-=x=-
The Bearish Side
This was the worst setback in the market since the end of October which saw an almost 6% decline in the Nasdaq. The indecision on Friday provided no assurance that the pullback was over. Although 13,000 is a clear support area now, a breakdown below that level could send the index even further down in the coming week.
The passing of the stimulus bill maybe be great for the economy and still send the markets into a plunge. As stimulus checks go out, the increase in demand for consumer products might just send inflation to the levels that investors have been worried about. That will negatively impact many of the companies that have an overweighted influence on the indexes. As the indexes come down, eventually so does all of the market.
Apple and Amazon are trending down, trading below their 10w moving average and threatening the 40w moving average lines. As these mega-caps weigh on the indexes, it will continue to sour investor sentiment.
The frothy exuberance of investors was no more apparent than when the leveraged TQQQ ETF showed up at the top of the ETF inflows list for Thursday as the market was dipping. Buy the Dip is the mantra of the retail investor and that mantra just might come back to haunt us in the weeks to come.
-=x=-=x=-=x=-=x=-=x=-=x=-=x=-
Key Nasdaq Levels to Watch
This section can be a bit repetitive during multiple weeks of rally. This week, it becomes one of the more important sections as we watch key levels for a market direction.
First on the positive side:
The first step is for the index to close above the 50d MA which is at 13,299.28 as of Friday's close.
Next will be to close above the 21d EMA at 13,578.90. Hopefully those two moves will be on higher volume to further confirm the progress.
After getting above the moving average lines, creating a higher weekly high will be the next sign of progress. This past week's high was on Monday at 13,757.06.
14,000 is a possible resistance area so look for the index to get above and stay above this area. A rejection below this would start to form a head and shoulders pattern that indicates a failed rally attempt by bulls.
Finally, the all-time high from 2/16 of 14,175.12 will be the next test. That would be a weekly advance of 7.45% which is well within reason if that market can find momentum.
On the downside, there are several key levels to raise caution flags:
The lower line of the weekly parallel channel, drawn from the March 2020 bottom, is pointing to 13,022. Violating that lower line could signal further weakness in the long term rally.
The low of this past week is 13,003.98. Stay above this level to start a new uptrend.
Next is the 13,000 support area that has held up very well the past few weeks. It also held the index in January before making further gains in February.
At 12,757.61, the Nasdaq is officially in correction by the 10% standard.
Several possible areas of support at 12,550, 12,250, and 12,000.
The 200d MA moved above is about 17% below the index at 11,407.58.
-=x=-=x=-=x=-=x=-=x=-=x=-=x=-
Wrap-up
That's two weeks in a row, where the market ended Friday with indecision. This week the market followed thru with a gap down and sell-off on Monday that continued for the rest of the week. There's a possibility we found the bottom at 13,000 and the market could make an upside reversal from here.
There are no guarantees. As investors respond to increasing bond yields, positive and negative news events, it all can cause more volatility. Influences on the market will have investors searching for assets that can safely produce returns or at least protect against further losses.
That brings us to weekend homework. I'll repeat it from Friday's daily update. Take a close look at positions in your portfolio. How are each performing in the context of the pullback? Which ones are acting relatively well and maybe you are willing to take a bit further draw down to protect the positions? Which ones are not acting well and should be trimmed or sold outright?
If the market does reverse and move up next week, what stocks should be in your watch list? What's your plan for timing and starting those positions? Where should you add to existing positions at the dip? And most importantly, where will you set stops in order to protect against a surprise to the downside.
Good luck, stay healthy and trade safe!

NASDAQ - H&S patternHead and shoulder pattern, left shoulder and head visible, waiting for right shoulder.
keep an eye on right shoulder, it has to be bigger than left or else more down IMO.

NASDAQ double bottom, buy signal?Double bottom several times, looks like we have support here.
RSI double bottom.
we can see an inverse correlation between 10 year bond and nasdaq.
to make it easy to understand, when 10 year bond goes up then nasdaq down and the other way around.

IXIC, SPX, DJI, RUT: are you ready?The mid-term charts of IXIC, SPX, DJI and RUT are presented. ___
Prompt: New traders should take some time and carefully read the post entitled 'You can't beat the market' that is located in my profile.
Disclaimer
The author of this text is not an investment advisor. The preceding content is intended to be used for informational and educational purposes only.
It is not an advice or inducement for the purchase or sale of the products mentioned. Before making any investment based on your own personal circumstances,
it is very important to do your own research and analysis and also take independent financial advice from a professional to verify any information provided here.

Daily Market Update for 2/26Trend lines drawn from the 2/16 ATH (9d), 2/22 (5d) and today 2/26 (1d).
Ideas always welcome in the comments. Errors will be amended as comments on TradingView or corrected inline in my blog.
-=x=-=x=-=x=-=x=-=x=-=x=-=x=-
Friday, February 26, 2021
Facts: +0.56%, Volume lower, Closing range: 49%, Body: 12%
Good: Successful test of 13,000 again
Bad: Lower high, lower low, indecisive spinning top candle, close below 50d MA
Highs/Lows: Lower high, Lower low
Candle: Thin red body in the middle of candle, long upper and lower wicks
Advance/Decline: More than two declining stocks for every advancing stock
Indexes: SPX (-0.48%), DJI (-1.50%), RUT (+0.04%), VIX (-3.25%)
Sectors: Technology (XLK +0.53%) and Consumer Discretionary (XLY +0.42%) were top. Energy (XLE -2.37%) and Financials (XLF -1.91%) were bottom.
Expectation: Sideways or Lower
-=x=-=x=-=x=-=x=-=x=-=x=-=x=-
Market Overview
A week dominated by selling ended with a day of indecision. Investor fears of inflation were lifted a bit by economic data that showed inflation might not be as accelerated as thought. Consumer sentiment numbers rose. Personal spending was lower than expected. That resulted in rising treasury bond yields to back off a bit and the US Dollar to strengthen.
The Nasdaq closed the day with a +0.56% gain on lower volume. The thin 12% body is in the middle of a candle with longer upper and lower wicks. The closing range very near to the open and in the center of the candle at 49% shows as a spinning top candle. The candle is a sign of indecision as both the bulls and the bears had moments throughout the trading session without a winner. There were more than two declining stocks for every advancing stock.
The Russell 2000 (RUT) was the only other major index to close with a gain, and it was small at just +0.04%. The S&P 500 (SPX) declined -0.48% while the Dow Jones Industrial average (DJI) declined -1.50%.
The VIX volatility index declined -3.25% but is still at an elevated level.
The sector list shows rotation back into some of the sectors that suffered earlier in the week. Technology (XLK) and Consumer Discretionary (XLY) moved back to the top, after living at the bottom most of the week. They gained +0.53% and +0.42% respectively. Energy (XLE) and Financials (XLF) moved to the bottom of the list. It's not necessary for them to lead in a rally, but it doesn't help a bull case having them at the bottom.
-=x=-=x=-=x=-=x=-=x=-=x=-=x=-
Economic Indicators
The US Dollar (DXY) gained a surprise +0.88% on a lower inflation outlook.
Yields on 30y, 10y and 2y treasury bonds all dropped for the day. The 2y yield dropped %28 after spiking %41 yesterday. The downside reversal in treasury bond yields is a welcome change for investors of big tech and growth stocks.
The lower treasury bond yields did not help High Yield (HYG) corporate bonds. Prices on these bonds continued to fall while Investment Grade (LQD) corporate bond prices gained. The signal is still caution as investors will continue to watch the bond market closer as next week unfolds.
Silver (SILVER) and Gold (GOLD) declined. Gold declined over 2%, partially driven by the strengthening dollar. Crude Oil (CRUDEOIL1!) declined. Timber (WOOD) declined. Copper (COPPER1!) and Aluminum (ALI1!) both declined. This is a character change from the bullish outlook the commodities were signaling the past few weeks.
-=x=-=x=-=x=-=x=-=x=-=x=-=x=-
Investor Sentiment
The put/call ratio rose to 0.810 as fear starts to work its way into the market. The put/call ratio (PCCE) is a contrarian indicator that shows overly bullish or overly bearish investor behavior. The 0.7 level is considered normal. As it approaches 0.60 (overly bullish) and below, watch for a possible pullback in the market.
The CNN Fear & Greed index moved more toward fear and is exactly neutral at Friday's close. The weekly NAAIM exposure index declined to 85 as money managers reduced positions.
-=x=-=x=-=x=-=x=-=x=-=x=-=x=-
Market Leaders
All of the big four mega-caps closed the day with gains, but none of them were particularly bullish days, giving up gains as the market came to a close. Apple (AAPL) and Alphabet (GOOGL) gained +0.22% and +0.30%. Microsoft (MSFT) and Amazon (AMZN) did a little better with +1.17% and +1.48% gains, both showing indecisive sessions. Only Alphabet is trading above the 21d EMA and 50d MA. Microsoft is stuck in the middle of the two key moving average lines.
Semiconductors made a bit of a comeback with Nvidia (NVDA) leading the mega-cap list with a +3.06% gain. PayPal (PYPL) was second, advancing +2.33%. Bank of America (BAC) and JPMorgan Chase (JPM) led the Financials sector lower with -3.40% and -2.65% losses. The market was pricing in higher yields having a positive impact on big banks, but now is repricing with a new outlook.
Digital Turbine (APPS) and Etsy (ETSY) led growth stocks higher with 14.08% and +11.48% gains. AirBnb (ABNB) also gained +13.34%. A newer growth stock, Fisker (FSR), got a lot of attention this week and rose +32.07% in today's session.
-=x=-=x=-=x=-=x=-=x=-=x=-=x=-
Looking ahead
Monday will start with Manufacturing data before market opens that provides a lens on how much activity is being generated by greater demand for goods.
It will be another week of must-watch earnings reports. Monday will kick off with Zoom Video (ZM), MercadoLibre (MELI), Nio (NIO), Lemonade (LMND). Watch for how the market reacts to positive news from any of these reports. A negative reaction to a positive report can be a big signal of investor sentiment in a choppy market. Also check the companies in your portfolio for earnings reports so you are not surprised.
-=x=-=x=-=x=-=x=-=x=-=x=-=x=-
Trends, Support and Resistance
The one-day trend line points to a +1.29% gain for Monday that would put the index back above the 50d MA.
The five-day trend line points to another -0.43% loss for the start of next week. The longer trend-line from the 2/16 all-time high points to a -1.02% declined for Monday. That would be right above the 13,000 support area.
If there is further downside, the index held the 12,550 area in an early January dip. If it passes that area, the next support area is 12,250.
-=x=-=x=-=x=-=x=-=x=-=x=-=x=-
Wrap-up
Happy we made it to the Weekend? You are not alone. The expectation for today was to go lower and so a bit of a sideways move that resulted in a small gain for the Nasdaq is welcome. However, the market gave no indication that confidence in the rally had been restored. It was an indecisive day in a downtrend that could end here, or continue.
That creates some weekend homework. Take a close look at positions in your portfolio. How are each performing in the context of the pullback? Which ones are acting relatively well and maybe you are willing to take a bit further draw down to protect the positions? Which ones are not acting well and should be trimmed or sold outright?
If the market does reverse and move up next week, what stocks should be in your watch list? What's your plan for timing and starting those positions? Where should you add to existing positions at the dip?
Most of all, there are plenty of signals to keep a cautious approach to the market. Expectation is set for sideways or lower for Monday. Let's hope for an expectation breaker!
Stay healthy and trade safe!

Malaise for > quarter: Telecoms, Fast food, and Consumer staplesThese important sectors have not been booming for over a quarter (no Robinhooders around these sectors, and not worth a Reddit meme) -
- Telecommunications: T, VZ, TMUS
- Quick service fast food restaurants: MCD, YUM, WEN
- Consumer Staples (ETF is XLP): household products PG, CL, CLX: food MDLZ, GIS

Select forex currencies post-covid bounceback - weak frm Dec2020Select foreign currencies, after Covid/coronavirus bounce-back, have been weakening since early December 2020 - ahead of the NASDAQ (IXIC) question of faith in mid February 2021: Russian ruble RUB/USD, Brazilian real BRL/USD, Colombian peso COP/USD, Mexican peso MXN/USD, Korean won KRW/USD, Thai baht THB/USD, Japanese yen JPY/USD, Euro EUR/USD.

Nasdaq Index ChartHello friends,
I have mentioned things in chart.
I just check the history.
Nasdaq index is now off the ascending channel, but it might have a 10-50 days range and correction then start a new ascending channel like before.
Hope to get bullish soon :)

Nasdaq IXIC Formation of a Monthly GravestoneHi everyone,
Nasdaq is currently forming a shooting Star or a Gravestone and the Monthly Candle will close tomorrow. If this candle close like this, we must expect the worst to come.. the end of the Bull Market for the Nasdaq.
Let's see, a lot of things can happen in one day. Dow and S&P 500 Index are not looking like that for now.
Best to you !

Select Emerging Markets down frm Jan 2021, not like IXIC mid FebSelect Emerging Market ETFs (U.S. listed in $USD) falling since Jan 2021, not like the IXIC (Nasdaq Composite Index) only since mid Feb: Russia RSX, Brazil EWZ, Mexico EWW, South Korea EWY, Thailand THD, New Zealand (ENZL - small market, not emerging market).

