Nasdaq Composite: Bond Yield Panic
IXIC has been dropping quickly due to rising bond yield e.g. US10Y and US30Y and rising volatility. Volatility is often a self-fulfilling prophecy, as many funds automatically sell when volatility rises above certain threshold, creating more volatility and causing other investors to sell.
However, the big picture remains bullish because the overall market sentiment is not panicking about recession. Also, newbie individual investors have not crowded the stock market like they did in 2020 and 2021. The Fed may start rate cutting in 2024, which will probably ignite another huge stock rally.
Therefore, IXIC may drop to 13150, the 0.5 fibonacci retracement of the 2022 downturn. Then IXIC will probably recover and retest the previous high in early September. September and October are often bad months for stocks, but the first two weeks of September might be bullish just because August has been too bearish.
IXIC trade ideas

NASDAQ IXIC $IXIC NASDAQ:IXIC SKILLING:NASDAQ EIGHTCAP:NDQ100 USI:TICKQ
NASDAQ
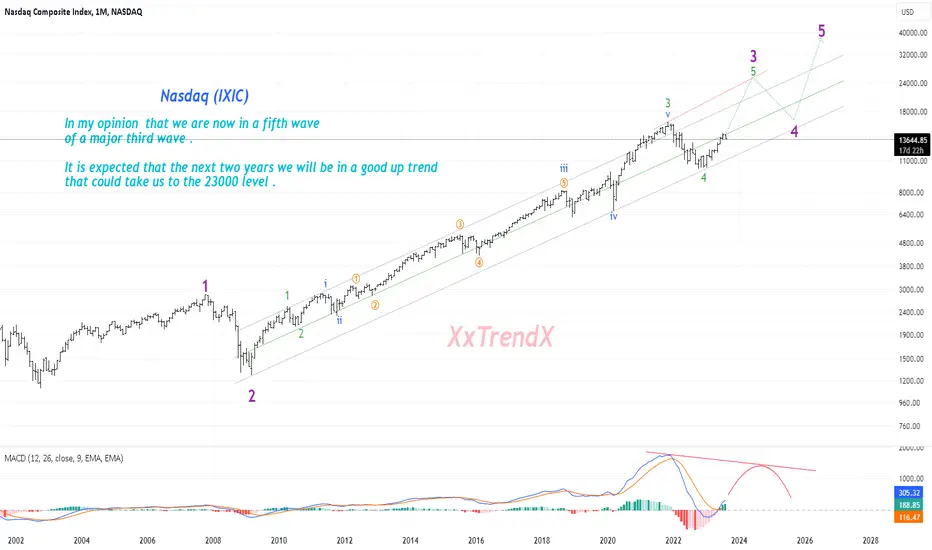
In my opinion that we are now in a fifth wave
of a major third wave .
It is expected that the next two years we will be in a good up trend
that could take us to the 23000 level .
Nasdaq Composite Bearish outlook Nasdaq is at a very critical level , if it pushes down then the t
he next support is at 13160 Level where if it tests the support m
ultiple times then it can be a good entry point .
If it continues to push down from 13160 then the next support wil
l be at 12400 level which can also be a great entry point.
My bias is towards 13160 level strong support and it will bounce
back from there as technically we have come out of the long term
bear market and this correction is a fair correction .
Key Support levels (can be used for doing shopping)
13160
12400

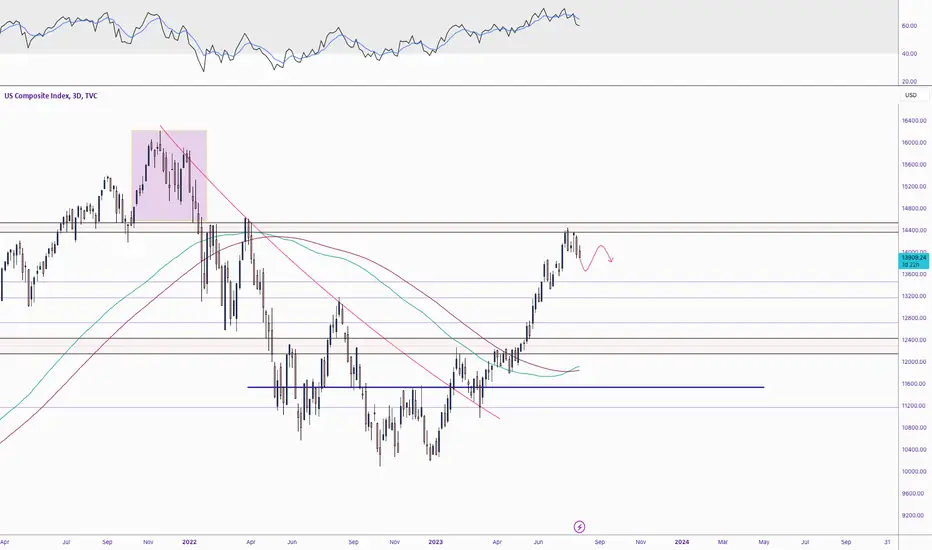
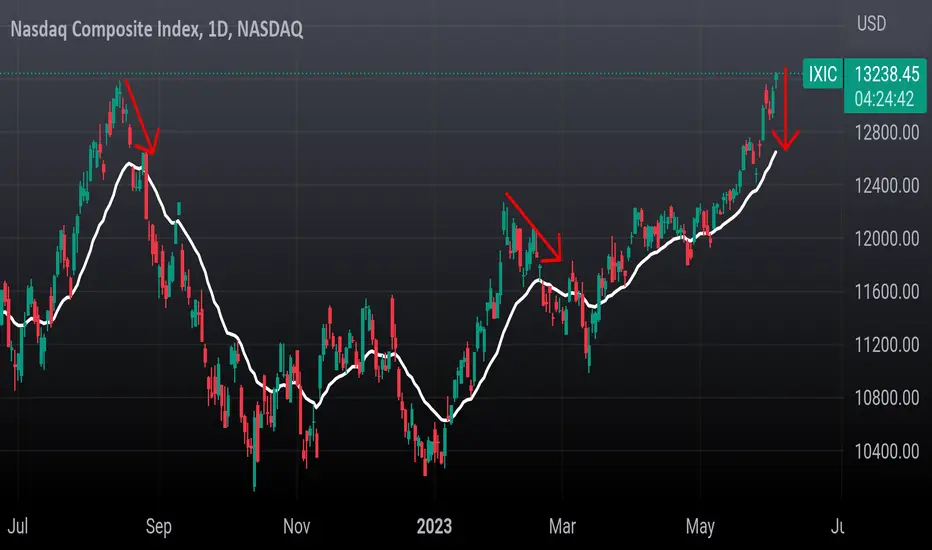
IXIC 3d ChartIXIC ran straight into resistance and was rejected throughout July.
Considering the price action, I would not be surprised if this forms some sort of double top, revisits the 13.5k region before we get a better idea on the next move.
If that does not hold, there is a good chance we see sub-13k.
Expecting price action similar to the Sept-Dec 2021 top (highlighted in purple)
now the best position is to be 100% patiente. although the zone of 13800-900 is important critical zone for #nasdaq
although, Nasdaq is in a low bank of its flag shaped correction,
but watching volume/price behaviours in other indexes, I expect this pullback will go deeper at least towards 50d moving average.

Nasdaq shares similar chart patterns to SPX This chart of the Nasdaq Composite , has similar pattern to the S&P which tells the story of the overlapping composition in the indices especially within the Info Tech sector. Measured using anchors from late June to the highs made recently we appear to be trading just above the halfback and clearly above Fib 61.8 and 78.6 lines.

IXIC/USM2...AI bubble vs Dot Com??Blowoff top then end of the world?? Looks pretty similar to the dot com bubble i grew up in...hopefully, if is the case, everyone positions themselves and leaves on the way up! Best of luck everyone

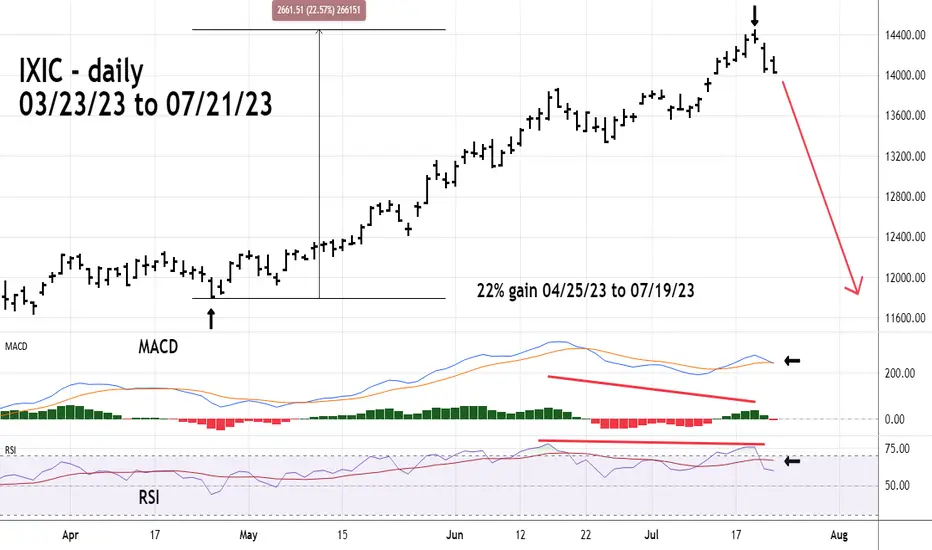
Nasdaq Composite Leading the Way DownSince 04/25/23 the Nasdaq Composite (IXIC) has been leading the way up.
Its gain from 04/25/23 to 07/19/23 was 22%.
The S&P 500 gain over that time was 12%.
The Dow Jones Industrial Average 5%.
Now IXIC is leading the way down. Note on the 07/19/23 peak the bearish divergence on both MACD and RSI. MACD also has a bearish lines cross, while RSI has moved below its moving average line.
IXIC could reach the 04/25/23 bottom in a few weeks.
Analysis of the US stock market , NAZDAQAnalysis of the US stock market
Fortunately, according to the analysis, 3.5% of the growth index has been achieved from 4%.
According to the status of the RSI indicator and the volume and candles, it is logical to save profit and exit the market for a new entry in a suitable position.
The first suitable point for re-entry is the previous entry range of the index (about 13333).
And this time for 6% profit.
Don't forget capital management and compliance with risk to reward
Good luck and profitable

American stock exchangeAmerican stock exchange
According to the previous analysis, the stock index was able to touch the ceiling of its 170-day ascending channel.
Currently, the current candle is being modified.
You can wait until the yellow line to enter again.
And if you are a risk taker, wait until the purple line.
Or enter 50% on the yellow line and the remaining 50% of the position you want on the purple line.
- Considering the fundamentals and the stoppage of the increasing trend of bank interest rates, one can hope for a small correction to the mentioned lines and then continue the upward trend.

Nas Composite VS USM2 now and dot com!been following nasdaq composite and USM2 and risk on vs .com bubble upward channel...here it comes

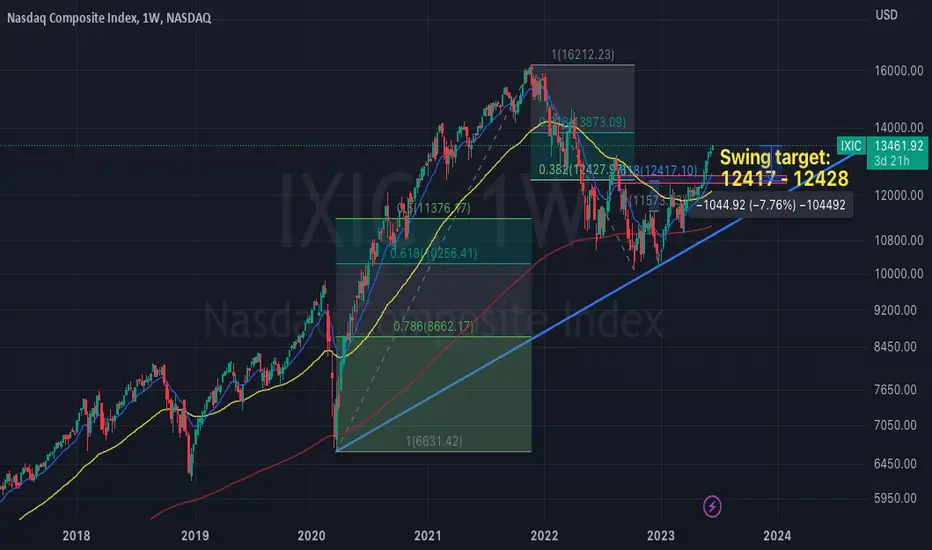
IXIC: A Time for CorrectionsSadly but truth, a healthy corrections to 12417 - 12428 shall appear on NASDAQ:IXIC
I do some calculations based on internal & external Fibonacci Retracements and found a potential corrections up to 8%, kindly beware on your steps ahead.
Be greedy is good, only when we enter a bloody market.
-AJ-
Arrival of the Golden Cross - NASDAQ Breakout ComingThe arrival of the golden cross is very bullish for NASDAQ Index for the next few years. This is a once in a lifetime opportunity to go long!

Nasdaq composite is really prepared for flywhat I see in weekly chart of #nasdaq composite is a finished bear making a double bottom at its floor and etc.
now it needs a strong rise towards13000.
now my finger is on trigger waiting for a strong week.

Nasdaq composite went the expected wayThe Nasdaq Composite provides an excellent overview of the fractal nature of the market.
1- The double bottom pattern was completed on January 23
2- The 6-week flag pattern that ended on March 13
3- A smaller cup & handle (green one) were formed.
4- The failure of the small pattern also happened last week.
5- Now we can say that we are already in a new bull market
Note: Even though the 13,000 level is an important resistance area and could cause problems, I personally don't expect it to stop the young bull.

IXIC (Nasdaq) Price is too Overbought right now and below I'll try to convey my thoughts.
Nasdaq never extends more than 5-6% from its 21ema before a significant sell off .
The 21ema the white line
Let's start with Nasdaq rally from March 2020 lows unt Sept 2020
March 2022
August 2022
Feb 2023
June 2023
Also weekly candle is forming a hangman while completely outside Bollinger band.
After this aapl event this week I expect a pullback to Daily 21ema minimum.
IXIC is in a bulish chanelNasdaq analysis
Since December 28, 2022, when it touched the bottom of the ascending channel, it has continued its upward trend for 153 days with a relatively good slope of 24 degrees and has grown by 29%.
Regardless of the current candle, the limits of the index can be considered between the midline and the ceiling of the channel (12793 to 13647).
According to the status of the RSI indicator, it is not far-fetched to modify the index up to the midline of the channel.
If the midline of the channel is touched, a growth of 6.36% to the ceiling of the channel can be imagined.
Don't forget capital management and compliance with risk to reward.
Good luck and profitable.

Nasdaq Composite Index, IXIC, Start of a New Bull MarketIt doesn't get more simple than looking at this Monthly Chart going back over a decade. You can clearly see the incredible uptrend and the True Strength Index, although having shown a bearish divergence since Jan.2022, the TSI has barely broken the Centre line and is now about to turn back above. This New Bull Market should last through to the end of 2014. Just waiting for confirmation, and that will happen in June.

Understanding Current Market Trends 🔄CURRENT MARKET TRENDS 🔄
1. 🎯 Selective Market Dynamics
The present market scenario remains highly selective. This has been a pattern, with a tendency for a rotational environment. Stocks that are currently underperforming or rebounding from their lowest points are leading the market for short durations. This is while tech-heavy indices like the Nasdaq temporarily stagnate, then it's their turn to lead, and the cycle continues. But, there's a growing concern - fewer companies are driving the Nasdaq, which is complicating attempts to gain significant progress with individual stocks due to diminishing participation.
2. 🐺 The 'Lone Wolf' Phenomenon
The case of NVDA serves as an excellent example of this emerging "lone wolf" trend. Recently, NVDA shares experienced a substantial increase of nearly 30% following an impressive earnings report and promising quarterly guidance. This surge contributed to a 1.7% uplift in the Nasdaq index. Meanwhile, other indices like the Dow and Russell 2000 ended negatively for the day.
🤔 DECODING MARKET CONCERNS
1. 📉 Hidden Weaknesses in Indices
While favorable earnings responses are generally positive, the risk lies in a market driven by a limited number of stocks. This poses a challenge because the strength of indices can be misleading, concealing the limited overall participation if the driving force comes from a handful of giant corporations.
2. 🛡️ Defensive Tendencies & Megacaps
There are phases when financial institutions become cautious about risk and the overall economy, leading them to adopt a defensive stance. Megacap companies have offered liquidity during these times, thus becoming the "safe" choices when institutions hesitate to take on riskier investments. This has led to an updated version of the old Wall Street adage, "You'll never go out of business losing your client's money in IBM." In this context, IBM is replaced by modern tech giants like Apple (AAPL), NVDA, Amazon (AMZN), Google (GOOGL), Meta (META), and Netflix (NFLX) - the new IBM's are the FAANG companies!
🚀 NAVIGATING MARKET DYNAMICS
1.💡The Eventual Shift
While this trend will eventually change, predicting when this will happen is not a necessity. Indicators such as a rise in successful breakouts will provide all the necessary information. Until then, discipline and avoidance of fear of missing out (FOMO) and hasty strategies is advised.
2.🌊 Riding the FAANG Wave?
You might be contemplating whether to join the FAANG trend. If these stocks show positive signs or proper bases, the answer is yes! For instance, NVDA and NFLX were recently included in our Watch List for this very reason.

nasdaq 🌊Greetings,
A mirror to my tableau painted for Bitcoin,
I surmise that the Nasdaq is engaged in the theatrical rendition of a cycle degree fourth wave.
Historically,
these fourth waves are prone to a tactical withdrawal into the realm of the prior degree wave four territory.
In this distinct instance, the territory in question lurks in close proximity to the abysmal pits of the pandemic nadir.
A bullish harbinger would manifest should the Nasdaq maintain an altitude above these pandemic depths for the duration of this bear market.
If such a trend is confirmed, i will dare to anticipate an audacious ascent to the lofty summit of $30,000 as we voyage through the decade towards the 2030 agi revolution.
---
w4 - $8,100
w5 - $30,000
☿

Nasdaq Monthly overview Nasdaq - after more than a year, the Monthly candle is breaking out 20 SMA and it implies that IT shares would be benefiting of this. Strong DXY is also helping the cause.

IXIC/USM2 updateI still think blowoff top like dot com bubble may be headed our way, then we get the big kahuna everyone seems to be waiting on.

Potential Major Nasdaq Top! 5-16-23Attention this is a RED ALERT!
On 05/16/23 the Nasdaq Composite (IXIC) appears to have completed an Elliott wave Ending Diagonal Triangle. If so this could be the final wave up of the rally that began in October 2022. On 05/16/23 the IXIC advance/decline line was bearish. 15 -minute MACD and RSI have significant bearish divergences.
May is the start of a seasonally bearish time for stocks.
U.S. stocks may have begun a multi - month decline.
This is a RED ALERT!
