Understanding Safe Haven Assets In Respect to CoronaVirusSafe Haven Assets are a set of financial instrument that retain or gain value in times of economic downturn. We are definitely moving towards critical times with the spread of Coronavirus moving faster than the speed of light. As we have seen the negative effects of Cov19 on Major Stock indexes, its adverse effects on Corporate earnings and the harsh presence it occupies on a global scale, Major stock indexes such as Dow Jones Industrial Average (DJIA) has plummeted about 2% or say 500 basis points as of today, the S&P 500 doing same coughing out about 2.1%, Nasdaq 2.7% respectively. We have also seen the USDJPY lost nearly 100% of its gain in the last one week all due to Investors panic.
This been said, Safe Haven Assets such as Gold (XAU), Japanese Yen (JPY) and Swiss Franc (CHF) have all increased significantly in value because of their nature to retain or gain during market chaos. Understanding this will enable traders know more about market movements and make trading decisions based on logic and numbers. There are several instances of economic downturn like the US-China trade war which caused market instability for a while but for the purpose of this of adding knowledge about Safe Haven Assets I will stop here and I hope this help.
Gracias !
JXY trade ideas

possible short term short on jpy pairsJXY looks to be forming a temporary short position other JPY related pairs seem to follow this too


JXY long (Correlation)Hello Traders !
JPY Index is good for Correlation.
We can see that the price is right now at the Support line. I expect it to go up.
All XXXJPY pairs should drop now. They fit to all other analysis I made on XXXJPY pairs like GBPJPY, USDJPY, ...
Let me now in the comment section below your view on GBPJPY and what you think about my Analysis.
Please leave a Like
Thank you and we will see next time
- Darius.


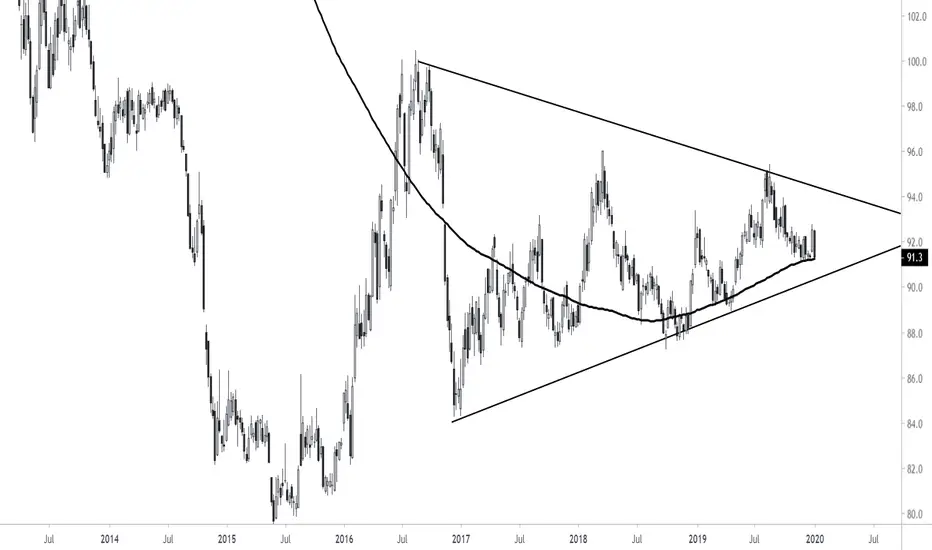
Japanese Yen Index (Wait 99 points for a break up)The Japanese yen index on the historical frame is bullish and it is currently making a correction to be launched, but in the long term it is in a downtrend and made a correction in the form of a symmetrical triangle by breaking this triangle and it is 88 point , so that the direction and descending completes to the levels shown below is confirmed, while the alternative scenario, which is the closest vision to it, is the rise. but with a condition that it must break even to complete its historical ascension and without breaking it, it will enter a phase of fluctuation, but by breaking its point 88, it will complete the decline as noted.


JPY upside for few daysJPY sellers has been week.. buyers take the batton for few days . it ll reflect on usdjpy and chfjpy.lets see


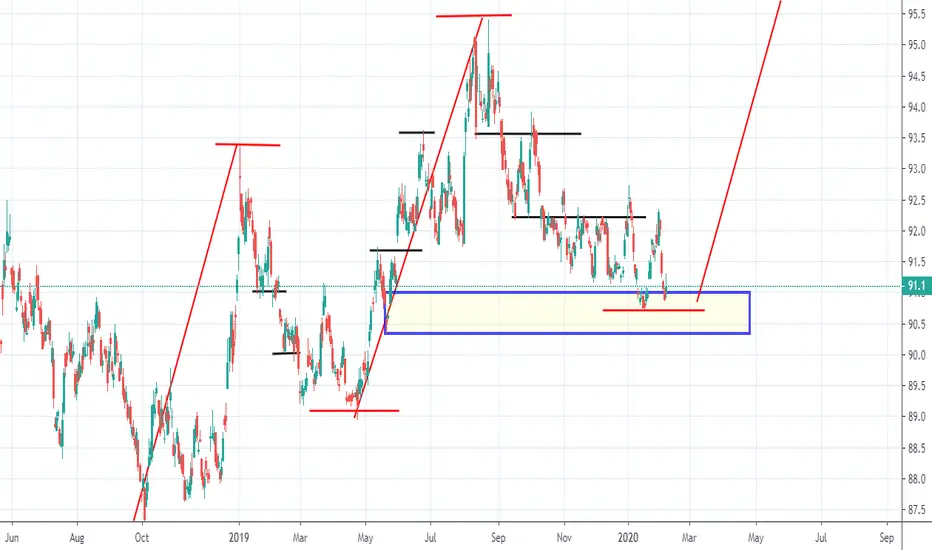
Should JXY finds support at trendline @91.4 next weekShould JXY finds support at trendline @91.4 next week???
JXY has new fiscal stimulus for next year, and suppose to support the currency to be higher.
We will observe if JXY finds substantial support at trendline and find good time to buy!


