The line of least resistance still facing to the floorIt seems the line of least resistance is still point downward. The strongest group of stocks (financials) seems to be also giving grown and losing their will to rise. As the US S&P500 failed to break its 50 day EMA reversing with a bearish engulfing candle and shooting right through the 50 day EMA. Seems the US has sneezed. We normally catch a flu.
rates still going higher Fed adding another 75 points.
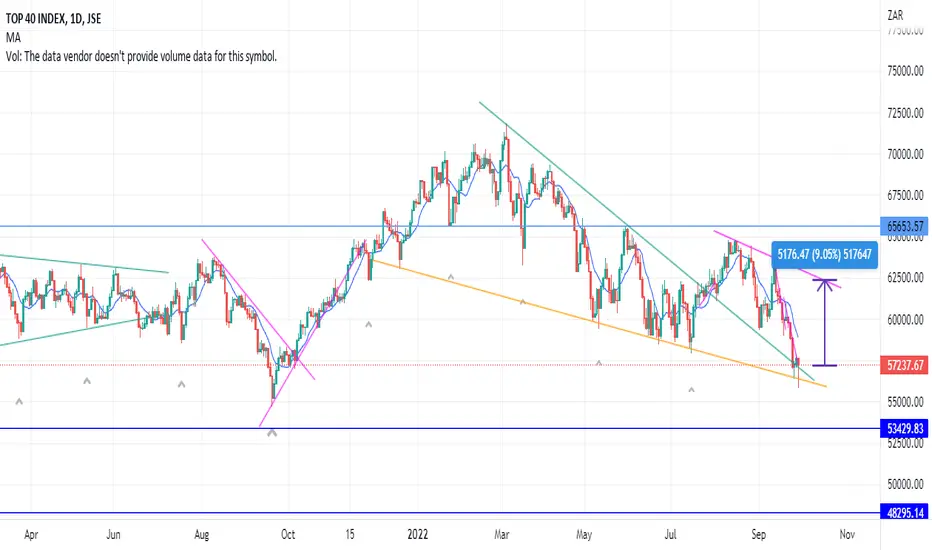
The wedge is narrowing. and that's worries some.
SA40 trade ideas

top40 60min chart updatetop40 index has failed to hold above the 60500 confluence resistance point today,
risk reward favors the bears for now

JSE Top 40 Index [Data Point: Seasonality Forecaster] JSE Top 40 Index
Comparing the current level vs this time last year as well as 2 years ago.
#Data

JSE Top 40 IndexJSE TOP 40 INDEX: My most recent long and short views were: (1) Accumulation at the re-test of the breakout level and (2) Distribute at the swing highs. See blue and red circled areas. Both Thursday and Friday saw strong buying off the lows of the day with closes above the 8 x 21-EMAs. What is medium term out going into year-end and how am I seeing it technically?
For more research, including trade ideas, get in touch today.

jse top 40 indexhave we bootom or there is going to be more capitulation price has been ascending from 22 sept

Choose your loss buy or sell We are currently in a very difficult trading environment for the JSE ALSI 40 (and the stocks in the index) and I believe world wide (with most markets).
This sideways movement has been going since July 2022...
The world is in a rut with major issues like high inflation, ongoing interest hikes, currency collapses, US dollar strength, UK economic collapse, East wars and COVID recovery.
Our hands are unfortunately tied, how long this will last and what the damage will be (drawdown wise). But we will control it with lowering our losses from 2% to 1.5%. This will all be guided through a process until we overcome it...
But it's part and parcel with trading and it's something that is very common on a yearly basis...
HOWEVER! This is crucial to understand as a trader.
Since the derivative markets, the algorithm of movement (between buying and selling) has changed drastically.
From the markets moving in strong trends (70% of the time) from 1940 - 2007 where a monkey could have thrown a dart and profited from any Blue Chip stock for 20 years.
To now we are seeing the markets trend around (20% of the time, if that) from 2007 -2022.
We have no choice but to make the stop loss and take profits prices tighter and to hold for less period of time.
This will be a patience game but will be worth it in the end.
Only those strong enough to stick around and act accordingly with their correct risk management will reap the rewards.
What are your thoughts?

Top40 rejecting the 50 day EMAThe top40 index rejecting the 50 day EMA. signaling it wants to go test the H&S neckline yet again. 200 week EMA holding quite strongly.

SA Top 40 Index - ShortI see a bullish trend reversal and head and shoulders formation pattern taking shape.
This is supported by a stronger dollar and rolling blackouts locally, exacerbated by higher local inflation - sentiment is sour.
Will add to my TFSA lower down.
Let me know your thoughts?

JSE Top 40 IndexJSE TOP 40 INDEX - Strong upside follow-through from support between 56823 and 57482 - the range we discussed last week (circled area). The index reclaimed the 8-day EMA and has closed in line with the flat 21-EMA. At current levels, I'm expecting a consolidation (after yesterday's strong rebound). The rating has shifted from WEAK to NEUTRAL while the index is trading in the mid-point of the 2 std deviation 20-day linear regression channel.
For more research, including traded ideas, get in touch today.

Does this bear still have another 27% odd fight in it?Dangerous looking head and shoulders pattern on the weekly chart. Who's target. is around 41.2k mark.
Given that interests rates are jogging along higher, recession etc. This bear might have some decent wind at its back. IF the bears can break below the 51.5 neckline on the weekly chart. The odds of the target rises
Albeit it will bump into a bunch of dead cats along the way

T40On Tuesday, I highlighted support for the index between 56823 and 57482. Subsequently, the index continued to trend lower as anticipated while at yesterday’s lows, it found support in the middle of this range. With markets rallying off the low, the likelihood is that the Top 40 continues to make a bullish reversal off this level.
For more research insights, including trade ideas, get in touch today.

J200 daily chart bearishness resumesJ200 hit major resistance yesterday and today confirms the resumption of its bear market

Dead Cat Bounce on JSE ALSI 40 I'm not enjoying the bear market, but we can't deny the charts and what we see.
It's most likely just a Dead Cat Bounce before we get further downside...
We can do nothing but sit on our thumbs...

ALSI - Relief rally - ALSI bulls managed to hold the major trendline for now and a relief rally is playing out
- Will be watching closely to see how we react at key resistance levels in this corrective phase

JSE Top40: Daily & Weekly Cycle Low PointThe JSE Top40 index is seeking a daily cycle low with high odds of a weekly low. Price is reversing from the orange trendline that has supported price through the cycle decline. To confirm a a daily cycle price must move & close above the pink trendline on a daily timeframe.
JSE Top 40 IndexJSE TOP 40 - WEEKLY CHART - Update
- a view presented over the past few weeks (see attached)
- line A_B was breached
- prior demand/supply incoming.
For more research, including trade ideas, get in touch today.

SA40cash ALSI 3 day IHS patternALSI top40cash cash is forming a bottoming IHS pattern over the last 3 days, solid breakup above 58200 will confirm the pattern

T40In my research report for Monday 12 September, I highlighted the 61.8% Fibonacci retracement zone as a resistance level. Since then, the index is lower by over 6100 points or -9.7%.
For more research insights, including trade ideas, get in touch today.


JSE Top40JSE:J200 is back at the recent lows (58.6K-ish). Most stocks are weak, what are the odds that the Top40 can bounce here? Add the middle of nowhere low near 56K. Rough market.

ALSI SA40cash chart updateafter loosing the 59300 support today, ALSI now looks to the next target which is about 1.50% lower (875pts)

JSE Top 40 IndexA slide from today's research report, published to clients yesterday evening:
Unchanged From Last Week 12 September. Line A_B is a key risk level over the medium term. As previously noted, there is a clear supply zone that has been in place since Q1 2021. This level also represents the (former) supply and (current) demand zone extending back to November 2017. A downside breach of line A_B would increase the odds of a test of prior supply-demand zone.
For more research insights, get in touch today.

