$ALSI JSE All Share Index. Shooting starThe JSE All Share Index is building a shooting star candle formation on a daily chart. This is a bearish signal. The fact that it started against a longer term resistance level solidify the fact that we might be in for a period of consolidation.
SA40 trade ideas


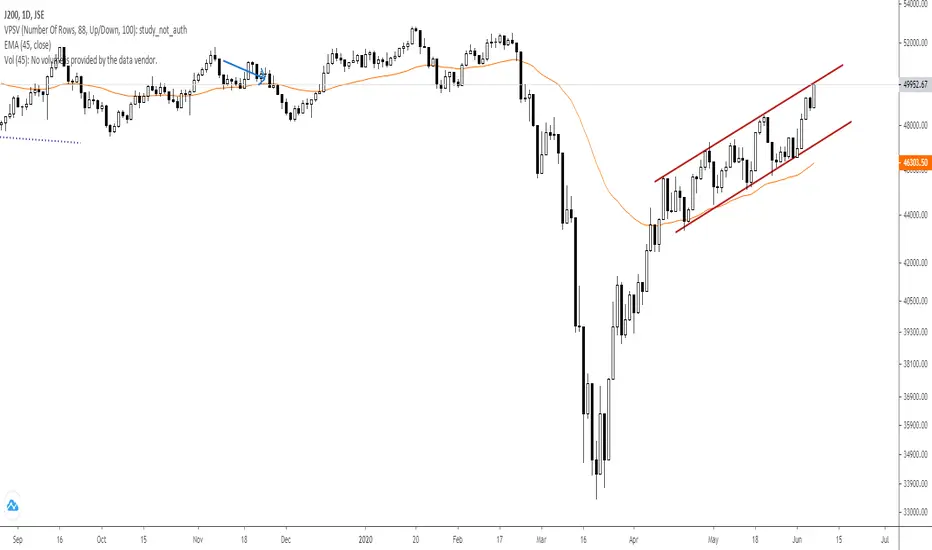
$SA40 JSE TOP40 index - is it time for a retracement?The top40 index bumped into weekly downtrend resistance @ 52200 connecting multiple tops since 2017. Given the one-sided rally off the march lows, the probability favors a bit of a pause and retracement before an attempt to break out through the oncoming resistance. I would be quite surprised to see the index break out to new highs without some sort of pause/consolidation in price. Should we begin to retrace off 52200, levels we could target are likely 48000 and 46000.

Divergence on SA Top40, bold shortEvidence of negative divergence on the top40, maybe worth a short at these levels. Understandably a bold move given stimulus measures across the globe but is this rally potentially losing steam

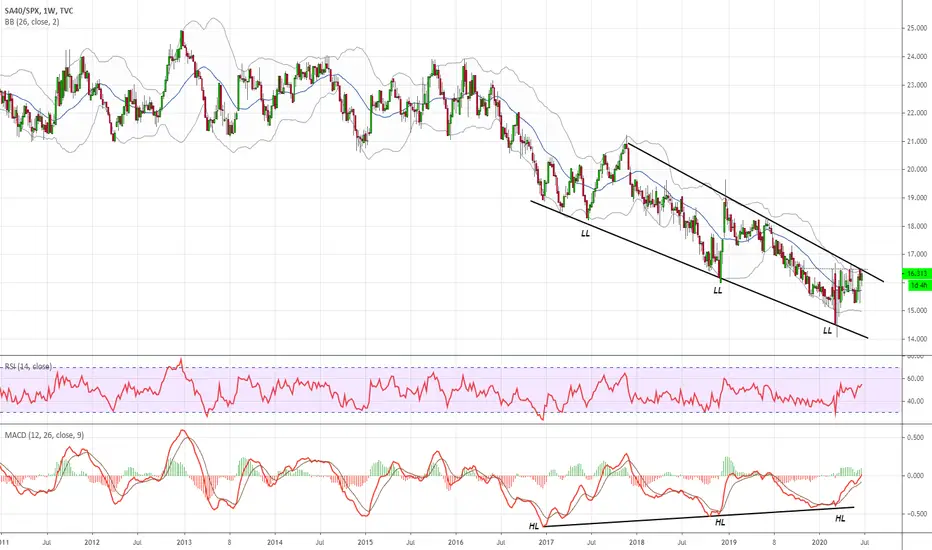
South Africa TOP40 gearing for outperformance against the SP500?Known to all, the US markets have outperformed the SA markets for a significant period of time. From a pure charting perspective, the series of higher lows on the macd indicator vs the series of lower lows on the price chart of the pair (SA40 vs.SPX) is indicative of bullish divergence warning of a change in trend where we could start to see the SA40 Index outperform against their US counterpart. Fundamentally feels impossible with all the bad news locally, but it could purely be a case of the rand weakness against the dollar which drives your "rand-hedge" counters such as Naspers, BTI, CFR and the resources which are a significant weightings of our index. This is a weekly chart so it could take some time to play out, but it will be interesting to monitor this going forward.
Top 40 - After a 53% move off the lows, I'm flagging caution At current levels, and on a medium term view, I'm flagging caution.
Yesterday's thrust higher was potentially a false breakout, similar to what we saw on 17-January with 20 and 21 January being the follow-through. Remember, we are 53% off the March lows. In my view, the 1H 2020 'easy money' has been made and thus very aggressive long index positions would be taking on excess risk.
Caution.

Long term view of SA top 40Within the two shaded regions, it is unclear which is the end of the 4th wave, also wave 5 was very short. Hopefully the next few months give a clearer indication of market direction

JSE Top 40This chart forms part of a larger research note (dated 14 June 2020). None of the information posted here (TV) should be considered financial advice.
Top 40 (J200) | As mentioned in my client note last week, following a very rapid 50% bounce off the March lows, traders should take caution and that returns from then onward would be hard to come by. This past week saw a small unwind of the bullish sentiment with markets having their worst week since March. My current view is that you’re a short term trader, then long entries may not have an attractive risk/reward. Friday’s close was positive, with the candle structure seeing a long tail, similar to Thursday however a period of consolidation may be due. A loss of 48400-48100 would see 47560 open up as a target. Looking back at the first five months of this year, we’ve navigated the broader market well.
1. During Jan-2020 my technical perspective picked up that the Top 40 price action and chart structure was very similar to the August 2018 period. We then saw a drop, with Covid-19 being a fundamental catalyst to drive prices lower.
2. On 18-March 2020 whilst markets were bleeding we were strong advocates of phased buying noting that ‘Red Equals Opportunity”.
Both of these calls having helped manage risk and generating significant alpha. Take caution, because risk happens fast. And not forgetting, know your time frame!

JSE to head to new highsReason #1: Our economy is about to wake up with the ease of the lockdown
On Monday, 1 June 2020, the national lockdown went to level 3.
This resulted in many firms and businesses resuing operation at almost, full capacity.
Already we’ve seen a boost in activity in food production, retail, communications as well as mining.
In fact, most underground mines like DRD are heading back to 100% production.
Millions of employees have gone back to work, there’s been an improved sentiment towards the economy and the JSE has rallied 3.28% with three up days in a row.
Jasper Lawler, Head of research at London Capital Group, said,
“Markets are pinning hopes on a quick economic rebound once lockdown and travel restrictions are lifted,”
Reason #2: The JSE is lagging the World index
The JSE as well as many other emerging markets, tend to follow the world markets…
When the World index moves up, we see the JSE follow. And when it drops (due to a financial crisis or a global Black Swan event) the JSE crashes with it.
This is because most South African equity market’s earnings, are derived from demand factors outside its borders.
Now let’s take a second to look at the World index (MSCI ACWI Index) performance in relation to the JSE…
In the last six months, it’s clear that the JSE (orange line), has traded at a huge discount compared to other emerging markets measured by the world Index (Black line).
This tells us we should expect the JSE to move up in sync again.
And looking at the last two months with the sudden up spike, this means it’s already on its way.
Reason #3: Lowest interest rates since the 70s
On Thursday, the SARB cut the repo rate by yet another 50 basis points.
This came after a 100bps cut in March and another 100bps in April.
This brought the repo rate down from 4.25% to 3.75%.
These are levels we’ve not seen since the 1970s.
What this means for investors is they’ll receive less interest on their savings and low yielding assets…
As the return is much lower, investors will most likely take their money and deposit into better return on investment assets.
And now with many sectors looking very cheap, we can expect investors to start buying low price but high quality companies on the JSE.
And the charts share the same sentiment.
Since 1 March up until 1 June, we’ve seen the ALSI 40 (JSE All Share Top 40 Index) move in a triangular pattern (shaded area).
This is called an Ascending Triangle which has two main characteristics.
#1: Triangle that makes higher highs
The price moves down until it hits a bottom. In this case, the price moved to a low price at 34,000.
It then moves up and forms a high price. Which in this case, the price moved to a high at 48,323.
#2: The price breaks out of the triangle
The market then moves to the top and breaks up and out of the triangle formation.
Now that the price has broken out of the Ascending Triangle, we can expect demand and buyers to rush in.
This will result in the ALSI moving to new highs.
To calculate this target, we’ll take the difference between the high and the low of the formation and add it to the high.
Target price = (High – Low) + High
= (48,323 – 34,000) + 48,323
= 62,646
This means, we can expect the JSE ALSI to rally another 30% from where it currently is, in the next few weeks.

j200 ALSI daily chart has reached top of Bullish channelNote that this is the 4th push higher on the waves, expecting some consolidation to come in next week.
Top 40 J200 *Extract from client research note 01-June-2020
The JSE Top 40 Index has been fairly choppy of late and my sense and analysis suggests that the surge we saw from the mid-March lows is slowly starting to fade with a change of character in the recent weeks. From the low on 19 March to 14 April, the index advanced by 36% – a period where the chart structure reflected a steep trend. Following this period the market made a gradual grind higher by pushing into the breakdown zone i.e. prior support. From the end of the steep rise (14 April) to Friday’s close – a period of just over six weeks – the index is higher by only 861 points, reflecting the range-bound trading action. On Friday we closed lower by 1.91% while the index printed a daily bearish engulfing candle. This morning Asia, trades strongly while US Futures are flat hence we could see the index open in the green however the medium term structure suggests fatigue. Complacency abounds, so take caution.


Weekly game plan 24 May 2020 - ALSINot much has changed here from last week. Bit of a fake break, but it seems that resistance level is holding.


$JSE Top40 facing massive overhead supplyThe current levels between 47600-48000 on the JSE's TOP40 index was a major area of support in the second half of 2019 before breaking down to low at a level of 33400. If a change of polarity where to take place at current levels you would expect this previous area of support to be respected by the market and possibly turn into resistance. I was quite shocked to realize the percentage gains from the lows, as you would have basically made a return of 43% if you miraculously managed to pick this exact bottom on March 19 and hold it to current levels. One would do well not to be overexposed on the long side of the market, as the odds of a correction from these levels are pretty good. Watch for a reversal candle to form which could indicate a short term top in the market. (i.e todays candle to close towards lower end of the candle range)
Weekly game plan 3 May 2020 - ASLIInteresting resistance level coming up... we'd be on the lookout for short entries.

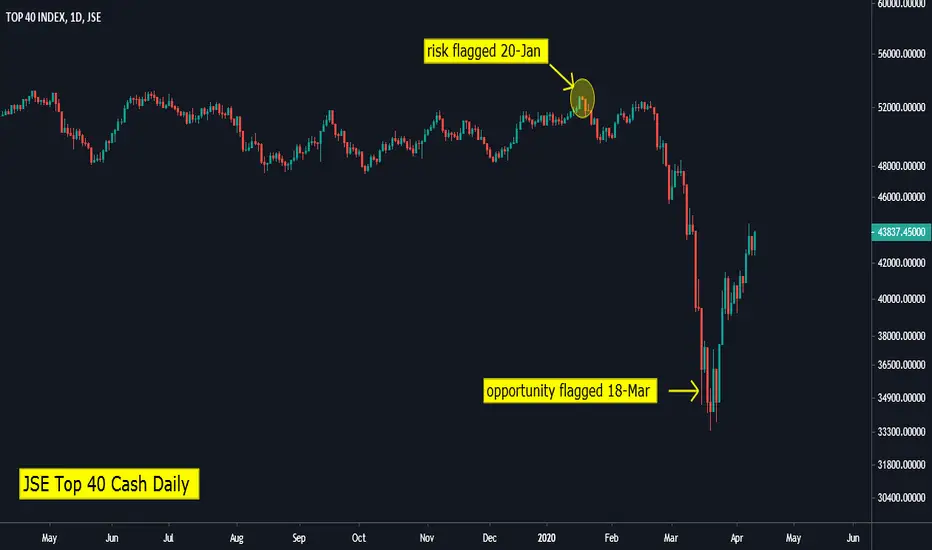
JSE Top 40: Following a 13800 Point Rebound, Apply Caution.
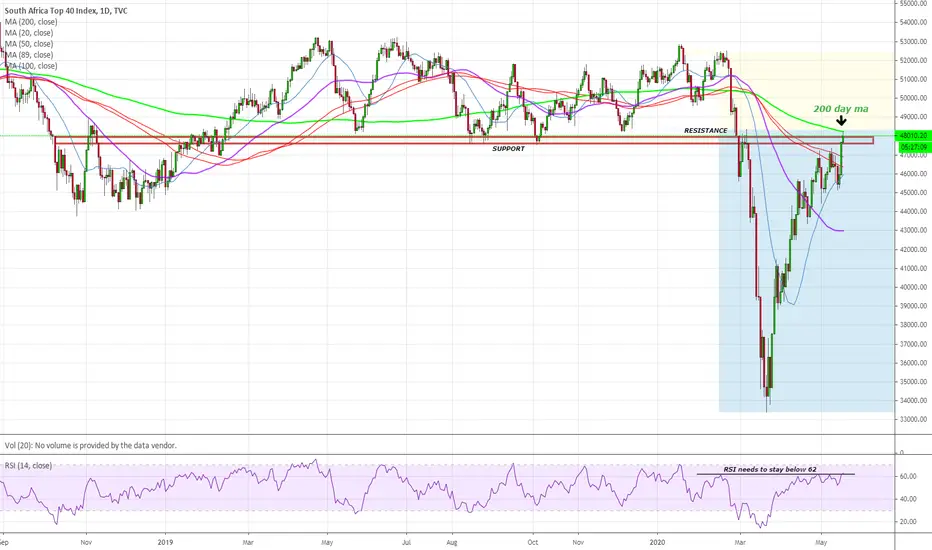
On 20 January our warning flagged the risk of downside on the JSE - which subsequently saw a 19000 point or 36% decline to the lows. Following that, on 18 March we called for the the opportunity to participate on the upside, which was/is being followed by a 13800 rebound. At current levels the index is around 41% off it's 19 March lows however some caution should be exercised.
Technically, we have seen a breakdown of the channel followed by a classic, sharp back-test which has taken us to 47222 at today's highs. These highs are also in line with the 2nd breakdown zone seen in late February and early March. Technically, the index may be overextended to the upside and is possibly due a pullback following the aforementioned strong bounce. On the downside, the 50-day EMA at 44462 may act as a short term support zone. On the upside, 47343 and 47292 should cap further advances.

JSE Top 40 Trade Idea UpdatesOne of the most frequently asked questions at present is whether the current rebound is the start of a new bull rally or whether it should be considered a ‘dead-cat-bounce’? The truth is that the most well-connected and well-resourced market participants do not know the answer to that question. For most traders, attention is drawn to the developments around Covid-19 and the subsequent actions by governments and the business community. In addition, much of the focus will also be on the actions of central banks which seems to have put a “floor” under equity markets for the time being. At present and as always, my focus is on the price action/charts to determine market sentiment for the short, medium and long term.
At a broad market level I think that this has helped us hit the nail on the head as we have managed to navigate these moves and calls which has provided exceptional opportunities on both the long and short side. Take the JSE Top 40 for example where our research flagged downside risk on 20-January which saw the market fall around 19,000 points which was followed by our note highlighting that ‘Red = Opportunity’ on 18 March which has seen the market jump by around 8,000 points. If you’re going to take one thing away from this, I think that it should be that market participants would do better by spending a large portion of their time on price action and charts and less on headlines. That being said, at current levels, bearing in mind that we have had a 31% jump off the lows, I am finding it tough justifying any aggressive long entries at current levels. In the South African context, our market had already closed when the President announced a 2-week extension of the 21-day lock-down. I mentioned that I would be very surprised if we see don’t see an aggressive bearish reversal in names such as MRP and TFG that were both higher by 12% on Thursday!
At an overall market level (JSE), I think it would be prudent to trim your short term gains.
TOP 40 - Potential ReversalWe may derive the following from the J200 Weekly chart:
1. Price recovered quite well from the previous support.
2. We now face a major resistance level and backtest where a reversal to the downside is possible.
3. Check the lower time frames for possible entries. i.e. a sell setup.
4. As always - maintain your risk.
Note: The views provided herein do not constitute financial advice.

JSE Top40 - Up against resistance. Index is currently testing resistance at around ~40 800. Bias is probably to the downside - but will be interesting to see over the next couple of sessions, especially with Oil spiking today on the back of Chinese buying.

