JSE:J200 Top40 Automatic RallyAfter the distribution and markdown (discussed in previous posts), we have had a selling climax (SC). This is noted by the high volume and capitulation of the market. Now we are seeing an automatic rally (AR) from the SC lows. This should back up (BU) to the previous distribution trading range. Once this is done we could see a trading range form (fluctuating within the bounds of the SC and AR) which we then can evaluate to determine if it is a redistribution or accumulation trading range. A number of stocks are rallying and we will watch for the retest to go short to test the SC lows.
SA40 trade ideas

#ALSI Time for a bounce ? We rally even in bear markets. Maybe time for a cautious long position. Not calling a bottom here, just a rally. Stick to stop losses. Target 6% away from current levels. Stay safe in markets and out there.


J200 - TOP40JSE:J200
Support on J200 very close around 33000-35000 area.
But don't count too much now supports getting broken these days.

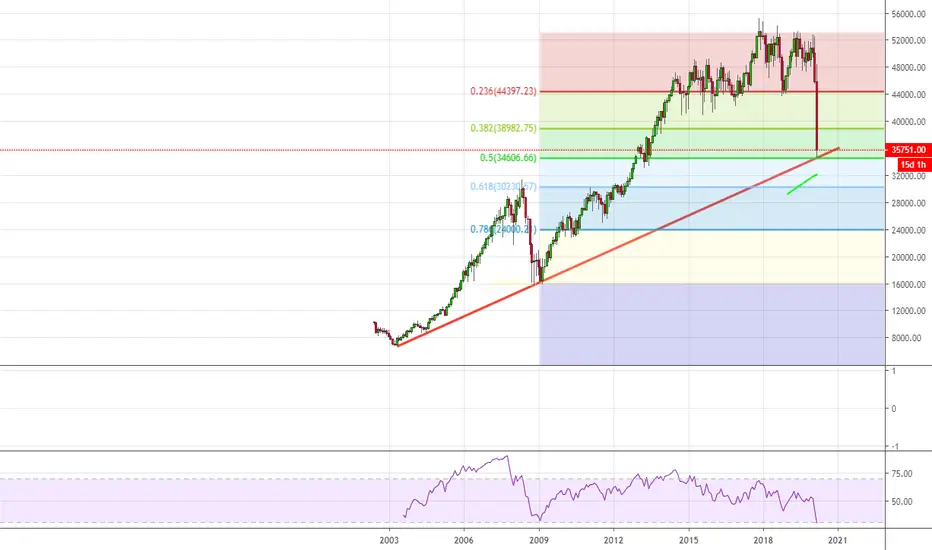
$J200 TOP40 - we could see a bounce off these levelsTOP40 - Trendline from 2003 + 50%fib retracement - i think market can put in a bit of a bounce here.. possibly a little to much too fast?
JSE:J200 Top40 Wyckoff Distribution and MarkdownInstitutional investors which include foreign investors have bee distributing the JSE stocks since 2015 (see posts below for further analysis). Following a Wyckoff approach to the markets an upsloping distribution range was formed and now the markdown has started. Price has broken the upsloping stride and the lows of the automatic reaction (AR) at the start of the trading range with the largest two down bars ever. We may have a rally back to the breakout levels but I am expecting further markdown to take place.


TOP 40 - Bearish Forecast We may derive the following from the Weekly J200 chart:
1. Price has dropped significantly over the past two weeks.
2. At present, price appears to be correcting.
3. It is probable that after a short term correction, price will continue to decline to the major support level (orange box).
4. Wait for a correction pattern to sell.
5. As always - maintain your risk.
Note: The views provided herein do not constitute financial advice.

JSE:J200 Top 40 Change in CharacterThis week has seen the largest down bar. Volatility to the downside has been increasing since 2015 and the clear change in character (CoC) last week could indicate a lot more downside to come. We have been following what has been looking like distribution for some time and this move could be the markdown in phase D. After a possible pause at the bottom of the trading range we could be in for a larger markdown below the trading range in phase E.

Top40 - Testing support.Sell off might be overdone for one day. That and the fact that we are now testing support could be reasons for a relief rally from these levels. We wait for price action to determine direction however.

J200We currently have a very good looking RSI Divergence plus the wave count, however I still think the drop will be actually giving us Wave 4 then we will go bullish thereafter to Wave 5

Top40 index: a typical M-top pattern busy unfolding?A price action below 52000 might support a bearish stance.
Also a possibility for a whipsaw price action around current levels.

Top40 index: Bullish trend remains intact above 50800Upward price momentum is halting.
Some early signs of a deterioration of the current bullish trend.


TOP40 INDEXLooking for a little pull up to supply zone then we sell, I am more on for selling opportunities on this trade.

#TOP40 - CoilingOur TOP40 (South Africa) Index is currently coining - we wait for breakout in either direction to get a better idea of the bigger picture.

SA TOP AnalysisI see this as an insight ti what is happening with the South African economy. Lets have a look:

TOP40 - Resistance HeldWe may derive the following from the Weekly J200 chart:
1. Price remains bearish - as currently seen by the rejection at the orange box.
2. It is probable that price will continue to the downside until reaching the support trend line.
3. Wait for an opportunity to present itself. And as always - maintain your risk.
Note: The views provided herein do not constitute financial advice.

Indices | JSE Top 40 J200 The current technical setup is reminiscent of the August 2018 period where we saw the index break to the upside a bullish flag formation, producing a 5% move on the break. At current levels, the price is around 4.6% above the breakout level, with a slight overshoot and test of the resistance trend line going back to November 2017. We are also 9.3% (or 4400 points) up from the 4-December-2019 lows. Keeping an open mind for a potential retracement.

J200 - TOP40JSE:J200
Strong weekly candle clearing previous resistance.
Next target is 55.000 but will probably higher than that.

J200 weekly chart j200 has been ranged bound between 48000 - 53000 for the year so far in 2019.
So far in the last 3 months, a triple resistance around the 51900 area has formed and a break above this with a weekly close can be very significant.
In the broader picture there is also a massive Inverted HS pattern forming which began in april 2014. neckline for this would require a break above 53300 to confirm.

JSE Top 40 Index - SpotIndices | JSE Top 40 Spot | Weekly Chart | Flash Chart
An Alternative View: Price action a mirror image of the late August 2018 period. Another false breakout?

69% Chance of a Santa Claus Rally on the JSE in 2019Go to Google, Bloomberg, Business Times and you’ll see big debates between nations talking about this rally.
This sparked my curiosity to see if we could also see a stock market rally on the JSE this year.
Today I’m going to tell you what the Santa Claus rally is, why it exists and how you have a 69% chance to profit from the JSE this December.
Let’s get to it…
Why you can see a sudden stock market rally at Christmas time
The Santa Claus rally, in a nutshell, is when stocks see sudden price rises and strong gains near the end of December and in early January.
And when stocks rally, this drives up the actual stock market indices as well.
According to the 2019 Stock Trader’s Almanac, there’s an average 1.3% market rally in stocks, during this time that has taken place 75% of the time since 1969.
We are not 100% sure why the stock market ends positive during the last few days of the year, but here are some common theories.
Theory #1: Investment managers cut down on their taxes
This is the time when you’ll see investors and investment managers, selling their stocks to lock in tax reductions before the end of the year.
Once they sell their positions, they then buy other stocks and markets that they believe will rally in the next year.
The buying of these stocks, leads to a rise in stock prices which pushes the stock market indices up.
Theory #2: Investors treat themselves with their bonuses
Investors tend to splurge at the end of the year on stocks with their bonuses they’re paid at the end of the year.
And when there’s buying, demand picks up which leads to higher stock market prices.
We can speculate all we want, but nothing tells us the truth more than what the charts show.
What you see, is the monthly JSE-ALSI stock market chart since 2003…
Looking at the chart you can see how each December (Vertical blue line) performed from 2003 up ‘till 2018.
Year Gain/Loss
2003 7.39%
2004 1.28%
2005 6.84%
2006 3.90%
2007 -4.99%
2008 0.51%
2009 2.62%
2010 6.69%
2011 -3.26%
2012 2.72%
2013 3.27%
2014 -0.53%
2015 -1.15%
2016 0.48%
2017 -1.33%
2018 4.63%
So, there’ve been 11 out of 16 Decembers (69%) that have shown positive gains. And in total, the JSE has accumulated 29.07% gains in all of those Decembers.
This means, you have a higher chance of profiting from buying this Christmas than selling.
Trade well,
Timon Rossolimos
Founder, TimonAndMATI.com
