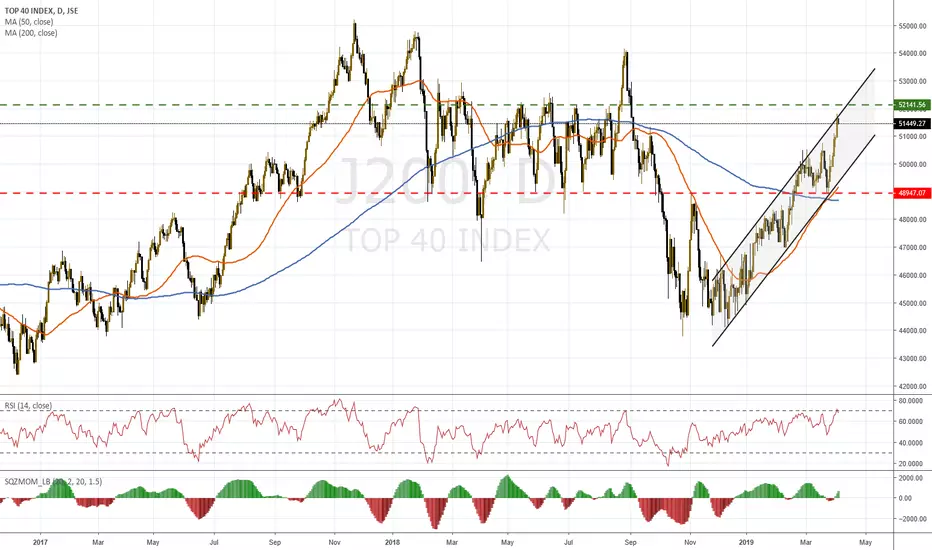
Buy opportunity on South African stocks.The market is approaching the 48,940 Support. 1M is supported there (RSI = 52.867, MACD = 574.500, Highs/Lows = 0.0000) and the current dip is a solid medium term buy opportunity. Assuming that a roughly -2% Lower High sequence will be maintained we place the next medium term target at 52,200.
** If you like our free content follow our profile (www.tradingview.com) to get more daily ideas. **
Comments and likes are greatly appreciated.
SA40 trade ideas

JSE:J200 Top40 Waiting for the ElectionThe Top40 has had a great run since the start of the year. On the way up there were two occasions when institutional supply entered the market (seen by the high volume) but was unable to stop the advance. Now the market has reached the highs were previous institutional supply occurred. However, the volume has declined in the leadup to the elections. Trading volume can be expected to be low until the elections are over and the market can decide a direction. Something to note is that the RSI has made a negative reversal and once volume returns to the market we could have a volatile decline.


J200J200 H4 (240 Minute) Timeframe
Reasons For Entry :
- Trendline Breakout
- Expanding Wedge
- RSI
Everything Good Yearns Patience And Time
Disclaimer: Trading stocks, commodities, futures and forex has a level of risk and may not be suitable for all investors.

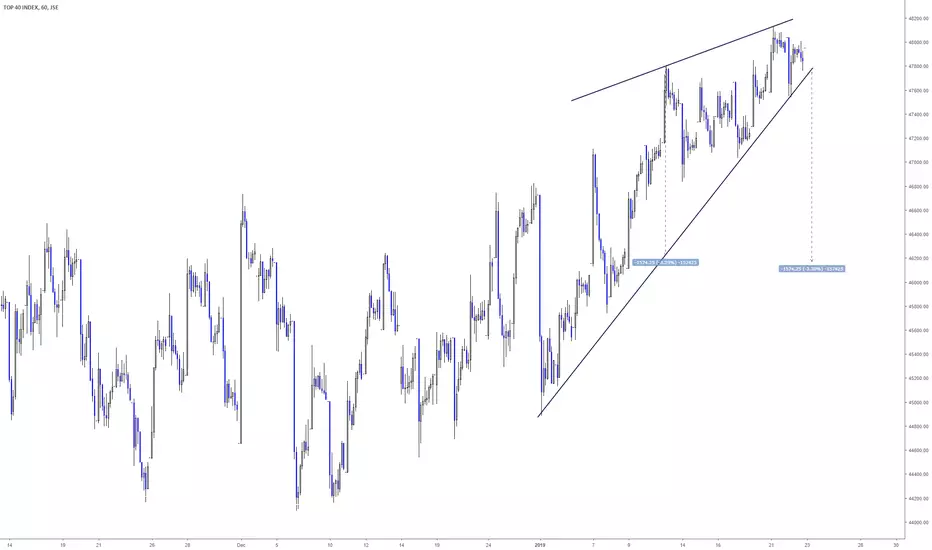
J200Within a bigger bullish trending channel there is a smaller bullish trending channel as well, the breakout of the smaller channel will be perfect entry for trendline breakout traders to target the support line of the bigger channel.

Sa 40Shorting opportunity. Low risk to reward ratio. Short on the 4h chart. Monthly trend line hit as resistance. Trading in 4h channel for a while now.

JSE:J200 Top40 Divergence with Number of Stocks above 50 & 200MAConsidering the number of stocks above the 50 and 200 daily MA we have seen a divergence with price. Price is making new highs but the number of stock above the MAs are decreasing. This indicates some weakness developing in the market and potentially and need to watch for reversal at resistance.

$JTopi at very interesting levelsI'm very bad at calling "tops" & "bottom". If the market taught me anything over the past 25 years, is to NEVER jump in front of a moving train ;-)
Looking at the Top40 technically, it does seem like we're in "overbought" territory according to its RSI.
The trend is however very strong (moving averages are also starting to "smile"), we saw a "Golden Cross" on 26 March (very positive) and we could possibly go and test that resistance at 51,850 (if you're short - this could possibly be your stop-loss). Be VERY careful calling a top!!
J200 top40 looking exhausted... $JSE $j200I have decided to have a deeper look into the technical structure of our top40 index which should give you a better technical view of what to expect from our market. Firstly interesting to note is that price has rejected off the 61.8% fib retracement using the last swing high and low that we saw between August and October last year. We have seen numerous topping tails below this fibonacci retracement whereby the market has tried to rally but price fell back to the lows of the day by the close (bearish characteristic which shows that sellers are appearing on any attempted rallies). Also interesting to note that the RSI has broken out of its uptrend, and has now retested this level and failed today. A convincing close below 49200 should give me confidence that we have seen a top in our overall top40 index. Caution advised going forward..


J200JSE:J200
Blue line J210 RESI 10
Yellow line J211 INDI 25
Green line J212 FINI 10
Red line top40 J200
Resi strongest pulling J200 higher, Fini weakest.

J200 - TOP40 hourly chartJSE:J200
Making head and shoulders on hourly. If neck line gets broken target around 48600.

Top40 IndexThe Top40 Index recent weakness confirms my views of a strong recovery being set in motion!
The 47 000 level held ! .. so get ready for a strong move towards the 49000 levels.
Implied volatility is agreeing with my assertion getting clobbered to Mar'19 and Jun'19 expiration!
Falling over 2.5v over the course of just two days!

J200 :JSE TOP 40Theres an expansion forming in a triangular shape as its continuously giving higher highs and lower lowe. I anticipate a drop in the pair for a number of reasons towards the support.

J200 (TOP40) hourlyJSE:J200
Hit resistance from November 2018. Making broadening formation.
Back to test bottom of that formation now?

JSE:J200 Top40 at the Top of the 'Trading RangeOn the daily timeframe (TF) following the Wyckoff logic, there was a change of character that formed a Trading Range (TR) with the Selling Climax (SC) and Automatic Rally (AR). This is at the bottom of a larger TR on the weekly TF (See post below). After a Secondary Test (ST) of the lows, the price is testing the top of the TR again. This is also the 2019 Yearly Pivot Point and 200Day MA. We are now in Phase B and expect a contraction in volume and a test of the lows in Phase B before we can look for Phase C and a move out of the range. Negative divergence on the TDI (RSI) also indicates a possible move down.

JSE:J200 Top 40 Approaching Resistance After a Change of Character (CoC) and major Sign of Weakness (SoW) the JSE Top 40 has been seen the start of a smaller trading range (TR). Price is now approaching the top of the TR (Round number 49000) with confluence with the 200 Day SMA and the 2019 Yearly Pivot Point. The Rally is seen on lower volume than the decline and negative divergence with the RSI. Looking for a reaction to confirm a move to the bottom of the TR in the week to come.

JSE:J200 Top 40 Still Indicating WeaknessReconsidering the evaluation of the trading range (TR) it could be evaluated as an inclining TR. The initial part of the trading range had some signs of accumulation but after an up thrust (UT) a strong distribution character has emerged. Before the end of 2018 price had a change of character (CoC) with signs of weakness (SoW) on increasing volume. Now the Top 40 is attempting a week rally to the 200 Day SMA and new Yearly Pivot Point on decreasing volume. The number of stocks above their 200 D SMA has increased but is still below 50% and in a declining trend. The number of stocks above their 50SMA can also be seen as slightly declining. If the evaluation of an inclining TR is correct the Top 40 has however not broken the TR. Will be watching the next reaction to the downside to see how the small recent TR develops for continued distribution or accumulation.


J200 _ Top40JSE:J200
If you invested in TOP40 index (J200) in South Africa at the beginning for 2015 and hold till now your return would be ZERO.

J200 :Top40 Index Failing to break 47 000 Been building a good base at 45500... Thought we would take out this 47k level with ease....
Subsequent to this bullish move over the past few day's we note end -users sellers of ALSI 48k covered calls to Mar'19 in decent size.... trading at 20v...
So market going to be long gamma at this level... 47k also getting slammed over the past few days trading as low as 20.00v...
I'm of the view that we possibly see a move back towards the 45000 / 45500 levels just to test this support again!

J200 Top40JSE:J200
Failed to break from sideways consolidation and so far making what is called PIN bar or big inverted hammer.
This looks very bearish to me.
