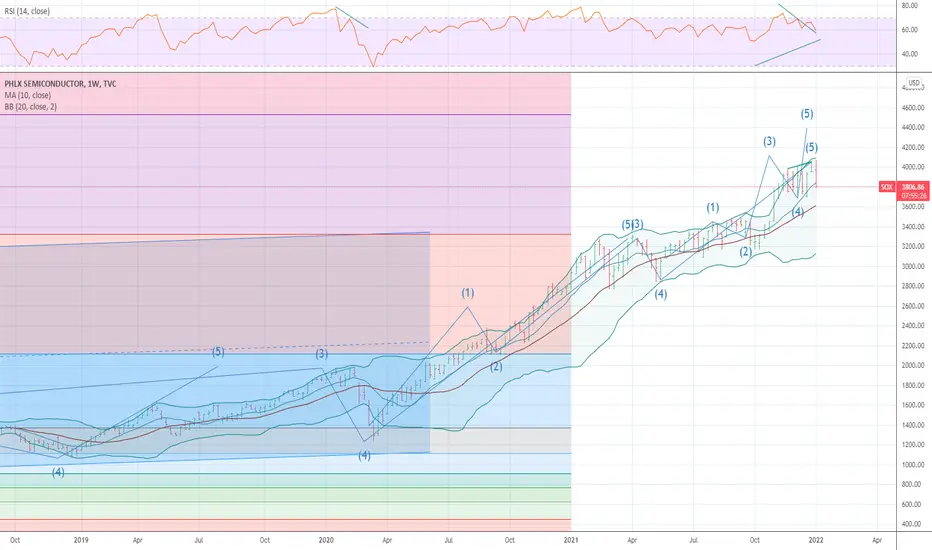
SOX Update (weekly chart)SOX, as well as the broader XLK, has diverged somewhat from SPY, and remains stubbornly above the 52 week EMA. The red D point is a longer term Gartley target based on a 61.8% retrace from point C.
However, it is still in an Ichimoku resistance area, and has potential to reverse.
Key support areas are;
1) 2854 -2794 DOJI, and potential pivot area
2) 2848-2742 Blue Point B, a prior swing high and potential pivot area
3) 2838 Gann Confluence Point and potential support
Should pivot areas 1) and 2) above fail, the final point to watch is the Gann Confluence around 2838. A fail below this point would be bearish. Also, an extended stay below the 52 week EMA would be bearish.
Presently the chart sits above the longer term downtrend set from 1/22 high to 10//22 low and has a ways to go before that channel should continue.
SOX trade ideas

SOX: March 2023Lots of requests for SOXL/SOXS.
Finally did some math levels for it. No probability, but just looking at the chart setup here and overlaying the math monthly levels this is what it looks like to me.
Looks like a bearish bird that is flagging. I would be looking for this to break the current flag structure down to the red box (target area).
We also completely bypassed the monthly high levels. Hoping to see this continue to reject upside tomorrow and confirm a break of the flag structure down to the math low range on the month.
Just my quick thoughts, not advice.
Safe trades everyone!

what do we need to see for semis to continue up?i want to see a 15 minute pattern that winds up moving into this range, and i will be long soxl

SOX Update (daily chart)SOX has been diverging from SPY last couple of days, which is unusual. SOX had 50/200 EMA xover Friday. SOX is extended, could pull back to prior swing high at 2913 (-3.25%) where there is good support. Watch these tech stocks with earnings coming up next 10 days, all daily charts look bullish (except CSCO, which is debatable). All also have positive point & figure price targets (from Stockcharts.com). ADI (2/15), ADSK (2/13), AMAT(2/16), ANET (2/13), CDNS (2/13), CSCO(2/15), KEYS (2/21), NVDA(2/22).
RSI(9) has been trending up since 1/9. As long as daily RSI(9) stays above 50%, trend may continue.

SOX Semiconductors Daily chart updateJust took out prior swing high (point B). Headed for target (D) of 3041.85.
SOX has successfully reversed downtrend channel, sits above Ichimoku cloud, and will aim toward Gann confluence at 3105 (red Line).

SOX UpdateI have no problem with bold predictions, reversals I do well. SOX has historically led out of the gates on reversals. SOX has broken the downtrend, and successfully tested a Gartley retrace. While we still have an Ichy cloud resistance overhhead, I believe the market bottom is in. Will there be another selloff? Likely. However, I believe a new market bottom lower than the October low in SPY is unlikely. We also have financials (XLF) and Industrials (XLI) showing a similar trend reversal. So lets pull for more green shoots.

Have Chipmakers Already Bottomed?Most people know that technology stocks ended 2022 on a weak note. But they may not realize one group started to outperform: chipmakers.
The first pattern on today’s chart of the Philadelphia Semiconductor Index is the falling trendline along the highs of last year. The S&P 500 is currently sitting at similar resistance, but SOX has been above its respective trendline since mid-November.
Notice how it stayed on the upper side of the pattern last month. That may suggest old resistance has become new support.
Next, that bounce occurred at 2449, an old monthly high from October 2020. Again: old resistance, new support?
Finally, chipmakers have shown relative strength as inflation cools and the Chinese economy reopens from its most recent lockdowns. It’s also interesting that yesterday its biggest member, Taiwan Semiconductor , jumped after reducing capex plans. Management also predicted the chip market will bottom in the first half of this year.
TradeStation has, for decades, advanced the trading industry, providing access to stocks, options, futures and cryptocurrencies. See our Overview for more.
Important Information
TradeStation Securities, Inc., TradeStation Crypto, Inc., and TradeStation Technologies, Inc. are each wholly owned subsidiaries of TradeStation Group, Inc., all operating, and providing products and services, under the TradeStation brand and trademark. TradeStation Crypto, Inc. offers to self-directed investors and traders cryptocurrency brokerage services. It is neither licensed with the SEC or the CFTC nor is it a Member of NFA. When applying for, or purchasing, accounts, subscriptions, products, and services, it is important that you know which company you will be dealing with. Please click here for further important information explaining what this means.
This content is for informational and educational purposes only. This is not a recommendation regarding any investment or investment strategy. Any opinions expressed herein are those of the author and do not represent the views or opinions of TradeStation or any of its affiliates.
Investing involves risks. Past performance, whether actual or indicated by historical tests of strategies, is no guarantee of future performance or success. There is a possibility that you may sustain a loss equal to or greater than your entire investment regardless of which asset class you trade (equities, options, futures, or digital assets); therefore, you should not invest or risk money that you cannot afford to lose. Before trading any asset class, first read the relevant risk disclosure statements on the Important Documents page, found here: www.tradestation.com .

SOX Valiant effort but a little more downside. 75% retrace upward from A to C, but there is much resistance at the 50% to 38% Fib, as well as 200 MA. However, there is a solid flag forming, which could spring an upward surprise.

What’s happening in semiconductors? The next chapterWe recently wrote about semiconductors from the perspective of capital spending and government policies aimed towards encouraging further capital spending and ultimately semiconductor independence.
However, we’d be remiss to not at least touch on some of the current geopolitics.
A simplified look at the semiconductor supply chain
If one simplifies a rather complex set of interrelationships across countries, we can see a triangle with three distinct corners1.
Foundries: These companies are manufacturing the physical chips. There are not too many individual players, as the capital expenditures to enter this space are extremely high. Additionally, they don’t all have the same capabilities. Taiwan Semiconductor Manufacturing Co. (TSMC) is well known for being able to reliably manufacture the most advanced chips in the world. Samsung Electronics, Intel and Global Foundries represent other important players.
Intellectual Property Companies: These companies make and sell different layouts and designs. ARM, the company currently owned by SoftBank, is one example with a huge presence across the internet of things (IoT).
Electronic Design Automation (EDA) Tools: EDA was only $10 billion in 2021, a small part of the overall $595 billion semiconductor market, but it is essential if chip manufacturers are to determine if a design is feasible prior to production. Cadence, Synopsys and Mentor Graphics are the three leading players in this space. Together, they control about 70% of the global market.
Behind each of these points on the triangle is a lot of history embedded as experience, and it is important to recognise this since it is what makes it particularly challenging for an outside player—in this case China—to just copy it.
The ASML example
Lithography is the term used for the practice of etching the appropriate designs on the silicon that allow for the functional operation of the transistors. More transistors spaced more closely together, simply put, means a more efficient and capable chip. Today’s Apple M1 chip contains 16 billion transistors2.
The degree of precision engineering required to be able to put 16 billion transistors on something that is not the size of multiple city blocks, much less could fit within a laptop or smartphone, is one of the most impressive feats of human ingenuity that the world has ever seen. The short version of the story is that a company in the Netherlands, ASML, was in a position to take a big risk in the 2000’s—the pursuit of extreme ultraviolet lithography (EUV).
EUV was needed because there needed to be shorter wavelengths of light used to almost shave atom by atom away from the silicon to make the transistors small enough, basically 5-nanometres. This light is generated by flashing a specific type of laser 50,000 times per second at molten tin3.
Developing EUV was so capital intensive that only a single company did it: ASML. Components for the machines that do this fill four 747 airplanes and are sourced from specific companies all over the world. Operating the machines at scale requires an incredible depth of experience4.
Given the flavour of the topic, you have probably already guessed the geopolitical implications. Some of the components of the EUV machines do come from the United States. Then, there is the relationship between the US government and the government of the Netherlands. As a result of those discussions and where we are presently, EUV machines are not being sent to China.
The Nvidia case
In August 2022, the US took a further step to limit China’s artificial intelligence (AI) ambitions through further restrictions on the export of very specific semiconductors5:
Nvidia will be restricted from selling the A100 graphics processing unit into China, Hong Kong and Russia
Nvidia will also be restricted from selling its forthcoming H100 series of graphics chips into these same markets
users of the A100 include Alibaba, Tencent and Baidu—the companies that provide some of China’s largest cloud computing infrastructure
Nvidia is the most visible company with respect to these types of chips, and as of this writing it had the largest market cap amongst the semiconductor companies. It would not surprise us if other firms that have chips of similar types of capabilities could be named in the future.
Conclusion: Can China ‘go it alone’?
We might take a step back at this point and think, wait, China has massive resources. Why don’t they just make their own chips? We don’t discount the fact that China absolutely could make its own chips, but it would be more a question of how long it would take and how advanced those chips could be. The EUV process was something that took both massive investment and about 20 years. ASML is able to manufacture the machines that it does and support companies like TSMC operating at scale because they have the benefit of learning from all the mistakes along the way. China can certainly make efforts along the path, but simply spending money is not going to lead to an effective EUV process that can manufacture the most cutting-edge chips at scale—the key being ‘at scale without a high defect rate.’
During the four years ended 2024, China is slated to complete 31 major semiconductor factors. By 2025, 40% of the world’s capacity to produce chips with 28-nanometre nodes is expected to be in China6. This tells us that China is making big investments away from the absolute cutting edge—and we have to remember that the world does need those chips as well.
It will be very difficult for any country to fully take in all aspects of the semiconductor supply chain, but we are seeing notable efforts to that end in 2022 that will likely continue.
Sources
1 Source: Yang, Zeyi. “Inside the software that will become the next battle front in US-China chip war.” MIT Technology Review. 18 August 2022
2 Source: Wikipedia Apple
3 Source: Thompson, Clive. “Inside the Most Complicated Machine on the Planet.” MIT Technology Review. Volume 124, Number 6, November/December 2021
4 Source: Thompson, November/December 2021
5 Source: Lin, Liza & Dan Strumpf. “Latest U.S. Chip Curbs Deliver Setback to China’s AI Ambitions.” Wall Street Journal. 1 September 2022
6 Source: Strumpf, Dan & Liza Lin. “China Bets Big on Basic Chips in Self-Sufficiency Push.” Wall Street Journal. 24 July 2022

Semis Monthly Wave CountIt seems we are heading towards the dot com bubble highs. This is great support and will serve for the next build up.

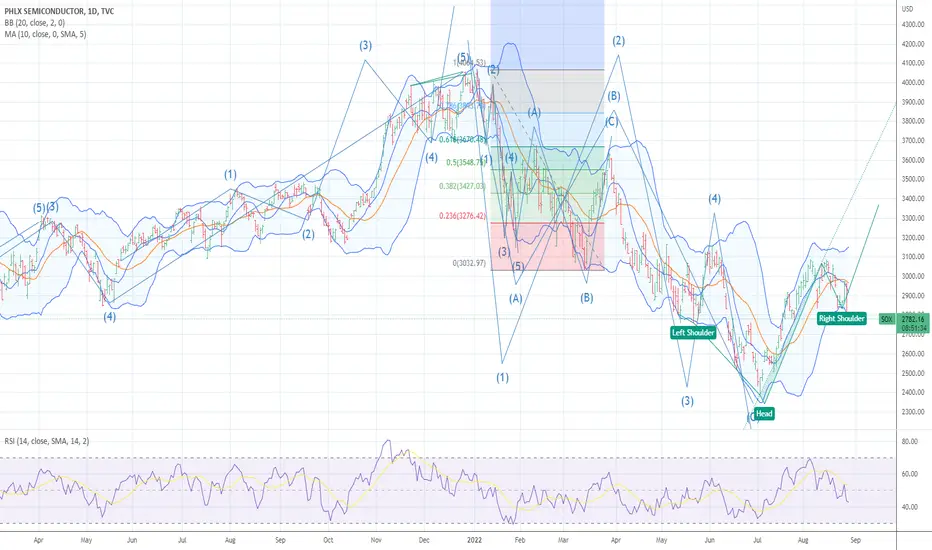
Head and ShouldersPrice has broken the neckline and this level has been tested and passed the test as a level of resistance since the break to the downside. This tells me it may be a valid neckline as sometimes a neckline is hard to pinpoint.
Not a super clear downtrend, yet.
There are levels of support under price and I did not draw them all.
I also see a divergence, bearish, between price and RSI between the 1st shoulder and the head of this pattern.
Large orange type are possible targets 1. Targets 2 are smaller and are possible targets if targets 1 are passed.
No recommendation.
Any pattern, trendline, or any level of support/resistance can fail.

SOX IS AT .786 AND AX 1.618 TODAY LOW THE CHART POSTED is that of the sox index if there was support this would be it for a wave B LOW

SOX INDEX BOTTOMED MOVE TO 75% PLUS NET LONG MARKET We now have an invented head n shoulder bottom and a wave 4 pullback look for a rally DO NOT BE SHORT ANYTHING
Are Semiconductors Stalling?The Philadelphia Semiconductor Index ripped about 29 percent between early July and early August, but now it may be showing signs of fatigue.
The first pattern on this chart is last Thursday’s peak of 3087 -- slightly below the early June high of 3159. That lower high is potentially noteworthy when compared with the broader Nasdaq-100, which pushed above the respective level on its chart to the highest since early May. It could be sign of relative weakness for chips.
Next is Monday’s doji candlestick, a potential reversal pattern. Also notice how SOX appears to have broken a rising trendline.
Third, the Relative Strength Index has retreated from near an overbought condition.
Finally, you have an increasingly mediocre news flow . Nvidia’s warning yesterday, combined with similar news from Intel and Western Digital , may reflect less-than-stellar fundamentals in chip stocks.
Given the market’s healthy bounce and falling volatility, SOX may not retest the 2022 lows. But it may have lost its mojo and chop around for a while as investors seek outperformance in other corners of the market.
TradeStation has, for decades, advanced the trading industry, providing access to stocks, options, futures and cryptocurrencies. See our Overview for more.
Important Information
TradeStation Securities, Inc., TradeStation Crypto, Inc., and TradeStation Technologies, Inc. are each wholly owned subsidiaries of TradeStation Group, Inc., all operating, and providing products and services, under the TradeStation brand and trademark. You Can Trade, Inc. is also a wholly owned subsidiary of TradeStation Group, Inc., operating under its own brand and trademarks. TradeStation Crypto, Inc. offers to self-directed investors and traders cryptocurrency brokerage services. It is neither licensed with the SEC or the CFTC nor is it a Member of NFA. When applying for, or purchasing, accounts, subscriptions, products, and services, it is important that you know which company you will be dealing with. Please click here for further important information explaining what this means.
This content is for informational and educational purposes only. This is not a recommendation regarding any investment or investment strategy. Any opinions expressed herein are those of the author and do not represent the views or opinions of TradeStation or any of its affiliates.
Investing involves risks. Past performance, whether actual or indicated by historical tests of strategies, is no guarantee of future performance or success. There is a possibility that you may sustain a loss equal to or greater than your entire investment regardless of which asset class you trade (equities, options, futures, or digital assets); therefore, you should not invest or risk money that you cannot afford to lose. Before trading any asset class, first read the relevant risk disclosure statements on the Important Documents page, found here: www.tradestation.com .

Recession is just starting and the Sox bubble comes to an endWell recession started since Q1 and yes, Q2 will be ugly too
Considering lowering of bitcoin.
Considering lowering of Nvidia+AMD stocks earnings
Considering lowering of TSMC, ASML earnings
+ end on market multiple
Then Sox have to sink deeply to 550.
The lowest value in 2009 is 168 so it's still 3 times higher than the lowest point and rich will remain rich. But latest buyer will suffer
Thanks for checking my other insight and have nice trade


$SOX Looking at a long term Bear$SOX has long been the growth engine of the $SPY. It has now entered a bear phase, being well below the 12 month SMA on the monthly chart, which now serves as resistance. We may be witnessing a paradigm shift in the market, where commodities, precious metals, and staples lead the market and the old growth stocks, lag. I hold no hope out for semiconductors at the moment.

LOOK for the EXIT NOW All indexes have now rallied back to drop the put/call and to peak in the time cycle peak march 25thn I maintain we are going to drop very hard into april 7/10
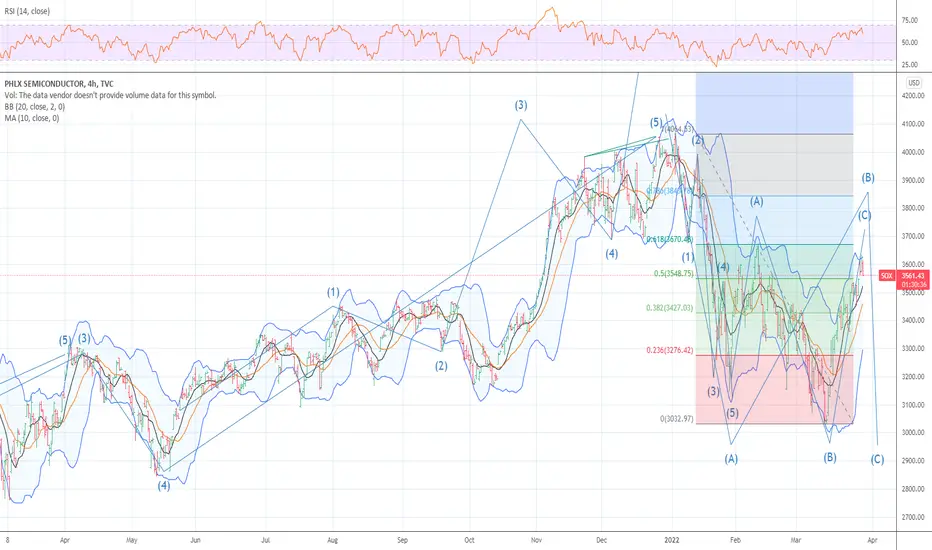
$SOX will continue to trend lower toward a target of 2975SOX continues to set lower lows. Two scenarios, one (green zig zag) is a reversal into cloud resistance to 3544. This would be a 78% extension from low point C. The other scenario (red zig zag) would be a 1.78% extension from point B. The RSI is in a solid downtrend, and the point & figure chart on the daily has a target of 3001. If I were waging bets, I would go with the 2975 target. The trend is your friend, until it ain't.

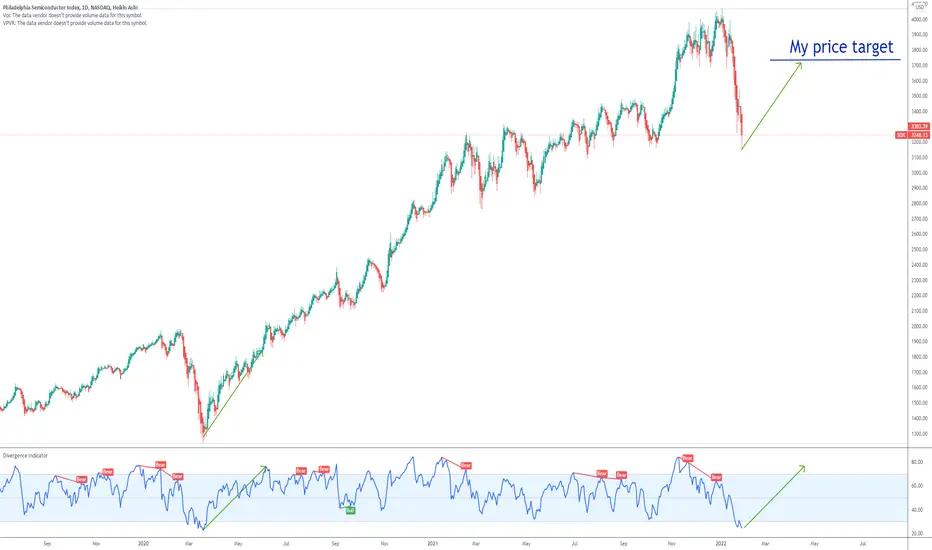
SOX PHLX Semiconductor Shortage won`t be solved anytime soon !!Secretary of Commerce Gina Raimondo:
“The semiconductor situation is going to take a long time to fix”
“This is one I feel confident saying it's not going to be fixed in a month or two, or six, or 12 months.”
For now PHLX Semiconductor (^SOX) is oversold and we can see in the chart what was the price movement after the last oversold area.
I expect to be the same now, since the semiconductor shortage won`t be solved anytime soon.
My price target is 3730.
Looking forward to read your opinion about it.
$SOX close to long running gap fillI have been waiting for a long while for SOX to fill that gap at 3592.76. Closed today at 3612 on the daily, and gap fill would put it at the bottom of Ichy cloud support, and just below 50% fib. Note the Gartey extension D at 1.38 right on the gap fill line. Should get a bounce from point D, and remember, SOX most always leads SPY....

5 WAVES UP ENDED LOOK FOR A CRASH We have ended into a Month in history with the highest level of major market tops outside of late aug 17 to sept 10 thru out the markets history . at THIS POINT and the wave structure as well as fib relationships within the the wave structure . I can now say we are setup for a CRASH cycle I think it has started and will see it over the next few days . the weekly rsi has not confirmed this rally as well as the nysi and nymo models put/call/ are not at any bottom or value nor is the naz dsi or fear greed index . BEST OF TRADES WAVETIMER
SOX, this market barometerAs I keep saying, the SOX is truly considered as the market barometer. And today, pre-US market open we have a clear engulfing candle that is also breaking the the Kijun Sen. Do we also have a double top? Of course, the candle still needs to close but nevertheless, it worth pointing it out for today's session.
Trade Safe, Trade Smart!
Glossary :
TS = Tenkan Sen | KS = Kijun Sen | LS = Lagging Span/Chikou Span
DLY = Daily | WLY = Weekly | MLY = Monthly
TL = Trend Line | TP = Take Profit | SL/INV = Stop Loss / Invalidation | TF = Timeframe
** THIS ANALYSIS IS MY OWN OPINION AND IS NOT A TRADING OR INVESTME NT ADVICE. ALWAYS TRADE WITH CARE **
