SOX trade ideas

Bearish SOXA Must-see chart on the Semiconductors, very similar to my SPX count. Just as with the other drop prior, we could see a double top here on the 4-hr. If this has a double top, I might try to find bearish positions in other names such as INTC.
I am simply just re-charting what I've seen on Bloomberg. Link to the video: www.youtube.com


SOX INDEX BOTTOM MOVING LONG NOW LOOK FOR THAT THOUGHT OVER INTO 2000 NOW WAVE 4 WAS .618 OF LAST UP LEG I AM NOW LONG SOXL 250

SOX - weekly cup and handle close to be completed.SOX look like as resistance is ahead. Weekly Cup and handle pattern very close to be complet. For me, it's a High tail warning but not confirmed. Lot of room below before to touch the lower trend line. SOX is still bullish until that happen only a breakout of weekly lower red trend line would change it for bearish.

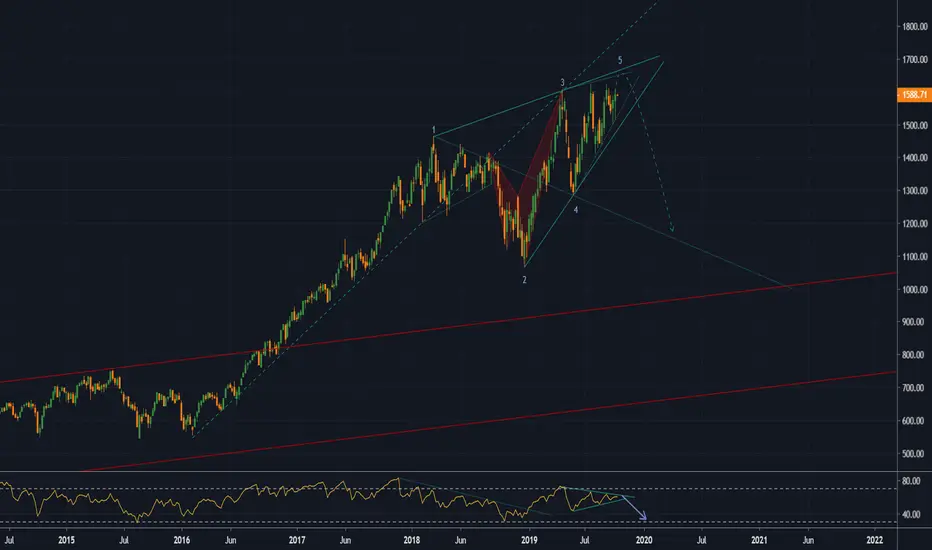
SOX A NEW WAVE JUST A HEAD WE ARE NOW AT A .382 OF WAVE C PULL BACK A 5 WAVE UP IS STILL IN PROGRESS

Semiconductor and Industrial 4.0Most people don't understand don't get it when it comes to market.
Because they think that by just looking at charts, that is more than enough to beat the market.
Remember, market are moved by whales and smart money.
Whales and smart money have COMPREHENSIVE PLAN on the market.
They are not obsessed or focused on SHORT TERM and INTRADAY moves. That's why seconds chart on trading view is a joke.
Whales and Smart Money knows about the presence of Industrial Revolution 4.0
If you are not aware, these books should already be on your reading list:
www.amazon.com
www.amazon.com
Remember, Schawb wrote this book in 2016 and then the next one in 2018, if you read the book in 2016 and you know that blockchain will be the next big thing, you are already know that Bitcoin and Crypto will be huge back then.
Also, most semiconductor stocks gave massive gain in 2017, all due to I.R 4.0
Here are the list of 4.0 theme:
1. Blockchain and Distributed Ledger Technologies
2. The Internet of Things
3. Artificial Intelligence and Robotics
4. Advanced Materials
5. Additive Manufacturing and Multidimensional Printing
6. Biotechnologies
7 Neurotechnologies
8 Virtual and Augmented Realities
9. Energy Capture, Storage and Transmission
10. Geoengineering
11. Space Technologies
Semiconductors play roles in blockchain, iot, ai, robotics and manufacturing. So, considering all of these multiple catalyst, shouldn't the semis go higher?
Anyone who just bought the dip from 2013 has been making a lot of money while those people who try to long and short and time the market are net loser.
This trend will continue until we reach peak expectations and when they are euphoria amongst the retailers and businesses, then that's the peak.
As long as everyone keeps calling for market to crash, then, market will grind higher in a wall of worry.
That's how market works. Deal with it.
Industrial 4.0 will overcome all the economic issues and economic policies. The catalyst is big enough that it will keep climbing and grinding higher.


SEMICONDUCTORS: Are you ready to get knocked off your SOX?Using Elliott wave one can determine once an uptrend has ended as the market simply has run out of waves. Here I assess the waves off the November 2008 low (yes the NASDAQ:SOX ) bottomed well before the other major US indices and has thus been a market leader since. However, it's price pattern off the December 2018 low is all but ideal and in elliott wave terms looks very much like a (very large) ending diagonal. In technical analysis terms its called a rising wedge. This is a bearish price pattern because once it completes, and it appears very close to completion especially considering today's price action, price will rapidly (here the time frame is weeks, so "rapidly" is relative) move back to the start of the diagonal which is around $1285. Given that the leader is in that case becoming the laggard, it will be quite obvious what this will do to the broader market indices. From that level we should see at least a decent bounce as ultimately the low 1000s should get revisited. Note that the big-picture elliott wave count for the TVC:SOX is not necessarily the same as for the other major US indices such as the TVC:SPX , NASDAQ:NDAQ or TVC:DJI as each index obvioulsy tracks different parts/segments of the overall economy and those are each at different stages of their social and business cycles, which is exactly what Elliott wave tracks and qualifies. Price will have to break above $1650 on the TVC:SOX to tell me my assessment of the chart is wrong, but given the very ragged (overlapping) price action this year, rather similar to October 2014-June 2015 and which was followed by an ~27% correction into early 2016, I prefer to err on the side of caution for now.
Trade Safe!


SEMICONDUCTORS HAVE TOPPED - MINIMUM 40% DOWNSIDE NEXT 12 MNTHSAs posted previously regarding SMH, here is another look at SEMICONDUCTORS via the SOX.
Semiconductor stocks have PEAKED after a major bull run (from a minimum of 2009 and possibly a lot longer 20-30yrs...this could be the end of a SUPERCYCLE). There is a fairly picturesque Elliott Wave count in play which suggests we are heading for a MINIMUM pullback of 40% and possibly as much as 60% over coming 12-24 months.

Semiconductor SOX Nears All Time High RSI Bearish Divergences !Perhaps no group in the market is more closely watched
for clues about future technology market direction that the Semiconductor Index (SOX)
The Philadelphia Semi Conductor: Line Break Chart" shows the recent bullish upside breakout,
as the index is now approaching all times highs, perhaps sensing optimism in the trade war talks with China.
However, just like other important major market indices,
the semiconductor index is showing clear important bearish RSI Divergences,
shown here on the long term "Line Break" Chart.
Traders looking for an upside breakout in the SOX ,should consider the consequences of their actions,
as a potential bull trap or technical" false breakout," could be waiting for them on the other side of the trade.
SOX Last 1574.39
THE_UNWIND
10/6/19
NEW YORK

SOX - Semiconductor index as the Growth Tech Cycle Dow TheorySOX - Semiconductor index as the Growth Tech Cycle Dow Theory, in this chart we see a climax divergence in 2001 and some spots in the current cycle.. similar way to see transports index as a measure of the dow theory. it would be nice if was easy to get an advance decline line or something similar in order to see the "breathe" of SOX, I am sure will also state that same divergence timing before SPX dropped hard.

Semiconductor (SOX) to gain 50-100% in the next 5-10 yearsThe trend is obvious.
Proud to be the only few longs on the stock market while everyone else is screaming crash and recession.
Semiconductors are going through secular trend.
It will still be cyclical but the cycles will be much smaller and limited.
Charts are telling us different story.
Market always moves ahead of narrative.
The narratives are there, buried below the noises.
Valuations might be expensive, but the total value creations and total addressable market are big.
The trend is obvious.
People will be left wondering why they have not seen this coming in 10 years to come.

Semicondutctor to Outperform NasdaqChart is more useful in telling a story.
And the story here is that the Semiconductor Index is testing an important Resistance Level versus Nasdaq.
Once it breaks, it will outperform Nasdaq.
This is inline with the thesis that Semiconductor industry will be net beneficiary of Industrial Revolution 4.0.
Don't be short term sighted. This is multi year/decade story and theme.
in 10/20 years, people will be shooting themselves on their foot for not seeing the obvious.


Meeting with tech executives on Huawei ban at White House - NewsReported by Reuters
White House economic adviser Larry Kudlow will host a meeting with semiconductor and software executives on Monday to discuss the U.S. ban on sales to China's Huawei Technologies Co Ltd , two sources briefed on the meeting said on Friday (July 20th).
Treasury Secretary Steven Mnuchin will also attend the White House event, to which chipmakers Intel Corp and Qualcomm Inc have been invited, the people said.
The subject of Huawei was expected "to come up but that it is not the reason why they are convening the meeting," said the official, who spoke on condition of anonymity.
The future of U.S. companies' ties to Huawei, the world's no. 1 maker of telecommunications equipment, remains uncertain after the Trump administration put the company on a blacklist in May, citing national security concerns.
One of the people briefed on Monday's meeting said Broadcom Inc was also invited to the White House event. Microsoft Corp was also expected to receive an invitation, the person said.
-----------------------------------
*We could possibly see some volatility this week with this meeting.


$SOX Phili Semi Index not finished with Volatility What a difference a few weeks make, things really have got very ugly very quickly, the POTUS is willing to use the tech industry as leverage against China in the escalating trade war. It may be a case that investors became complacent once again as when we now look in Hindsight at the indicators, they RSI, MACD and Stoch had all reached quite elevated levels and the Momentum indicator had started to decline quite drastically, and is now at a historic low.
One worrying element of the chart is that Gaps exist below, which is understandable given the velocity of the recovery from December lows, it is very likely that the decline will continue until those gaps are filled at a minimum. The outlook for trade is not good, so there is no stimulus but possibly more negative pre announcement from companies warning of earnings declines ,due to lost business in CHINA and Huawei in particular.
Broadcom, Nvidia, Amd, INTC and Xlnx have suffered horrendous losses in value since the beginning of May and it would take a brave or stupid investor to start buying while the sentiment is so poor.
The Semi stocks are often seen as leading indicators for the entire market, which was the case in 2018, from their January 2018 high they were bleeding lower while the market continued to rally until the october massacre set in.
We are Bulls but can only say, Proceed with extreme caution if you intent bottom feeding on these stocks.

When The Chips Are Down..The Market FollowsThe Philadelphia Semiconductor Index (SOX) is down over 3 % today
on fears of a new and more powerful retribution backlash from China
in the escalating 2019 trade war with the United States.
I have been following the stock market for decades now,
and if there is one relationship that you can count on, thru thick and thin
for trend analysis it's, the bullish/bearish posture of the semiconductor stocks.
I have included here the 4 Hour Chart of the Semi-Conductor Index,
along with 4 Hour Reletive Strength. It's not a pretty picture.
There will be some who will buy this dip, sensing opportunity,
however big money has already made it's decision to unload on the semi's at these levels
not wanting to wait, for additional bearish evidence, to confirm what they already seem to know.
SOX 1359.32 Last
THE_UNWIND
5/20/19
NEW YORK

